This media is no longer available.
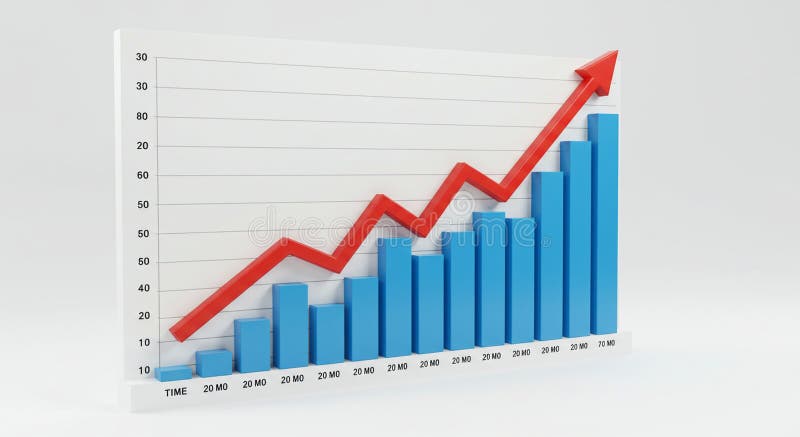
Line chart displaying two data trends with time on the horizontal axis. Red and blue lines represent separate data sets, marked with percentages and symbols like a dollar sign and thumbs up. The vertical axis shows values from 0 to 3, labeled by increments of 0. 50. Data points on the chart are annotated with percentages and numbers (e. g. , 19 , 20 , and 545). The style is minimalist with a plain background, using red for one trend and blue for the other.
Exclusively on Dreamstime
- ?
$62.50USD
$150.00USD
$250.00USD
Size MAX
8200x8200px •
27.3" x 27.3" • @300dpi •
1.6MB • jpg
Author credit line