Free with trial Nutrition test explained, a patient report with nutrient gauge bars and reference ranges, showing iron, vitamin D, magnesium, and zinc levels for quick interpretation. Outline diagram. Explained vectors Nutrition test explained, a patient report with nutrient gauge bars ... Nutrition test explained, a patient report with nutrient gauge bars and reference ranges. Nutrition test explained, a patient report with nutrient gauge bars and reference ranges, showing iron, vitamin D, magnesium, and zinc levels for quick interpretation. Outline diagram
Free with trial Biological clock circadian rhythm explained in a 24 hour wheel with circular clock, brain, and sun moon icons showing sleep, hormones, and alertness cycles. Outline diagram. Explained vectors Biological clock circadian rhythm explained in a 24 hour wheel ... Biological clock circadian rhythm explained in a 24 hour wheel with circular clock, brain. Biological clock circadian rhythm explained in a 24 hour wheel with circular clock, brain, and sun moon icons showing sleep, hormones, and alertness cycles. Outline diagram
Free with trial Pressure tank operation explained, pump cycles between filling and supply using a bladder and compressed air, key parts are pressure tank, pump, and pressure gauge. Outline diagram. Explained vectors Pressure tank operation explained, pump cycles between filling and supply ... Pressure tank operation explained, pump cycles between filling and supply using a. Pressure tank operation explained, pump cycles between filling and supply using a bladder and compressed air, key parts are pressure tank, pump, and pressure gauge. Outline diagram
Free with trial Pertussis explained shows transmission, symptom phases, and prevention, key visuals are Bordetella bacteria, coughing droplets, and vaccine syringe, summarizing disease stages. Outline diagram. Explained vectors Pertussis explained shows transmission, symptom phases, and prevention, key visuals ... Pertussis explained shows transmission, symptom phases, and prevention. Pertussis explained shows transmission, symptom phases, and prevention, key visuals are Bordetella bacteria, coughing droplets, and vaccine syringe, summarizing disease stages. Outline diagram
Free with trial Bronchiolitis explained contrasts healthy and inflamed airways, highlighting lungs, bronchioles, and mucus blockage to show restricted airflow in infants. Outline diagram. Explained vectors Bronchiolitis explained contrasts healthy and inflamed airways, highlighting lungs, bronchioles, ... Bronchiolitis explained contrasts healthy and inflamed. Bronchiolitis explained contrasts healthy and inflamed airways, highlighting lungs, bronchioles, and mucus blockage to show restricted airflow in infants. Outline diagram
Free with trial Interphase explained overview shows the cell cycle, G1, S, G2 around a cell, with nucleus and chromatin marked for growth and DNA replication, centrosomes labeled. Outline diagram. Explained vectors Interphase explained overview shows the cell cycle, G1, S, G2 ... Interphase explained overview shows the cell cycle, G1, S, G2 around a cell, with nucleus and. Interphase explained overview shows the cell cycle, G1, S, G2 around a cell, with nucleus and chromatin marked for growth and DNA replication, centrosomes labeled. Outline diagram
Free with trial Forgetting Curve explained, graph of memory decay across days, reviews boost retention. Key objects, retention curve, forgetting curve, time axis. Diagram. Explained vectors Forgetting Curve explained, graph of memory decay across days, reviews ... Forgetting Curve explained, graph of memory decay across days, reviews boost. Forgetting Curve explained, graph of memory decay across days, reviews boost retention. Key objects, retention curve, forgetting curve, time axis. Diagram
Free with trial Gigantism explained overview shows pituitary tumor causing excess growth hormone in blood and rapid height increase, brain, blood vessel, tall child compared to peer. Outline diagram. Explained vectors Gigantism explained overview shows pituitary tumor causing excess growth hormone ... Gigantism explained overview shows pituitary tumor causing excess growth. Gigantism explained overview shows pituitary tumor causing excess growth hormone in blood and rapid height increase, brain, blood vessel, tall child compared to peer. Outline diagram
Free with trial Sleep apnea explained, side-by-side airway cross-sections show. Normal, obstructed, and CPAP-treated breathing, key objects, airway, tongue, CPAP mask. Diagram. Explained vectors Sleep apnea explained, side-by-side airway cross-sections show. Normal, obstructed, and CPAP-treated breathing, key objects, airway, tongue, CPAP mask. Diagram
Free with trial Daytime sleepiness explained, a tired worker at a laptop with a low-battery icon illustrates causes and symptoms from poor sleep to fatigue and focus issues. Outline diagram. Explained vectors Daytime sleepiness explained, a tired worker at a laptop with ... Daytime sleepiness explained, a tired worker at a laptop with a low-battery icon illustrates. Daytime sleepiness explained, a tired worker at a laptop with a low-battery icon illustrates causes and symptoms from poor sleep to fatigue and focus issues. Outline diagram
Free with trial Forgetting curve explained, a decaying red line vs blue spaced. Repetition peaks on time and retention axes, showing reviews boost memory. Outline diagram. Explained vectors Forgetting curve explained, a decaying red line vs blue spaced. Repetition peaks on time and retention axes, showing reviews boost memory. Outline diagram
Free with trial Antibody explained, Y-shaped protein binds antigen to neutralize a virus, showing structure and binding sites. Key objects, antibody, antigen, pathogen. Outline diagram. Explained vectors Antibody explained, Y-shaped protein binds antigen to neutralize a. Virus, showing structure and binding sites. Key objects, antibody, antigen, pathogen
Free with trial Pheochromocytoma explained, adrenal gland tumor triggers excess catecholamines causing heart stress, key objects, adrenal gland, tumor, heart. Outline diagram. Explained vectors Pheochromocytoma explained, adrenal gland tumor triggers excess catecholamines causing heart ... Pheochromocytoma explained, adrenal gland tumor triggers excess. Pheochromocytoma explained, adrenal gland tumor triggers excess catecholamines causing heart stress, key objects, adrenal gland, tumor, heart. Outline diagram
Free with trial Teaching strategies explained briefly shows student-led, teacher-led, and tech-enhanced paths, lightbulb, group table, and gamepad highlight ideas and collaboration. Doodle style diagram. Explained vectors Teaching strategies explained briefly shows student-led, teacher-led, and. Tech-enhanced paths, lightbulb, group table, and gamepad highlight ideas and. Teaching strategies explained briefly shows student-led, teacher-led, and tech-enhanced paths, lightbulb, group table, and gamepad highlight ideas and collaboration. Doodle style diagram
Free with trial Forgetting curve explained, brief diagram shows memory retention declining, boosted by spaced reviews, brain, retention curve, time axis. Outline diagram. Explained vectors Forgetting curve explained, brief diagram shows memory retention declining, boosted ... Forgetting curve explained, brief diagram shows memory retention. Forgetting curve explained, brief diagram shows memory retention declining, boosted by spaced reviews, brain, retention curve, time axis. Outline diagram
Free with trial Hormone balance explained, a seesaw contrasts balance vs imbalance with estrogen, cortisol, and thyroid icons, showing mood, sleep, and cycle effects. Doodle style diagram. Explained vectors Hormone balance explained, a seesaw contrasts balance vs imbalance with ... Hormone balance explained, a seesaw contrasts balance vs imbalance with estrogen. Hormone balance explained, a seesaw contrasts balance vs imbalance with estrogen, cortisol, and thyroid icons, showing mood, sleep, and cycle effects. Doodle style diagram
Free with trial Accessibility standards explained with icons for visual, auditory, motor, and cognitive needs, plus key principles and laws. Outline diagram. Explained vectors Accessibility standards explained with icons for visual, auditory, motor, and ... Accessibility standards explained with icons for visual, auditory, motor, and. Accessibility standards explained with icons for visual, auditory, motor, and cognitive needs, plus key principles and laws. Outline diagram
Free with trial Hormone replacement explained shows menopause and andropause, with woman and man figures, primary hormones and delivery methods like pills and patches. Doodle style diagram. Explained vectors Hormone replacement explained shows menopause and andropause, with woman and ... Hormone replacement explained shows menopause and andropause, with woman and. Hormone replacement explained shows menopause and andropause, with woman and man figures, primary hormones and delivery methods like pills and patches. Doodle style diagram
Free with trial Emission scopes explained shows Scope 1, 2, 3 emissions with arrows, icons for company, vehicles, and factories. Outline diagram. Explained vectors Emission scopes explained shows Scope 1, 2, 3 emissions with ... Emission scopes explained shows Scope 1, 2, 3 emissions with arrows, icons for company. Emission scopes explained shows Scope 1, 2, 3 emissions with arrows, icons for company, vehicles, and factories. Outline diagram
Free with trial Economics Infographic 8 Key Concepts Explained colorful. Ideal for presentations, educational content, and business strategy template, Timeline, banner, diagram, web design. Explained vectors Economics Infographic 8 Key Concepts Explained colorful. Ideal for presentations, educational content, and business strategy template, Timeline, banner
Free with trial Emission scopes explained using a brief diagram showing clouds, arrows, and business activities to clarify Scope 1, 2, and 3 emissions. Doodle style diagram. Explained vectors Emission scopes explained using a brief diagram showing clouds, arrows, ... Emission scopes explained using a brief diagram showing clouds, arrows, and business. Emission scopes explained using a brief diagram showing clouds, arrows, and business activities to clarify Scope 1, 2, and 3 emissions. Doodle style diagram
Free with trial Bacteria explained medical concept colorful microbes abstract shapes floating surrounded by organic elements blue. Background website banner Vector illustration. Explained vectors Bacteria explained medical concept colorful microbes abstract shapes floating surrounded by organic elements blue. Background website banner Vector illustration
Free with trial This image showcases various fundamental user interface elements and icons used in software and web applications. It includes UI components like browsers, search bars, buttons, toggles, and other interactive symbols essential for user navigation and interaction design. Explained vectors Common User Interface Elements and Interaction Icons Explained Visually. This image showcases various fundamental user interface elements and icons used in. This image showcases various fundamental user interface elements and icons used in software and web applications. It includes UI components like browsers, search bars, buttons, toggles, and other interactive symbols essential for user navigation and interaction design
Free with trial Kidney conditions explained healthy anatomy, stones, tumors, and the path to recovery visually. Explained vectors Kidney conditions explained healthy anatomy, stones, tumors, and the path to recovery visually
Free with trial Economics Infographic 8 Key Concepts Explained colorful. Ideal for presentations, educational content, and business strategy template, Timeline, banner, diagram. Explained vectors Economics Infographic 8 Key Concepts Explained colorful. Ideal for presentations, educational content, and business strategy template, Timeline, banner
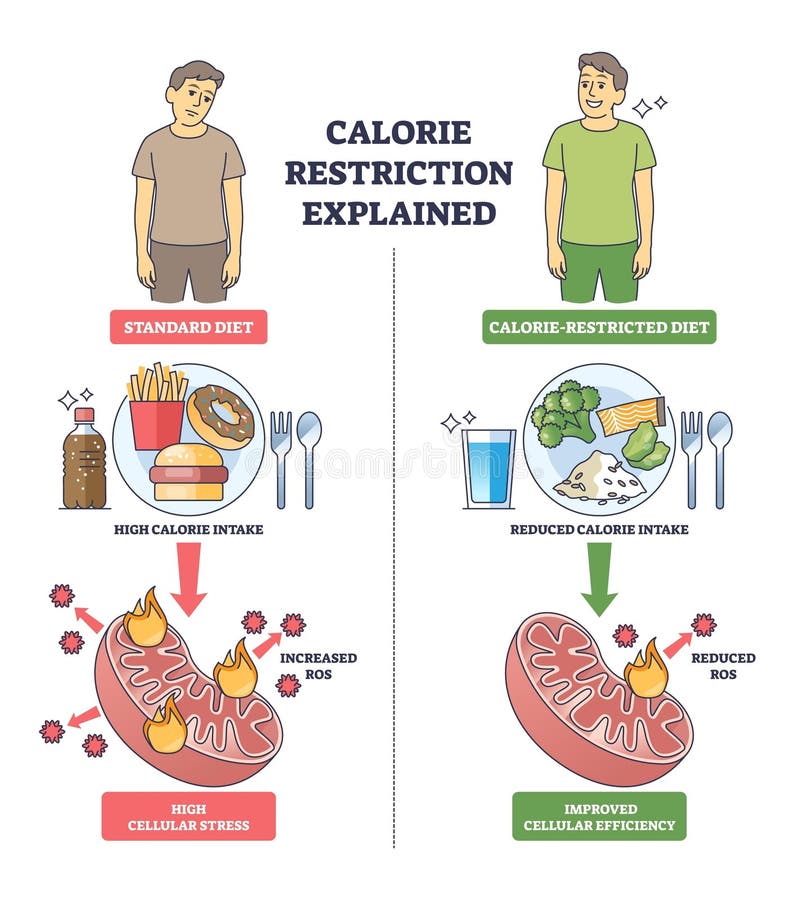
Free with trial Calorie restriction explained shows a brief comparison of standard vs reduced calorie diets, food plates and mitochondria depict ROS changes and cellular efficiency. Outline diagram. Explained vectors Calorie restriction explained shows a brief comparison of standard vs ... Calorie restriction explained shows a brief comparison of standard vs reduced calorie. Calorie restriction explained shows a brief comparison of standard vs reduced calorie diets, food plates and mitochondria depict ROS changes and cellular efficiency. Outline diagram
Free with trial Accessibility standards explained using a doodle style diagram with icons for disability types, POUR principles, and key laws. Doodle style diagram. Explained vectors Accessibility standards explained using a doodle style diagram with icons ... Accessibility standards explained using a doodle style diagram with icons for. Accessibility standards explained using a doodle style diagram with icons for disability types, POUR principles, and key laws. Doodle style diagram
Free with trial Inflation Explained equation doodle where saving plus investing beats rising vector illustration. Flat vector illustration. Explained vectors Inflation Explained equation doodle where saving plus investing beats rising vector illustration. Flat vector illustration
Free with trial Artificial Intelligence Explained mind map doodle with assistants smart cars vector illustration. Flat vector illustration. Explained vectors Artificial Intelligence Explained mind map doodle with assistants smart cars vector illustration. Flat vector illustration
Free with trial Vector infographic explaining TCP vs UDP with one example: the same packet is lost on both sides. TCP opens a connection with a three-way handshake, sends numbered segments, gets an acknowledgement asking for the missing one, resends it and delivers everything complete and in order. UDP skips setup, sends datagrams at once, never confirms or repeats them, and hands the application whatever arrives, gaps included. Time bars show the extra round trips that reliability costs. Explained vectors TCP vs UDP Explained with an Example - Reliable Ordered Delivery vs Fast Best-Effort Datagrams. Vector infographic explaining TCP vs UDP with one example: the. Vector infographic explaining TCP vs UDP with one example: the same packet is lost on both sides. TCP opens a connection with a three-way handshake, sends numbered segments, gets an acknowledgement asking for the missing one, resends it and delivers everything complete and in order. UDP skips setup, sends datagrams at once, never confirms or repeats them, and hands the application whatever arrives, gaps included. Time bars show the extra round trips that reliability costs.
Free with trial Climate Change Explained checklist doodle with ride more clean energy and plant vector illustration. Flat vector illustration. Explained vectors Climate Change Explained checklist doodle with ride more clean energy and plant vector illustration. Flat vector illustration
Free with trial A transparent background PNG file allows images, icons, and graphics to appear without any visible background. Unlike JPG files, PNG supports an alpha channel that makes the background fully transparent, not white or fake. Transparent background PNGs are widely used in graphic design, web design, mobile apps, logos, presentations, and stock marketplaces. Explained vectors Transparent Background PNG Explained for Graphic Design Vector. A transparent background PNG file allows images, icons, and graphics to appear without any. A transparent background PNG file allows images, icons, and graphics to appear without any visible background. Unlike JPG files, PNG supports an alpha channel that makes the background fully transparent, not white or fake. Transparent background PNGs are widely used in graphic design, web design, mobile apps, logos, presentations, and stock marketplaces
Free with trial Laparoscopic cholecystectomy explained, instruments insert through small incisions to clip cystic duct and remove the gallbladder, highlights laparoscope, gallbladder, surgical clips. Outline diagram. Explained vectors Laparoscopic cholecystectomy explained, instruments insert through small incisions to clip ... Laparoscopic cholecystectomy explained, instruments insert. Laparoscopic cholecystectomy explained, instruments insert through small incisions to clip cystic duct and remove the gallbladder, highlights laparoscope, gallbladder, surgical clips. Outline diagram
Free with trial Visual representation comparing carbon dioxide emissions from driving a car cycling and generating energy with solar panels highlighting sustainable energy choices for a greener planet. Explained vectors Co2 emissions from cars bicycles and solar power alternatives explained visually. Visual representation comparing carbon dioxide emissions from driving a car. Visual representation comparing carbon dioxide emissions from driving a car cycling and generating energy with solar panels highlighting sustainable energy choices for a greener planet
Free with trial Vector infographic explaining SQL vs NoSQL with a single example: a customer places an online order from a shop or phone. Above, a relational database splits that purchase across customer, order and item tables linked by keys, joins them on read, saves payment and stock together as an ACID transaction, and usually scales up on a bigger server. Below, a document database keeps everything in one flexible record, needs no join, and spreads complete documents across many machines. Explained vectors SQL vs NoSQL - explained with an online order: linked tables with joins and ACID, or one flexible document spread across servers. Vector infographic explaining. Vector infographic explaining SQL vs NoSQL with a single example: a customer places an online order from a shop or phone. Above, a relational database splits that purchase across customer, order and item tables linked by keys, joins them on read, saves payment and stock together as an ACID transaction, and usually scales up on a bigger server. Below, a document database keeps everything in one flexible record, needs no join, and spreads complete documents across many machines.
Free with trial Vector infographic explaining monolith vs microservices with one example: a customer places an online order from a shop or phone. On the left, one application holds orders, payment, stock and delivery calls stay in-process and everything shares a database, so the whole app is deployed and scaled together and a fault can stop it. On the right, a gateway routes the order to separate services that talk over the network, each owning its data, released and scaled alone, with failures contained. Explained vectors Monolith vs microservices explained with an online order: one app and shared database, or separate services with their own data.:. Vector infographic explaining. Vector infographic explaining monolith vs microservices with one example: a customer places an online order from a shop or phone. On the left, one application holds orders, payment, stock and delivery calls stay in-process and everything shares a database, so the whole app is deployed and scaled together and a fault can stop it. On the right, a gateway routes the order to separate services that talk over the network, each owning its data, released and scaled alone, with failures contained.
Free with trial Hair growth cycle illustration showing anagen, catagen, and telogen stages. Great for science, medical education, and dermatology related projects. Explained vectors Hair growth cycle stages explained for medical illustration and science education. Hair growth cycle illustration showing anagen, catagen, and telogen stages. Hair growth cycle illustration showing anagen, catagen, and telogen stages. Great for science, medical education, and dermatology related projects
Free with trial The Tyndall effect occurs when light scatters as it passes through a colloid, distinguishing it from solutions (no scattering) and suspensions (larger particles, more scattering. Explained vectors Tyndall Effect in Solutions, Colloids, and Suspensions Light Scattering Explained. The Tyndall effect occurs when light scatters as it passes through a colloid. The Tyndall effect occurs when light scatters as it passes through a colloid, distinguishing it from solutions (no scattering) and suspensions (larger particles, more scattering
Free with trial The image showcases various user interface components commonly used in web applications, including search bars, input fields, forms for usernames and emails, password fields, and chat bubbles. It highlights the interaction design aspects and user experience elements essential for creating intuitive and user-friendly digital products. Explained vectors User Interface Design Elements for Modern Web Applications Explained. The image showcases various user interface components commonly used in web applications. The image showcases various user interface components commonly used in web applications, including search bars, input fields, forms for usernames and emails, password fields, and chat bubbles. It highlights the interaction design aspects and user experience elements essential for creating intuitive and user-friendly digital products
Free with trial Visually breaking down ADHD symptoms: attention issues, deficit, hyperactivity, and disorder. Essential for understanding and awareness. Explained vectors Understanding ADHD: Attention, Deficit, Hyperactivity, and Disorder explained visually. Visually breaking down ADHD symptoms: attention issues, deficit. Visually breaking down ADHD symptoms: attention issues, deficit, hyperactivity, and disorder. Essential for understanding and awareness
Free with trial This image showcases various fundamental user interface components and interaction icons used in software design. It includes examples of buttons, input fields, checkboxes, radio buttons, notifications, search tools, and windows. These elements are essential for creating intuitive and user-friendly applications and websites. Explained vectors Common User Interface Elements and Interaction Icons Explained Visually. This image showcases various fundamental user interface components and interaction icons. This image showcases various fundamental user interface components and interaction icons used in software design. It includes examples of buttons, input fields, checkboxes, radio buttons, notifications, search tools, and windows. These elements are essential for creating intuitive and user-friendly applications and websites
Free with trial This image visually represents various core functions of Human Resources (HR). It includes recruitment, compliance with laws, global workforce management, performance evaluation, and employee relations. HR is depicted as crucial for balancing fairness, improving work environments, and ensuring organizational success. Explained vectors Key Aspects and Responsibilities of Human Resources Management Explained. This image visually represents various core functions of Human Resources (HR). It. This image visually represents various core functions of Human Resources (HR). It includes recruitment, compliance with laws, global workforce management, performance evaluation, and employee relations. HR is depicted as crucial for balancing fairness, improving work environments, and ensuring organizational success
Free with trial Explore the intricate layers of human skin and the structure of a hair follicle in this educational visual. Understand epidermis dermis and subcutaneous tissue functions. Explained vectors Detailed cross-sectional view of human skin layers and hair follicle anatomy explained. Explore the intricate layers of human skin and the structure of a hair. Explore the intricate layers of human skin and the structure of a hair follicle in this educational visual. Understand epidermis dermis and subcutaneous tissue functions
Free with trial Thermodynamic systems study energy exchanges and transformations, including heat, work, and internal energy, governed by the laws of thermodynamics. Explained vectors Thermodynamic Systems Energy Exchanges and Transformations Explained. Thermodynamic systems study energy exchanges and transformations, including heat, work, and. Thermodynamic systems study energy exchanges and transformations, including heat, work, and internal energy, governed by the laws of thermodynamics
Free with trial Interlocking Triangles in Circles: Geometric Star Patterns Explained.. The first circle is white with a design composed of lines forming a hexagon and two overlapping triangles, resembling a six-pointed star. .. The second circle is black with the same geometric design outlined in white. The third circle is filled with color, with triangles in blue, green, red, and yellow, separated by black lines. Explained vectors Interlocking Triangles in Circles: Geometric Star Patterns Explained. The first circle is white with a design composed of lines forming a hexagon and two. Interlocking Triangles in Circles: Geometric Star Patterns Explained ..The first circle is white with a design composed of lines forming a hexagon and two overlapping triangles, resembling a six-pointed star. ..The second circle is black with the same geometric design outlined in white. The third circle is filled with color, with triangles in blue, green, red, and yellow, separated by black lines
Free with trial An informative vector illustration explaining different plant root systems with clear labels, including taproot, fibrous, and tuberous roots. Ideal for educational materials, botanical studies, gardening guides, or scientific presentations. This detailed diagram helps visualize essential plant structures, perfect for learning, vector design Generative AI. Explained vectors Different plant root systems explained with labels. vector design Generative AI. An informative vector illustration explaining different plant root systems with. An informative vector illustration explaining different plant root systems with clear labels, including taproot, fibrous, and tuberous roots. Ideal for educational materials, botanical studies, gardening guides, or scientific presentations. This detailed diagram helps visualize essential plant structures, perfect for learning, vector design Generative AI
Free with trial Illustration of a blockchain network featuring four circular elements connected by dotted lines. Elements include a network of nodes, a server representing ledgers, a computing chip labeled "Giner Outaflut," and a lightbulb indicating smart contracts. Each component is labeled, with text: "Blockchain," "Ledgers," "Giner Outaflut," "Smart Contract. " The background has technology-related icons, emphasizing digital context. The diagram visually links blockchain concepts for educational purposes. Explained vectors Blockchain Network With Educational Labels Explained. Illustration of a blockchain network featuring four circular elements connected by dotted lines. Elements. Illustration of a blockchain network featuring four circular elements connected by dotted lines. Elements include a network of nodes, a server representing ledgers, a computing chip labeled "Giner Outaflut," and a lightbulb indicating smart contracts. Each component is labeled, with text: "Blockchain," "Ledgers," "Giner Outaflut," "Smart Contract." The background has technology-related icons, emphasizing digital context. The diagram visually links blockchain concepts for educational purposes.
Free with trial An informative vector illustration outlining credit card features such as online purchases, cash advances, and rewards programs. This graphic is ideal for financial education, banking product explanations, or consumer credit guidance, clearly presenting the value of a credit card, vector design Generative AI. Explained vectors Credit Card Features and Rewards Programs Explained, vector design Generative AI. An informative vector illustration outlining credit card features such as. An informative vector illustration outlining credit card features such as online purchases, cash advances, and rewards programs. This graphic is ideal for financial education, banking product explanations, or consumer credit guidance, clearly presenting the value of a credit card, vector design Generative AI
Free with trial Different types of brackets include round (parentheses), square, curly, and angle brackets. They are used in writing, math, coding, and to group expressions. Explained vectors Different Types of Brackets Parentheses, Square, Curly, and Angle Brackets Explained. Different types of brackets include round (parentheses), square, curly, and. Different types of brackets include round (parentheses), square, curly, and angle brackets. They are used in writing, math, coding, and to group expressions
Free with trial Different types of brackets include round (parentheses), square, curly, and angle brackets. They are used in writing, math, coding, and to group expressions. Explained vectors Different Types of Brackets Parentheses, Square, Curly, and Angle Brackets Explained. Different types of brackets include round (parentheses), square, curly, and. Different types of brackets include round (parentheses), square, curly, and angle brackets. They are used in writing, math, coding, and to group expressions
Free with trial Learn about the key features of desktop computers. Explained vectors Key Features of Desktop Computers Explained. Learn about the key features of desktop computers. Learn about the key features of desktop computers.
Free with trial Explore the key benefits of automated testing in development. Explained vectors Key Benefits of Automated Testing Explained. Explore the key benefits of automated testing in development. Explore the key benefits of automated testing in development.
Free with trial A complex diagram on a whiteboard outlines future technology concepts and innovations. This visual representation connects various ideas and components for advanced technological development. Explained vectors Futuristic technology diagram whiteboard innovations future tech concepts explained. A complex diagram on a whiteboard outlines future technology concepts and. A complex diagram on a whiteboard outlines future technology concepts and innovations. This visual representation connects various ideas and components for advanced technological development
Free with trial Explore the fascinating concept of future technology seamlessly melting into commerce. This image symbolizes the integration of innovation and the evolving digital marketplace. Explained vectors Future technology melting into commerce seamless integration and innovation explained. Explore the fascinating concept of future technology seamlessly melting. Explore the fascinating concept of future technology seamlessly melting into commerce. This image symbolizes the integration of innovation and the evolving digital marketplace
Free with trial Clear diagram illustrating the stoning ritual steps in Mina, visually explaining Hajj pilgrimage procedures, religious rites, and sacred practices vector design Generative AI. Explained vectors Stoning ritual diagram in Mina, Hajj pilgrimage steps explained visually vector design Generative AI. Clear diagram illustrating the stoning ritual steps in Mina. Clear diagram illustrating the stoning ritual steps in Mina, visually explaining Hajj pilgrimage procedures, religious rites, and sacred practices vector design Generative AI
Free with trial A clear and informative diagram illustrating the process of photosynthesis, showing how plants convert carbon dioxide and sunlight into oxygen and energy. This essential graphic is perfect for educational purposes, science textbooks, or environmental presentations, explaining one of nature's most fundamental processes, vector design Generative AI. Explained vectors Photosynthesis Process Explained Diagram, vector design Generative AI. A clear and informative diagram illustrating the process of photosynthesis, showing how. A clear and informative diagram illustrating the process of photosynthesis, showing how plants convert carbon dioxide and sunlight into oxygen and energy. This essential graphic is perfect for educational purposes, science textbooks, or environmental presentations, explaining one of nature's most fundamental processes, vector design Generative AI
Free with trial Plant hormones chart explaining abscisic acid and other hormones, essential for botanical education, enhancing knowledge of plant physiology and hormonal regulation vector design Generative AI. Explained vectors Plant hormones chart: Abscisic acid and other hormones explained for botanical education vector design Generative AI. Plant hormones chart explaining abscisic. Plant hormones chart explaining abscisic acid and other hormones, essential for botanical education, enhancing knowledge of plant physiology and hormonal regulation vector design Generative AI
Free with trial Xylem and Phloem chart explaining plant structure, essential for biology and botanical studies, aiding in understanding plant anatomy vector design Generative AI. Explained vectors Xylem and Phloem chart: Plant structure explained for biology and botanical studies vector design Generative AI. Xylem and Phloem chart explaining plant. Xylem and Phloem chart explaining plant structure, essential for biology and botanical studies, aiding in understanding plant anatomy vector design Generative AI
Free with trial Plant hormones chart explaining the fruit ripening process, ideal for botanical science education and enhancing understanding of plant biology vector design Generative AI. Explained vectors Plant hormones chart: Fruit ripening process explained for botanical science education vector design Generative AI. Plant hormones chart explaining the fruit. Plant hormones chart explaining the fruit ripening process, ideal for botanical science education and enhancing understanding of plant biology vector design Generative AI
Free with trial Explore key aspects of the Apache License in detail. Explained vectors Key Aspects of Apache License Explained. Explore key aspects of the Apache License in detail. Explore key aspects of the Apache License in detail.
Free with trial HAJI Glossary visually explaining key terms related to Hajj, informative guide for Islamic pilgrimage with icons vector design Generative AI. Explained vectors HAJI Glossary, key terms explained visually, Islamic pilgrimage guide, Hajj terms vector design Generative AI. HAJI Glossary visually explaining key terms. HAJI Glossary visually explaining key terms related to Hajj, informative guide for Islamic pilgrimage with icons vector design Generative AI
Free with trial Learn about essential technologies used in 3D printers. Explained vectors Essential 3D Printer Technologies Explained. Learn about essential technologies used in 3D printers. Learn about essential technologies used in 3D printers.
Free with trial Learn the key principles of agile development methodologies. Explained vectors Key Principles of Agile Development Explained. Learn the key principles of agile development methodologies. Learn the key principles of agile development methodologies.
Free with trial Explore key features of access control lists in security. Explained vectors Key Features of Access Control Lists Explained. Explore key features of access control lists in security. Explore key features of access control lists in security.
Free with trial Symptoms of myasthenia gravis include droopy eyelids (ptosis), blurry or double vision (diplopia), fatigue, difficulty speaking, swallowing, or chewing, limited facial expression, and trouble breathing. The development is explained through a diagram showing normal neuromuscular function versus impaired function in myasthenia gravis (MG). In normal function, acetylcholine receptors facilitate muscle contraction, while in MG, antibodies block these receptors, reducing transmission and impairing muscle contraction. This illustration highlights the effects on neuromuscular transmission. Explained vectors Myasthenia Gravis symptoms. Symptoms of myasthenia gravis include droopy eyelids (ptosis), blurry or double vision (diplopia), fatigue, difficulty speaking. Symptoms of myasthenia gravis include droopy eyelids (ptosis), blurry or double vision (diplopia), fatigue, difficulty speaking, swallowing, or chewing, limited facial expression, and trouble breathing. The development is explained through a diagram showing normal neuromuscular function versus impaired function in myasthenia gravis (MG). In normal function, acetylcholine receptors facilitate muscle contraction, while in MG, antibodies block these receptors, reducing transmission and impairing muscle contraction. This illustration highlights the effects on neuromuscular transmission.
Free with trial Plant hormones chart explaining the seed germination process, useful for botanical learning and education, enhancing knowledge of plant growth stages vector design Generative AI. Explained vectors Plant hormones chart: Seed germination process explained for botanical learning and education vector design Generative AI. Plant hormones chart explaining the. Plant hormones chart explaining the seed germination process, useful for botanical learning and education, enhancing knowledge of plant growth stages vector design Generative AI
Free with trial Professional cloud of air pumped out heavily, explaining usage and purpose in environmental concepts. Explained vectors Professional Cloud of Air Pumped Out Heavily - Usage and Purpose Explained. Professional cloud of air pumped out heavily, explaining usage and purpose in. Professional cloud of air pumped out heavily, explaining usage and purpose in environmental concepts.
Free with trial An illustration of binary fission in amoeba shows the cell dividing into two identical daughter cells through nucleus and cytoplasm division. Explained vectors Illustration of Binary Fission in Amoeba Asexual Reproduction Explained. An illustration of binary fission in amoeba shows the cell dividing into two identical. An illustration of binary fission in amoeba shows the cell dividing into two identical daughter cells through nucleus and cytoplasm division
Free with trial Patients carry out medical consultations online. The doctor explained from the cellphone screen. Online Medical Consultation concept. Flat vector illustration. Explained vectors Patients carry out medical consultations online. The doctor explained from the cellphone screen. Online Medical Consultation concept. Flat vector illustration
Free with trial Professional cloud of air pumped out heavily, explaining usage and purpose in environmental concepts. Explained vectors Professional Cloud of Air Pumped Out Heavily - Usage and Purpose Explained. Professional cloud of air pumped out heavily, explaining usage and purpose in. Professional cloud of air pumped out heavily, explaining usage and purpose in environmental concepts.
Free with trial Explore the key features that define diodes. Explained vectors Key Features of Diodes Explained. Explore the key features that define diodes. Explore the key features that define diodes.
Free with trial An icon illustrating key stages of the sales funnel. Explained vectors Key Stages of the Sales Funnel Explained. An icon illustrating key stages of the sales funnel. An icon illustrating key stages of the sales funnel.
Free with trial Gain insights into various DevOps methodologies. Explained vectors Understanding DevOps Methodologies Explained. Gain insights into various DevOps methodologies. Gain insights into various DevOps methodologies.
Free with trial Dental Root Canal Treatment Stages Explained Visually. This infographic illustrates the stages of a root canal procedure. Explained vectors Dental Root Canal Treatment Stages Explained Visually. This infographic illustrates the stages of a root canal procedure
Free with trial An informational design for Hajj beginners, explaining key rituals in a simple way, serving as a guide for understanding Islamic pilgrimage vector design Generative AI. Explained vectors Hajj for beginners, key rituals explained simply guide vector design Generative AI. An informational design for Hajj beginners, explaining key rituals in a. An informational design for Hajj beginners, explaining key rituals in a simple way, serving as a guide for understanding Islamic pilgrimage vector design Generative AI
Free with trial Explore key principles of acceptance testing and their applications. Explained vectors Key Principles of Acceptance Testing Explained. Explore key principles of acceptance testing and their applications. Explore key principles of acceptance testing and their applications.
Free with trial Explanation of Hajj terms Tamattu, Qiran, and Ifrad, detailing different types of pilgrimage in Islam, providing educational content on Hajj rituals vector design Generative AI. Explained vectors Hajj terms explained, Tamattu, Qiran, Ifrad types of pilgrimage vector design Generative AI. Explanation of Hajj terms Tamattu, Qiran, and Ifrad, detailing. Explanation of Hajj terms Tamattu, Qiran, and Ifrad, detailing different types of pilgrimage in Islam, providing educational content on Hajj rituals vector design Generative AI
Free with trial Discover the benefits of freelance work and how self-employment empowers individuals to find success with online freelance platforms. Explained vectors Self-Employment Explained a Freelancer’s Guide to Success on Freelancing Work from Home. Discover the benefits of freelance work and how self-employment. Discover the benefits of freelance work and how self-employment empowers individuals to find success with online freelance platforms.
Free with trial Explore freelance work with this abstract concept illustrated through digital vectors. Learn about freelancer jobs, remote work, and self-employment opportunities online. Explained vectors Freelance Work Abstract Concept and Digital Vector Art Illustration Design Explained. Explore freelance work with this abstract concept illustrated through. Explore freelance work with this abstract concept illustrated through digital vectors. Learn about freelancer jobs, remote work, and self-employment opportunities online.
Free with trial Complex carbs overview shows how oatmeal, whole-wheat bread, and chickpeas connect to long-chain molecules and deliver slow, steady energy across time. Outline diagram. Explained vectors Complex carbs overview shows how oatmeal, whole-wheat bread, and. Chickpeas connect to long-chain molecules and deliver slow, steady energy across time. Outline
 Sign in