Free with trial Greenhouse effect shows how solar radiation, Earths surface, and greenhouse gases interact to trap heat. Doodle style diagram. Explained vectors Greenhouse effect shows how solar radiation, Earths surface, and greenhouse ... Greenhouse effect shows how solar radiation, Earths surface, and greenhouse. Greenhouse effect shows how solar radiation, Earths surface, and greenhouse gases interact to trap heat. Doodle style diagram
Free with trial Agentic AI workflow diagram - AI Agent work explained - Perceive Reason Act - isometric technology infographic with AI agent, digital eye, gears icons vector. Explained vectors Agentic AI workflow diagram - isometric technology infographic. Agentic AI workflow diagram - AI Agent work explained - Perceive Reason Act - isometric. Agentic AI workflow diagram - AI Agent work explained - Perceive Reason Act - isometric technology infographic with AI agent, digital eye, gears icons vector
Free with trial Deep learning and neural networks: multiple layers in deep learning. Explained vectors Deep learning and neural networks. Multiple layers in deep learning
Free with trial Medical infographic explaining myopia, normal vision, and corrective measures with concave lenses. Ideal for eye health education and visual clarity topics. Ophthalmology content nearsightedness. Explained vectors Myopia Explained with Infographic on Normal Vision and Corrective Concave Lens Solutions. Medical infographic explaining myopia, normal vision, and corrective. Medical infographic explaining myopia, normal vision, and corrective measures with concave lenses. Ideal for eye health education and visual clarity topics. Ophthalmology content nearsightedness
Free with trial Drill bits and shanks, categorized by material and application including wood, metal, and masonry diagram hand drawn schematic vector. Science educational illustration. Explained vectors Types of Drill Bits and Shanks Explained Visually. Drill bits and shanks, categorized by material and application including wood, metal, and masonry diagram hand. drill bits and shanks, categorized by material and application including wood, metal, and masonry diagram hand drawn schematic vector. Science educational illustration
Free with trial QR code and the process of scanning, decoding, and accessing information using a smartphone diagram hand drawn schematic vector. Science educational illustration. Explained vectors How QR Code Works Structure and Scanning Explained. QR code and the process of scanning, decoding, and accessing information using a smartphone diagram hand. QR code and the process of scanning, decoding, and accessing information using a smartphone diagram hand drawn schematic vector. Science educational illustration
Free with trial Color Theory Essentials RGB vs CMYK. Color Wheel and Digital Color Modes. Understanding Color Mixing in Design. Color. Models Explained. Explained vectors Color Theory Essentials RGB vs CMYK. Color Wheel and Digital Color Modes. Understanding Color Mixing in Design. Color. Models Explained
Free with trial Deep learning and neural networks: multiple layers in deep learning. Explained vectors Deep learning and neural networks. Multiple layers in deep learning
Free with trial Illustration showing Hypermetropia or farsightedness where distant objects appear clear but nearby objects are blurred, explained with human eye structure and lens diagram. Explained vectors Labeled Diagram Explaining Eye Defect Hypermetropia and Its Image Formation. Illustration showing Hypermetropia or farsightedness where distant objects appear. Illustration showing Hypermetropia or farsightedness where distant objects appear clear but nearby objects are blurred, explained with human eye structure and lens diagram
Free with trial PNP and NPN transistors, showing internal charge flow and schematic symbols used in basic electronic circuits diagram hand drawn schematic vector. Science educational illustration. Explained vectors PNP NPN Transistors Explained Circuit Diagrams. PNP and NPN transistors, showing internal charge flow and schematic symbols used in basic electronic circuits. PNP and NPN transistors, showing internal charge flow and schematic symbols used in basic electronic circuits diagram hand drawn schematic vector. Science educational illustration
Free with trial Soap molecules break down lipid membranes of viruses and trap them in micelles for removal diagram hand drawn schematic vector. Science educational illustration. Explained vectors How Soap Destroys Germs and Viruses Explained. Soap molecules break down lipid membranes of viruses and trap them in micelles for removal diagram hand drawn. soap molecules break down lipid membranes of viruses and trap them in micelles for removal diagram hand drawn schematic vector. Science educational illustration
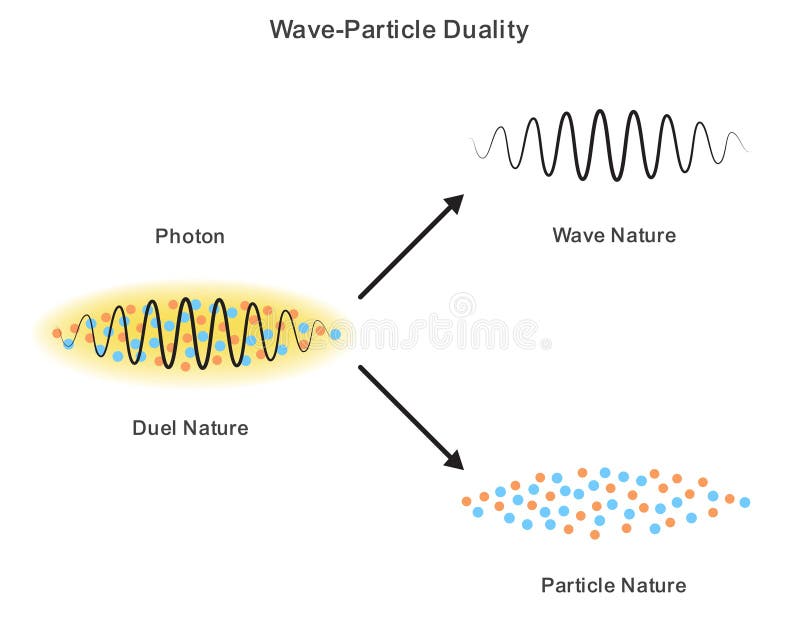
Free with trial Educational vector image explaining photon wave and particle dual nature in electromagnetic radiation ideal for light energy and quantum physics topics. Explained vectors Wave and Particle Dual Nature of Electromagnetic Radiation Explained with Photon Concept. Educational vector image explaining photon wave and particle dual. Educational vector image explaining photon wave and particle dual nature in electromagnetic radiation ideal for light energy and quantum physics topics
Free with trial Equivalent Fractions Diagram with Circles for Educational Use. Vector. Explained vectors Equivalent Fractions Diagram with Circles for Educational Use. Vector
Free with trial This image showcases various icons and interface elements typical of a smartphone app, focusing on content management and multimedia controls. It includes search bars, call-to-action buttons, and symbols for play, volume, sharing, and settings. Ideal for understanding UI/UX design principles in mobile applications. Explained vectors Smartphone Interface Icons and User Experience Elements Explained. This image showcases various icons and interface elements typical of a smartphone app. This image showcases various icons and interface elements typical of a smartphone app, focusing on content management and multimedia controls. It includes search bars, call-to-action buttons, and symbols for play, volume, sharing, and settings. Ideal for understanding UI/UX design principles in mobile applications
Free with trial A vector illustration showing how lightning occurs between charged clouds, a tall building, and treesâ€'perfect for explaining thunderstorm, electricity, and weather science concepts. Explained vectors Lightning Formation Explained Between Clouds, Tall Building, and Trees, Educational Vector. A vector illustration showing how lightning occurs between charged. A vector illustration showing how lightning occurs between charged clouds, a tall building, and treesâ€'perfect for explaining thunderstorm, electricity, and weather science concepts
Free with trial Fractions Mathematical Illustration Diagram from one to 1 10 with Circles and Pies Charts. Vector. Explained vectors Fractions Mathematical Illustration Diagram from one to 1 10 with Circles and Pies Charts. Vector
Free with trial Ceiling detector transmitting waves for monitoring. Simple geometric forms and solid fills define the flat artwork, isolated on white. The mounted detector and radiating waves communicate sensing activity within an indoor space. Suitable for building monitoring dashboards, security system diagrams and installation documentation where sensor placement, room coverage or the detection of nearby activity needs to be explained. Explained vectors Monitoring: Ceiling detector transmitting waves. Ceiling detector transmitting waves for monitoring. Simple geometric forms and solid fills define the flat. Ceiling detector transmitting waves for monitoring. Simple geometric forms and solid fills define the flat artwork, isolated on white. The mounted detector and radiating waves communicate sensing activity within an indoor space. Suitable for building monitoring dashboards, security system diagrams and installation documentation where sensor placement, room coverage or the detection of nearby activity needs to be explained.
Free with trial Ceiling device transmitting waves for room sensing. This flat design uses solid shapes and clear contrast on a white background. The mounted detector and radiating waves communicate sensing activity within an indoor space. Suitable for building monitoring dashboards, security system diagrams and installation documentation where sensor placement, room coverage or the detection of nearby activity needs to be explained. Explained vectors Room sensing: Ceiling device transmitting waves. Ceiling device transmitting waves for room sensing. This flat design uses solid shapes and clear contrast on a. Ceiling device transmitting waves for room sensing. This flat design uses solid shapes and clear contrast on a white background. The mounted detector and radiating waves communicate sensing activity within an indoor space. Suitable for building monitoring dashboards, security system diagrams and installation documentation where sensor placement, room coverage or the detection of nearby activity needs to be explained.
Free with trial Renewable energy focus. Renewable energy explained using digital presentations and supporting documents. Renewable energy for sustainable projects and clean technology. Great for education, business. Explained vectors Renewable Energy Documentation and Digital Presentation Concept. Renewable energy focus. Renewable energy explained using digital presentations and supporting. Renewable energy focus. Renewable energy explained using digital presentations and supporting documents. Renewable energy for sustainable projects and clean technology. Great for education, business
Free with trial Wall mounted detector transmitting wireless waves. A flat style and uncluttered shapes keep the subject distinct on a white background. The mounted detector and radiating waves communicate sensing activity within an indoor space. Suitable for building monitoring dashboards, security system diagrams and installation documentation where sensor placement, room coverage or the detection of nearby activity needs to be explained. Explained vectors Wall mounted detector transmitting wireless waves. A flat style and uncluttered shapes keep the subject distinct on a white background. The mounted detector
Free with trial Technology, teamwork, cloud solutions, business innovation, workflow processes, future technology. Large gear, handshake cloud icon. Technology and teamwork explained through a gear and handshake. Explained vectors Gear Mechanism, Business Collaboration, Cloud Computing Concept. Technology, teamwork, cloud solutions, business innovation, workflow processes, future. Technology, teamwork, cloud solutions, business innovation, workflow processes, future technology. Large gear, handshake cloud icon. Technology and teamwork explained through a gear and handshake
Free with trial Professional medical vector illustration showing the stages of aortic dissection with detailed anatomical structure, educational labelling, and clean infographic design suitable for healthcare, cardiology, and medical presentation use. Explained vectors Earth\'s Seasons Orbital Path Solstices and Equinoxes Explained. Professional medical vector illustration showing the stages of aortic dissection with detailed. Professional medical vector illustration showing the stages of aortic dissection with detailed anatomical structure, educational labelling, and clean infographic design suitable for healthcare, cardiology, and medical presentation use.
Free with trial 3D printing, innovation, technology, manufacturing, creative process, design. Cartoon characters interacting with technology. 3D printing and innovation concepts showcased with character actions. Explained vectors 3D Printing Process Explained with Cartoon Characters and Technology. 3D printing, innovation, technology, manufacturing, creative process, design. Cartoon. 3D printing, innovation, technology, manufacturing, creative process, design. Cartoon characters interacting with technology. 3D printing and innovation concepts showcased with character actions
Free with trial Archimedes principle, buoyant force formula, water displacement, and examples of positive, neutral, and negative buoyancy diagram hand drawn schematic vector. Science educational illustration. Explained vectors Archimedes Principle and Buoyancy Explained. Archimedes principle, buoyant force formula, water displacement, and examples of positive, neutral, and negative. Archimedes principle, buoyant force formula, water displacement, and examples of positive, neutral, and negative buoyancy diagram hand drawn schematic vector. Science educational illustration
Free with trial The human kidney filters blood removes waste balances fluids produces urine and regulates blood pressure located below ribs. Explained vectors Human Kidney Structure Function and Diseases Explained. The human kidney filters blood removes waste balances fluids produces urine and regulates blood pressure. The human kidney filters blood removes waste balances fluids produces urine and regulates blood pressure located below ribs
Free with trial Business presentation concept. Business explained with charts emphasizing achievement, professional analysis, and success strategies. Great for corporate reports, marketing, and education. Explained vectors Business Presentation with Charts, Data Analysis, and Achievement Concept. Business presentation concept. Business explained with charts emphasizing achievement. Business presentation concept. Business explained with charts emphasizing achievement, professional analysis, and success strategies. Great for corporate reports, marketing, and education
Free with trial Calendar with gear for schedule settings. Suitable for planning tools and operational reports where time, resources, costs or scheduled tasks need to be explained through a compact graphic. Clean line art uses open contours on a white background. The single icon is available as a JPEG image and an EPS vector. Explained vectors Calendar with gear for schedule settings, outline vector icon. Calendar with gear for schedule settings. Suitable for planning tools and operational reports. Calendar with gear for schedule settings. Suitable for planning tools and operational reports where time, resources, costs or scheduled tasks need to be explained through a compact graphic. Clean line art uses open contours on a white background. The single icon is available as a JPEG image and an EPS vector.
Free with trial Technology, renewable energy, innovation, cloud computing, data transfer, agriculture. Cloud with digital nodes connected. Cloud computing and renewable energy explained visually. Explained vectors Cloud Technology and Sustainable Energy Concept with Farm and Digital Elements. Technology, renewable energy, innovation, cloud computing, data transfer. Technology, renewable energy, innovation, cloud computing, data transfer, agriculture. Cloud with digital nodes connected. Cloud computing and renewable energy explained visually
Free with trial Logistics, automation, supply chain, cloud technology, delivery services, operational efficiency. A gear, truck and cloud. Logistics and automation concepts explained through transport. Explained vectors Gear and Truck with Cloud Symbol Logistics, Automation, and Supply Chain Concepts. Logistics, automation, supply chain, cloud technology, delivery services. Logistics, automation, supply chain, cloud technology, delivery services, operational efficiency. A gear, truck and cloud. Logistics and automation concepts explained through transport
Free with trial Clock button with pen for editing schedule. Suitable for planning tools and operational reports where time, resources, costs or scheduled tasks need to be explained through a compact graphic. Clean line art uses open contours on a white background. The single icon is available as a JPEG image and an EPS vector. Explained vectors Clock button with pen for editing schedule, outline vector icon. Clock button with pen for editing schedule. Suitable for planning tools and operational reports. Clock button with pen for editing schedule. Suitable for planning tools and operational reports where time, resources, costs or scheduled tasks need to be explained through a compact graphic. Clean line art uses open contours on a white background. The single icon is available as a JPEG image and an EPS vector.
Free with trial Business growth concept. Business icons thumbs up gears and financial coin economic development. Business strategies explained by an analyst on a computer screen. For finance, strategies, growth. Explained vectors Business Growth Concept with Gear Icons, Financial Coin, and Analyst Presentation. Business growth concept. Business icons thumbs up gears and financial coin. Business growth concept. Business icons thumbs up gears and financial coin economic development. Business strategies explained by an analyst on a computer screen. For finance, strategies, growth
Free with trial Diverse Fractions Mathematical Illustration Diagram with Circles and Pie Chart Examples. Vector. Explained vectors Diverse Fractions Mathematical Illustration Diagram with Circles and Pie Chart Examples. Vector
Free with trial Convexity explained with one test applied to two graphs. On the left, a bowl-shaped curve with a chord joining two points: the chord stays above the curve, and a dashed midpoint line shows the gap. On the right, a wavy curve fails the same check, with its chord dipping under the hump. Clean flat line-art for calculus, optimization and real analysis lessons, slides and explainer content. Explained vectors Convexity Visual – chord test on a convex curve and a non-convex wavy curve. Convexity explained with one test applied to two graphs. On the left, a bowl. Convexity explained with one test applied to two graphs. On the left, a bowl-shaped curve with a chord joining two points: the chord stays above the curve, and a dashed midpoint line shows the gap. On the right, a wavy curve fails the same check, with its chord dipping under the hump. Clean flat line-art for calculus, optimization and real analysis lessons, slides and explainer content.
Free with trial Calendar with clock for scheduled appointment. Suitable for planning tools and operational reports where time, resources, costs or scheduled tasks need to be explained through a compact graphic. Clean line art uses open contours on a white background. The single icon is available as a JPEG image and an EPS vector. Explained vectors Calendar with clock for scheduled appointment, outline vector icon. Calendar with clock for scheduled appointment. Suitable for planning tools and operational. Calendar with clock for scheduled appointment. Suitable for planning tools and operational reports where time, resources, costs or scheduled tasks need to be explained through a compact graphic. Clean line art uses open contours on a white background. The single icon is available as a JPEG image and an EPS vector.
Free with trial Calendar with dollar coin for payment schedule. Suitable for planning tools and operational reports where time, resources, costs or scheduled tasks need to be explained through a compact graphic. Clean line art uses open contours on a white background. The single icon is available as a JPEG image and an EPS vector. Explained vectors Calendar with dollar coin for payment schedule, outline vector icon. Calendar with dollar coin for payment schedule. Suitable for planning tools and operational. Calendar with dollar coin for payment schedule. Suitable for planning tools and operational reports where time, resources, costs or scheduled tasks need to be explained through a compact graphic. Clean line art uses open contours on a white background. The single icon is available as a JPEG image and an EPS vector.
Free with trial Person beside calendar for appointment planning. Suitable for planning tools and operational reports where time, resources, costs or scheduled tasks need to be explained through a compact graphic. Clean line art uses open contours on a white background. The single icon is available as a JPEG image and an EPS vector. Explained vectors Person beside calendar for appointment planning, outline vector icon. Person beside calendar for appointment planning. Suitable for planning tools and. Person beside calendar for appointment planning. Suitable for planning tools and operational reports where time, resources, costs or scheduled tasks need to be explained through a compact graphic. Clean line art uses open contours on a white background. The single icon is available as a JPEG image and an EPS vector.
Free with trial Upward arrows with clock for progress over time. Suitable for planning tools and operational reports where time, resources, costs or scheduled tasks need to be explained through a compact graphic. Clean line art uses open contours on a white background. The single icon is available as a JPEG image and an EPS vector. Explained vectors Upward arrows with clock for progress over time, outline vector icon. Upward arrows with clock for progress over time. Suitable for planning tools and. Upward arrows with clock for progress over time. Suitable for planning tools and operational reports where time, resources, costs or scheduled tasks need to be explained through a compact graphic. Clean line art uses open contours on a white background. The single icon is available as a JPEG image and an EPS vector.
Free with trial Upward arrows with gear for process improvement. Suitable for planning tools and operational reports where time, resources, costs or scheduled tasks need to be explained through a compact graphic. Clean line art uses open contours on a white background. The single icon is available as a JPEG image and an EPS vector. Explained vectors Upward arrows with gear for process improvement, outline vector icon. Upward arrows with gear for process improvement. Suitable for planning tools and. Upward arrows with gear for process improvement. Suitable for planning tools and operational reports where time, resources, costs or scheduled tasks need to be explained through a compact graphic. Clean line art uses open contours on a white background. The single icon is available as a JPEG image and an EPS vector.
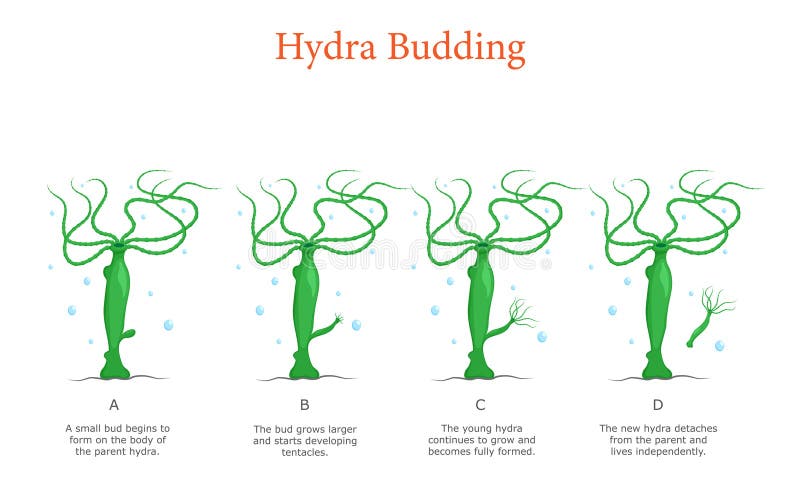
Free with trial Clear infographic style illustration of hydra budding process in four steps useful for biology study and teaching material. Explained vectors Hydra Budding Explained in Four Steps with Clear Educational Illustration for Students. Clear infographic style illustration of hydra budding process in four. Clear infographic style illustration of hydra budding process in four steps useful for biology study and teaching material
Free with trial Financial planning, savings, budgeting, time management, science, education. A dollar symbol with a sun, calendar with clock atomic structure. Financial planning and science explained visually. Explained vectors Financial Savings, Budgeting, and Scientific Concept Elements in a Minimalist Design. Financial planning, savings, budgeting, time management, science, education. Financial planning, savings, budgeting, time management, science, education. A dollar symbol with a sun, calendar with clock atomic structure. Financial planning and science explained visually
Free with trial Fractions Mathematical Illustration Diagram Showing from 1 1 to 1 15 Using Circles and Pie Charts. Vector. Explained vectors Fractions Mathematical Illustration Diagram Showing from 1 1 to 1 15 Using Circles and Pie Charts. Vector
Free with trial Table grid with dollar coin for budget spreadsheet. Suitable for planning tools and operational reports where time, resources, costs or scheduled tasks need to be explained through a compact graphic. Clean line art uses open contours on a white background. The single icon is available as a JPEG image and an EPS vector. Explained vectors Table grid with dollar coin for budget spreadsheet, outline vector icon. Table grid with dollar coin for budget spreadsheet. Suitable for planning tools and. Table grid with dollar coin for budget spreadsheet. Suitable for planning tools and operational reports where time, resources, costs or scheduled tasks need to be explained through a compact graphic. Clean line art uses open contours on a white background. The single icon is available as a JPEG image and an EPS vector.
Free with trial Calendar with exclamation mark for deadline warning. Suitable for planning tools and operational reports where time, resources, costs or scheduled tasks need to be explained through a compact graphic. Clean line art uses open contours on a white background. The single icon is available as a JPEG image and an EPS vector. Explained vectors Calendar with exclamation mark for deadline warning, outline vector icon. Calendar with exclamation mark for deadline warning. Suitable for planning tools and. Calendar with exclamation mark for deadline warning. Suitable for planning tools and operational reports where time, resources, costs or scheduled tasks need to be explained through a compact graphic. Clean line art uses open contours on a white background. The single icon is available as a JPEG image and an EPS vector.
Free with trial Search bar interface displaying autocomplete suggestions related to search engine optimization (SEO). The list includes "Search engine optimization (SEO)", "Search results page", "Search algorithms explained", "Search techniques for web", "Search terms analysis", and "Search bar design examples". The layout is minimal, with a focus on user input and intuitive navigation. Explained vectors Search Query Suggestions Search Engine Optimization With Search Bar. Search bar interface displaying autocomplete suggestions related to search engine. Search bar interface displaying autocomplete suggestions related to search engine optimization (SEO). The list includes "Search engine optimization (SEO)", "Search results page", "Search algorithms explained", "Search techniques for web", "Search terms analysis", and "Search bar design examples". The layout is minimal, with a focus on user input and intuitive navigation.
Free with trial Globe and clock with exchange arrows for worldwide timing. Suitable for planning tools and operational reports where time, resources, costs or scheduled tasks need to be explained through a compact graphic. Clean line art uses open contours on a white background. The single icon is available as a JPEG image and an EPS vector. Explained vectors Globe and clock with exchange arrows for worldwide timing, outline vector icon. Globe and clock with exchange arrows for worldwide timing. Suitable for planning. Globe and clock with exchange arrows for worldwide timing. Suitable for planning tools and operational reports where time, resources, costs or scheduled tasks need to be explained through a compact graphic. Clean line art uses open contours on a white background. The single icon is available as a JPEG image and an EPS vector.
Free with trial As explained in this section, the oldest kite in the world is the Kaghati Kolope, which has existed for 4,000 years, precisely in Muna Regency, Southeast Sulawesi. Explained vectors Kites, or commonly known as kites or wau, are a traditional toy originating from Indonesia. As explained in this section, the oldest kite in the world is the. As explained in this section, the oldest kite in the world is the Kaghati Kolope, which has existed for 4,000 years, precisely in Muna Regency, Southeast Sulawesi.
Free with trial Stacked Bitcoin coins, educator holding paper and pointer, castle representing institutions. Ideal for cryptocurrency, education, finance, technology, investment, decentralization traditional. Explained vectors Cryptocurrency Finance Explained Through Education with Bitcoin and Traditional Economy Concepts. Stacked Bitcoin coins, educator holding paper and pointer. Stacked Bitcoin coins, educator holding paper and pointer, castle representing institutions. Ideal for cryptocurrency, education, finance, technology, investment, decentralization traditional
Free with trial A visual representation of daily activity goals, including steps, workout minutes, and standing hours, presented in a concentric ring chart format. Explained vectors Daily Activity Goals Ring Chart Explained. A visual representation of daily activity goals, including steps, workout minutes, and standing hours, presented in a. A visual representation of daily activity goals, including steps, workout minutes, and standing hours, presented in a concentric ring chart format
Free with trial Finance, cryptocurrency, blockchain, technology, digital investment, payment systems. Circular design highlighting decentralized finance with connected icons. Finance and cryptocurrency explained. Explained vectors Decentralized Finance Concept with Icons Smart Payment, Investment, Automation, and User Interaction. Finance, cryptocurrency, blockchain, technology, digital. Finance, cryptocurrency, blockchain, technology, digital investment, payment systems. Circular design highlighting decentralized finance with connected icons. Finance and cryptocurrency explained
Free with trial This July girl has three sides: the quiet and sweet side, the fun and crazy side, and the side you never want to see. A perfect birthday gift. Explained vectors Vector art of july girl personality traits explained. This July girl has three sides: the quiet and sweet side, the fun and crazy side, and the side you never. This July girl has three sides: the quiet and sweet side, the fun and crazy side, and the side you never want to see. A perfect birthday gift
Free with trial Gear above money time and question symbols for resource planning. Suitable for planning tools and operational reports where time, resources, costs or scheduled tasks need to be explained through a compact graphic. Clean line art uses open contours on a white background. The single icon is available as a JPEG image and an EPS vector. Explained vectors Gear above money time and question symbols for resource planning, outline vector icon. Gear above money time and question symbols for resource planning. Suitable. Gear above money time and question symbols for resource planning. Suitable for planning tools and operational reports where time, resources, costs or scheduled tasks need to be explained through a compact graphic. Clean line art uses open contours on a white background. The single icon is available as a JPEG image and an EPS vector.
Free with trial A clean, minimalist illustration showcasing four distinct network topology icons: Star, Mesh, Ring, and Bus. Each topology is represented by a simple, modern graphic with teal and dark blue accents on a white background. These icons are ideal for educational materials, presentations, and technical documentation related to computer networks, data transmission, and IT infrastructure. Explained vectors Network Topology Icons: Star, Mesh, Ring, and Bus. A clean, minimalist illustration showcasing four distinct network topology icons: Star, Mesh, Ring, and Bus. A clean, minimalist illustration showcasing four distinct network topology icons: Star, Mesh, Ring, and Bus. Each topology is represented by a simple, modern graphic with teal and dark blue accents on a white background. These icons are ideal for educational materials, presentations, and technical documentation related to computer networks, data transmission, and IT infrastructure.
Free with trial Finance, digital technology, blockchain, cryptocurrency, security systems, innovation. Central defi text surrounded by relevant icons and symbols. Finance and digital technology explained visually. Explained vectors Decentralized Finance Defi Concept with Icons for Home, Shopping, Gear, Heart, Firewall, and Blue Flame. Finance, digital technology, blockchain, cryptocurrency. Finance, digital technology, blockchain, cryptocurrency, security systems, innovation. Central defi text surrounded by relevant icons and symbols. Finance and digital technology explained visually
Free with trial Vector illustration showing a person explaining board game rules, players distributing cards, and discussing scores. Represents interactive and collaborative gameplay sessions. Explained vectors Board Game Strategy Explained with. Vector illustration showing a person explaining board game rules, players distributing cards, and discussing scores. Vector illustration showing a person explaining board game rules, players distributing cards, and discussing scores. Represents interactive and collaborative gameplay sessions.
Free with trial This September girl has three sides: the quiet and sweet side, the fun and crazy side, and the side you never want to see. A perfect birthday gift. Explained vectors Vector art of september girl personality traits explained. This September girl has three sides: the quiet and sweet side, the fun and crazy side, and the side. This September girl has three sides: the quiet and sweet side, the fun and crazy side, and the side you never want to see. A perfect birthday gift
Free with trial Easy Product Return Policy Explained with Icons. Visual guide to an easy product return policy - Get product, product to return, and quick refund. Explained vectors Easy Product Return Policy Explained with Icons. Visual guide to an easy product return policy - Get product, product to return, and quick refund
Free with trial Educational infographic explaining scientific notation using the standard form a × 10ⁿ. The diagram illustrates the coefficient, base, exponent, positive and negative exponents, and decimal place movement when converting large and small numbers into scientific notation. Suitable for mathematics education, classroom learning, worksheets, presentations, teaching materials, and study resources. Explained vectors Scientific Notation Explained with Coefficient Base and Exponent Educational Infographic. Educational infographic explaining scientific notation using the. Educational infographic explaining scientific notation using the standard form a × 10ⁿ. The diagram illustrates the coefficient, base, exponent, positive and negative exponents, and decimal place movement when converting large and small numbers into scientific notation. Suitable for mathematics education, classroom learning, worksheets, presentations, teaching materials, and study resources.
Free with trial Sun representing energy, solar panel for renewable energy, instructor with document and pointer. Ideal for sustainability, renewable energy, education, technology, clean energy, eco-awareness solar. Explained vectors Solar Power Explained Through Education and Clean Energy Technology. Sun representing energy, solar panel for renewable energy, instructor with document and. Sun representing energy, solar panel for renewable energy, instructor with document and pointer. Ideal for sustainability, renewable energy, education, technology, clean energy, eco-awareness solar
Free with trial Interactive vector illustration showing a woman pointing to a digital tablet displaying weather AI data and symbols. Set in a lush garden, it demonstrates AI's role in modern agriculture. Explained vectors Weather AI Forecasting Explained with. Interactive vector illustration showing a woman pointing to a digital tablet displaying weather AI data and symbols. Set. Interactive vector illustration showing a woman pointing to a digital tablet displaying weather AI data and symbols. Set in a lush garden, it demonstrates AI's role in modern agriculture.
Free with trial Illustration showing a person interacting with a smart speaker voice assistant, detailing its various functions like playing music, weather reports, setting reminders, and controlling smart home devices. Explained vectors Smart Speaker Voice Assistant Interaction Explained. Illustration showing a person interacting with a smart speaker voice assistant, detailing its various. Illustration showing a person interacting with a smart speaker voice assistant, detailing its various functions like playing music, weather reports, setting reminders, and controlling smart home devices
Free with trial Smart homes, IoT systems, energy monitoring, automation, remote control, cost savings. Line art of a house with connected devices and energy-saving icons. Smart homes and IoT systems explained. Explained vectors Smart Home System with Energy Efficiency, IoT Connectivity, and Automated Devices in a Modern Connected House. Smart homes, IoT systems, energy monitoring. Smart homes, IoT systems, energy monitoring, automation, remote control, cost savings. Line art of a house with connected devices and energy-saving icons. Smart homes and IoT systems explained
Free with trial This infographic visually explains the concepts of Trigger Point Therapy, inflammation, and Myofascial Pain Syndrome. It uses isometric illustrations to depict targeted treatment, the inflammatory process, and the effects of pain syndrome on muscles. The clean, modern design makes it ideal for educational materials, medical presentations, or health and wellness content. Explained vectors Trigger Point Therapy and Myofascial Pain Syndrome Explained. This infographic visually explains the concepts of Trigger Point Therapy, inflammation, and. This infographic visually explains the concepts of Trigger Point Therapy, inflammation, and Myofascial Pain Syndrome. It uses isometric illustrations to depict targeted treatment, the inflammatory process, and the effects of pain syndrome on muscles. The clean, modern design makes it ideal for educational materials, medical presentations, or health and wellness content.
Free with trial Illustration of the adrenal glands atop a kidney, highlighting a pheochromocytoma. The adrenal gland is divided into cortex and medulla. A callout section shows tumor location in the adrenal medulla, explained as arising from chromaffin cells. Labels identify the kidney, adrenal gland, adrenal cortex, and medulla. The illustration is educational, explaining the tumor's origin and anatomical positioning relative to the kidney. Explained vectors Pheochromocytoma Kidney Illustration. Illustration of the adrenal glands atop a kidney, highlighting a pheochromocytoma. The adrenal gland is divided into cortex. Illustration of the adrenal glands atop a kidney, highlighting a pheochromocytoma. The adrenal gland is divided into cortex and medulla. A callout section shows tumor location in the adrenal medulla, explained as arising from chromaffin cells. Labels identify the kidney, adrenal gland, adrenal cortex, and medulla. The illustration is educational, explaining the tumor's origin and anatomical positioning relative to the kidney.
Free with trial Traveling salesman problem explained as a choice between closed tours. Four small maps share exactly the same five cities, and each map connects them with a different loop that visits every stop once and returns home. Three loops are drawn thin: one doubles back across itself three times, one crosses once, and one reaches the inner city from the wrong side. The fourth, drawn bold, is the shortest round trip – verified against all 12 possible orderings, so the choice is mathematically exact rather than decorative. The visual captures the core idea of this classic NP-hard optimization question: the stops never change, only the order of travel does, and the number of candidate orderings explodes as cities are added. Clean single-colour outline style with hollow nodes and no text or labels, suited to slides, lecture notes, textbooks, e-learning modules and explainer videos covering combinatorial optimization, operations research, graph theory, route planning and algorithm design. Part of a 100-concept mathematics set. Explained vectors Traveling Salesman Problem Visual – four closed tours through the same cities, shortest drawn bold. Traveling salesman problem explained as a choice between. Traveling salesman problem explained as a choice between closed tours. Four small maps share exactly the same five cities, and each map connects them with a different loop that visits every stop once and returns home. Three loops are drawn thin: one doubles back across itself three times, one crosses once, and one reaches the inner city from the wrong side. The fourth, drawn bold, is the shortest round trip – verified against all 12 possible orderings, so the choice is mathematically exact rather than decorative. The visual captures the core idea of this classic NP-hard optimization question: the stops never change, only the order of travel does, and the number of candidate orderings explodes as cities are added. Clean single-colour outline style with hollow nodes and no text or labels, suited to slides, lecture notes, textbooks, e-learning modules and explainer videos covering combinatorial optimization, operations research, graph theory, route planning and algorithm design. Part of a 100-concept mathematics set.
Free with trial Mathematical illustration explaining Tau Day with circle formulas and definitions It showcases the relationship between tau pi radius diameter circumference and area including Eulers identity. Explained vectors Mathematical Concepts of Tau Day Explained with Circle Formulas. Mathematical illustration explaining Tau Day with circle formulas and definitions It showcases. Mathematical illustration explaining Tau Day with circle formulas and definitions It showcases the relationship between tau pi radius diameter circumference and area including Eulers identity
Free with trial Illustration showing the process of vision restoration implants. Depicts cells with light-sensitive proteins introduced into retinal cells. Highlights the concept of optogenetic therapy. Explained vectors Vision restoration implants explained. Illustration showing the process of vision restoration implants. Depicts cells with light-sensitive proteins introduced. Illustration showing the process of vision restoration implants. Depicts cells with light-sensitive proteins introduced into retinal cells. Highlights the concept of optogenetic therapy
Free with trial Cloud movement concept. Cloud movement explained using wind direction, flow, and outline display. Cloud movement highlights weather dynamics and atmospheric conditions. For meteorology, education. Explained vectors Cloud Movement Concept Wind Direction and Flow Outline in Simple Graphic ation. Cloud movement concept. Cloud movement explained using wind direction, flow, and. Cloud movement concept. Cloud movement explained using wind direction, flow, and outline display. Cloud movement highlights weather dynamics and atmospheric conditions. For meteorology, education
Free with trial This graphic illustrates various plumbing problems with sinks, highlighting leaks, pooling water, and clogged drains. Each scenario shows the affected areas and consequences clearly. Explained vectors Common sink plumbing issues explained visually. This graphic illustrates various plumbing problems with sinks, highlighting leaks, pooling water, and clogged. This graphic illustrates various plumbing problems with sinks, highlighting leaks, pooling water, and clogged drains. Each scenario shows the affected areas and consequences clearly.
Free with trial This illustration shows the human thyroid gland in the neck alongside a crisp, red apple, symbolizing health and balanced nutrition for endocrine support and overall wellness. Learn about this vital organ's connection to a healthy diet. Explained vectors Anatomy illustration of human thyroid gland with a healthy fresh apple. This illustration shows the human thyroid gland in the neck alongside a crisp, red apple. This illustration shows the human thyroid gland in the neck alongside a crisp, red apple, symbolizing health and balanced nutrition for endocrine support and overall wellness. Learn about this vital organ's connection to a healthy diet
Free with trial Visualize the power of vacuum technology with a robotic arm and pump. Perfect for explaining industrial processes, automation, and scientific principles. Explained vectors Robotic arm with suction cup lifts object, demonstrating vacuum principle. Visualize the power of vacuum technology with a robotic arm and pump. Perfect for. Visualize the power of vacuum technology with a robotic arm and pump. Perfect for explaining industrial processes, automation, and scientific principles
Free with trial Factory emitting smoke next to a person presenting data with a pointer and binary code speech bubble. Ideal for industry, data literacy, technology, engineering, analysis, innovation, simple flat. Explained vectors Factory analytics presentation with binary data and analysis concepts explained visually. Factory emitting smoke next to a person presenting data with a pointer. Factory emitting smoke next to a person presenting data with a pointer and binary code speech bubble. Ideal for industry, data literacy, technology, engineering, analysis, innovation, simple flat
Free with trial Cryptocurrency, bitcoin payments, e-commerce, virtual finance, digital wallet, blockchain. 360-degree graphic and bitcoin-themed elements. Cryptocurrency and bitcoin payments concept explained. Explained vectors Cryptocurrency and Virtual Transactions Concept 360-Degree Interaction and Bitcoin Sign. Cryptocurrency, bitcoin payments, e-commerce, virtual finance, digital. Cryptocurrency, bitcoin payments, e-commerce, virtual finance, digital wallet, blockchain. 360-degree graphic and bitcoin-themed elements. Cryptocurrency and bitcoin payments concept explained
Free with trial English bible verses " For where your Treasure is there your Heart will be also Mathew 6 :21 with the Treasure Bible Verses. Explained vectors English bible verses \' For where your Treasure is there your Heart will be also Mathew 6 :21. English bible verses ' For where your Treasure is there your Heart. English bible verses " For where your Treasure is there your Heart will be also Mathew 6 :21 with the Treasure Bible Verses
Free with trial Cloud storage, technology, data management, online collaboration, digital tools, web applications. A person gestures to a cloud and webpage. Cloud storage and technology explained visually. Explained vectors Person Pointing Towards Cloud Above Digital Interface Cloud Technology and Data Management. Cloud storage, technology, data management, online collaboration. Cloud storage, technology, data management, online collaboration, digital tools, web applications. A person gestures to a cloud and webpage. Cloud storage and technology explained visually
Free with trial A vibrant and cheerful 3D cartoon emoji with its tongue sticking out and rosy pink cheeks. The playful expression is captured in a friendly. Explained vectors Cheerful Tongue Out Emoji with Pink Cheeks – 3D Cartoon Style Isolated on White Background. A vibrant and cheerful 3D cartoon emoji with its tongue sticking. A vibrant and cheerful 3D cartoon emoji with its tongue sticking out and rosy pink cheeks. The playful expression is captured in a friendly
Free with trial An infographic visualizing the concept of semantic SEO, focusing on user intent, related topics, and AI-powered search engine understanding. Explained vectors Semantic SEO Explained: Brainstorming, Keywords, and AI Automation Integration. An infographic visualizing the concept of semantic SEO, focusing on user intent. An infographic visualizing the concept of semantic SEO, focusing on user intent, related topics, and AI-powered search engine understanding
Free with trial Educational football game instructions for kids. Demonstrates movement directions: left, right, forward, backward. Simple graphics and clear text for learning. Explained vectors Football directions explained with cartoon boy moving ball left right forward and backward simple educational guide. Educational football game instructions for. Educational football game instructions for kids. Demonstrates movement directions: left, right, forward, backward. Simple graphics and clear text for learning
Free with trial A detailed vector illustration of the human inner ear anatomy, showcasing the cochlea, semicircular canals, and auditory nerve. Essential for audiology, medical education, and biological studies, this graphic clearly explains the complex mechanism of hearing, vector design Generative AI. Explained vectors Inner Ear Anatomy Diagram - Hearing Mechanism Explained, vector design Generative AI. A detailed vector illustration of the human inner ear anatomy, showcasing. A detailed vector illustration of the human inner ear anatomy, showcasing the cochlea, semicircular canals, and auditory nerve. Essential for audiology, medical education, and biological studies, this graphic clearly explains the complex mechanism of hearing, vector design Generative AI
Free with trial A visual representation of the Earths water cycle, illustrating evaporation from water bodies, condensation forming clouds, and precipitation returning water to the land. Explained vectors The Water Cycle Explained Through Evaporation Condensation and Precipitation. A visual representation of the Earths water cycle, illustrating evaporation from. A visual representation of the Earths water cycle, illustrating evaporation from water bodies, condensation forming clouds, and precipitation returning water to the land
Free with trial A detailed illustration of the water cycle showing evaporation from water bodies, condensation forming clouds, precipitation as rain and snow, and collection in mountains and oceans. Explained vectors The Water Cycle Explained - Evaporation Condensation Precipitation and Collection. A detailed illustration of the water cycle showing evaporation from water. A detailed illustration of the water cycle showing evaporation from water bodies, condensation forming clouds, precipitation as rain and snow, and collection in mountains and oceans
 Sign in