Free with trial Word cloud - risk management. A word cloud of risk management related items. Probability vectors Word cloud - risk management. A word cloud of risk management related items
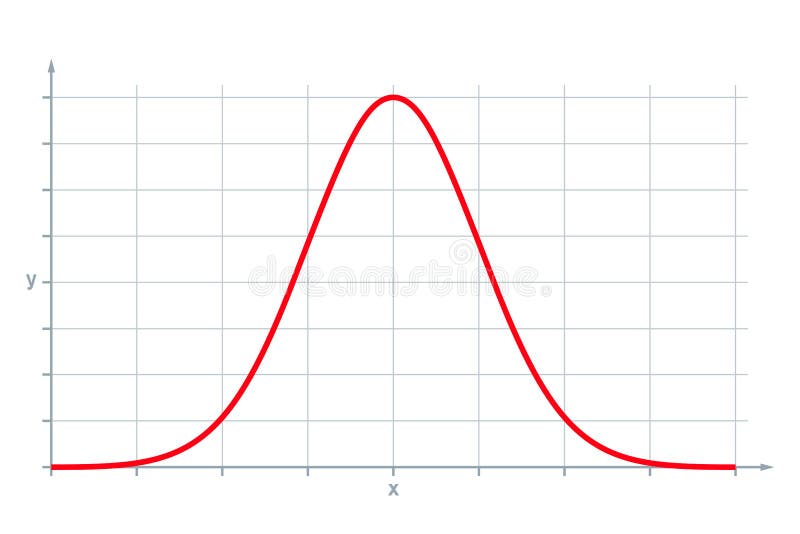
Free with trial Normal distribution, also Gaussian distribution or Bell curve. Very common in probability theory. The red curve shows the standard normal distribution. Illustration on white background. Probability vectors Gaussian normal distribution. Normal distribution, also Gaussian distribution or Bell curve. Very common in probability theory. The red curve shows the standard. Normal distribution, also Gaussian distribution or Bell curve. Very common in probability theory. The red curve shows the standard normal distribution. Illustration on white background.
Free with trial Casino slot machine. Abstract colorful illustration with casino slot machine and the word jackpot written on the lower side of the machine. Probability vectors Casino slot machine. Abstract colorful illustration with casino slot machine and the word jackpot written on the lower side of the machine
Free with trial Word cloud - risk management. A word cloud of risk management related items. Probability vectors Word cloud - risk management. A word cloud of risk management related items
Free with trial Autosomal Dominant Hereditary Trait infographic diagram including parents father and mother probability of son and daughter to be affected or unaffected by mutated gene for genetic science education. Probability vectors Autosomal Dominant Hereditary Trait. Infographic diagram including parents father and mother probability of son and daughter to be affected or unaffected by. Autosomal Dominant Hereditary Trait infographic diagram including parents father and mother probability of son and daughter to be affected or unaffected by mutated gene for genetic science education
Free with trial Codominance Example Blood Type infographic diagram including parents carrier father and mother probability of son and daughter to be have different combinations of dominant recessive genes. Probability vectors Codominance Example Blood Type. Infographic diagram including parents carrier father and mother probability of son and daughter to be have different. Codominance Example Blood Type infographic diagram including parents carrier father and mother probability of son and daughter to be have different combinations of dominant recessive genes
Free with trial Wooden backgammon board game with black and white checkers, isolated on white background. Eps file available. Probability vectors Backgammon Board Game. Wooden backgammon board game with black and white checkers, isolated on white background. Eps file available. Wooden backgammon board game with black and white checkers, isolated on white background. Eps file available.
Free with trial Slot machine. Colorful background with casino slot machine with colorful buttons and the word jackpot written on the upper side of the machine. Probability vectors Slot machine. Colorful background with casino slot machine with colorful buttons and the word jackpot written on the upper side of the machine
Free with trial Vector illustration of shiny red dices on the white background. Probability vectors Shiny red dices. Vector illustration of shiny red dices on the white background. Vector illustration of shiny red dices on the white background.
Free with trial Set of modern thin line icons for math. Vector illustration with different elements on the subject mathematics. Probability vectors Set of modern thin line icons for math. Vector illustration with different elements on the subject mathematics
Free with trial A vector image of several dice rolling. This vector is very good for design that need dice element. Probability vectors Dice Rolling with White Background. A vector image of several dice rolling. This vector is very good for design that need dice element. A vector image of several dice rolling. This vector is very good for design that need dice element.
Free with trial X-linked recessive inheritance means that the gene causing the trait or the disorder is located on the X chromosome. genetic disorders. vector diagram showing the potential outcomes. Probability vectors X-linked recessive inheritance. Means that the gene causing the trait or the disorder is located on the X chromosome. genetic disorders. vector diagram showing
Free with trial Venn diagram with 4 circles infographics template design. Vector overlapping shapes for set or logic graphic illustration. Probability vectors Venn diagram with 4 circles infographics template design. Vector. Overlapping shapes for set or logic graphic illustration
Free with trial Standard normal distribution, also Gaussian distribution or bell curve. Used in statistics and in natural and social sciences to represent real-valued random variables of unknown distributions. Vector. Probability vectors Standard normal distribution, also Gaussian distribution or bell curve. Used in statistics and in natural and social sciences to represent real-valued random
Free with trial Simple random sampling method in statistics. Research on sample collecting data in scientific survey techniques. Vector. Probability vectors Simple random sampling method in statistics. Research on sample collecting data in scientific survey techniques. Vector
Free with trial Business and Marketing Concepts, Illustration of Standard Deviation Diagram, Gaussian Bell or Normal Distribution Curve Population Pyramid Chart for Sample Size Determination. Probability vectors Standard Deviation Diagram with Sample Size Chart. Business and Marketing Concepts, Illustration of Standard Deviation Diagram, Gaussian Bell or Normal. Business and Marketing Concepts, Illustration of Standard Deviation Diagram, Gaussian Bell or Normal Distribution Curve Population Pyramid Chart for Sample Size Determination.
Free with trial Business and Marketing Concepts, Illustration of Gaussian Bell Diagram or Normal Distribution Curve on Green Chalkboard Background. Probability vectors Normal Distribution Curve Diagram on Chalkboard Background. Business and Marketing Concepts, Illustration of Gaussian Bell Diagram or Normal Distribution Curve. Business and Marketing Concepts, Illustration of Gaussian Bell Diagram or Normal Distribution Curve on Green Chalkboard Background.
Free with trial Business and Marketing Concepts, Illustration of Standard Deviation, Gaussian Bell or Normal Distribution Curve on Black Chalkboard Background. Probability vectors Normal Distribution Chart or Gaussian Bell Curve on Chalkboard. Business and Marketing Concepts, Illustration of Standard Deviation, Gaussian Bell or Normal. Business and Marketing Concepts, Illustration of Standard Deviation, Gaussian Bell or Normal Distribution Curve on Black Chalkboard Background.
Free with trial Convenience sample grab accidental sampling,or opportunity sampling statistic method non-probability technique. Vector. Probability vectors Convenience sample grab accidental sampling,or opportunity sampling statistic method non-probability technique. Vector
Free with trial Probability icon. Element of risk management collection for mobile concept and web apps icon. Outline, thin line probability icon for website design and mobile, app development. Probability vectors Probability icon vector from risk management collection. Thin line probability outline icon vector illustration. Outline, thin. Probability icon. Element of risk. probability icon. Element of risk management collection for mobile concept and web apps icon. Outline, thin line probability icon for website design and mobile, app development
Free with trial Standard normal distribution, with the percentages for three standard deviations of the mean. Sometimes informally called bell curve. Used in probability theory and in statistics. Illustration. Vector. Probability vectors Standard normal distribution, bell curve, with percentages. Standard normal distribution, with the percentages for three standard deviations of the mean. Standard normal distribution, with the percentages for three standard deviations of the mean. Sometimes informally called bell curve. Used in probability theory and in statistics. Illustration. Vector
Free with trial Gaussian distribution. Standard normal distribution, sometimes informally called a bell curve, used in probability theory and statistics. Standard deviation. Illustration on white background. Vector. Probability vectors Gaussian distribution, standard normal distribution, bell curve. Gaussian distribution. Standard normal distribution, sometimes informally called a bell curve. Gaussian distribution. Standard normal distribution, sometimes informally called a bell curve, used in probability theory and statistics. Standard deviation. Illustration on white background. Vector.
Free with trial Sex Linked Characters Infographic Diagram example hemophilia bleeding wound clot coagulation factor hemophilic male female punnett square genetic probability heredity gene science education vector. Probability vectors Sex Linked Characters Infographic Diagram example hemophilia bleeding. Wound clot coagulation factor hemophilic male female punnett square genetic probability. Sex Linked Characters Infographic Diagram example hemophilia bleeding wound clot coagulation factor hemophilic male female punnett square genetic probability heredity gene science education vector
Free with trial Set of math icons. Vector set of icons for different direction of math. Probability vectors Set of math icons. Vector set of icons for different direction of math
Free with trial Empty casino interior. Empty money casino interior. Probability vectors Empty casino interior. Empty money casino interior
Free with trial Blood Types baby. Chart. How mother and father blood types impact blood type of their children. Vector diagram showing the potential outcomes. illustration for educational, science and medical use. Probability vectors Blood Types baby. Chart. How mother and father blood types impact blood type of their children. Vector diagram showing the potential outcomes. illustration for
Free with trial An abstract illustration of a 10-sided die. Probability vectors 10-sided Die. An abstract illustration of a 10-sided die. An abstract illustration of a 10-sided die.
Free with trial Autosomal dominant or autosomal recessive for example A and B blood types in humans show co-dominance O type is recessive to A and B. genetic disorders. vector diagram showing the potential outcomes. illustration for educational, science and medical use. Probability vectors Autosomal dominant or autosomal recessive. For example A and B blood types in humans show co-dominance O type is recessive to A and B. genetic disorders. vector. Autosomal dominant or autosomal recessive for example A and B blood types in humans show co-dominance O type is recessive to A and B. genetic disorders. vector diagram showing the potential outcomes. illustration for educational, science and medical use
Free with trial Venn diagram with 4 circles infographics template design. Vector overlapping shapes for set or logic graphic illustration. Probability vectors Venn diagram with 4 circles infographics template design. Vector. Overlapping shapes for set or logic graphic illustration
Free with trial Business Insurance Concept Illustration. Business insurance concept with money and risk symbols flat vector illustration. Probability vectors Business Insurance Concept Illustration. Business insurance concept with money and risk symbols flat vector illustration
Free with trial Standard normal distribution, standard deviation and coverage in statistics. Empirical rule, 3-sigma or 68–95–99. 7 rule. Gaussian distribution or bell curve, used in statistics. Illustration. Vector. Probability vectors Standard normal distribution, standard deviation and coverage in statistics. Empirical rule, 3-sigma or 68–95–99.7 rule. Gaussian distribution or bell
Free with trial Caution electrical power. Yellow caution sign warning of power surge or electrocution - vector. Probability vectors Caution electrical power. Yellow caution sign warning of power surge or electrocution - vector
Free with trial Word cloud - risk assessment. A word cloud of risk assessment related items. Probability vectors Word cloud - risk assessment. A word cloud of risk assessment related items
Free with trial Modern color thin line concept of mathematics for school, university and training. Vector illustration with different elements on the subject mathematics. Logo Concepts for Trendy Designs. Probability vectors Modern color thin line concept of mathematics. Modern color thin line concept of mathematics for school, university and training. Vector illustration with. Modern color thin line concept of mathematics for school, university and training. Vector illustration with different elements on the subject mathematics. Logo Concepts for Trendy Designs.
Free with trial Modern color thin line concept of mathematics on a black background. Vector illustration with different elements on the subject mathematics. Logo Concepts for Trendy Designs. Probability vectors Modern color thin line concept of mathematics. Modern color thin line concept of mathematics on a black background. Vector illustration with different elements. Modern color thin line concept of mathematics on a black background. Vector illustration with different elements on the subject mathematics. Logo Concepts for Trendy Designs.
Free with trial Median vector illustration. Labeled middle number value separation method. Mathematical average calculation and measurement explanation scheme. Statistics technique diagram with moderate or mean line. Probability vectors Median vector illustration. Labeled middle number value separation method. Mathematical average calculation and measurement explanation scheme. Statistics
Free with trial Co-dominance as alleles heterozygote expression inheritance outline diagram. Labeled educational genetic example with white or red parent cows and roan offspring outcome potential vector illustration. Probability vectors Co-dominance as alleles heterozygote expression inheritance outline diagram. Labeled educational genetic example with white or red parent cows and roan
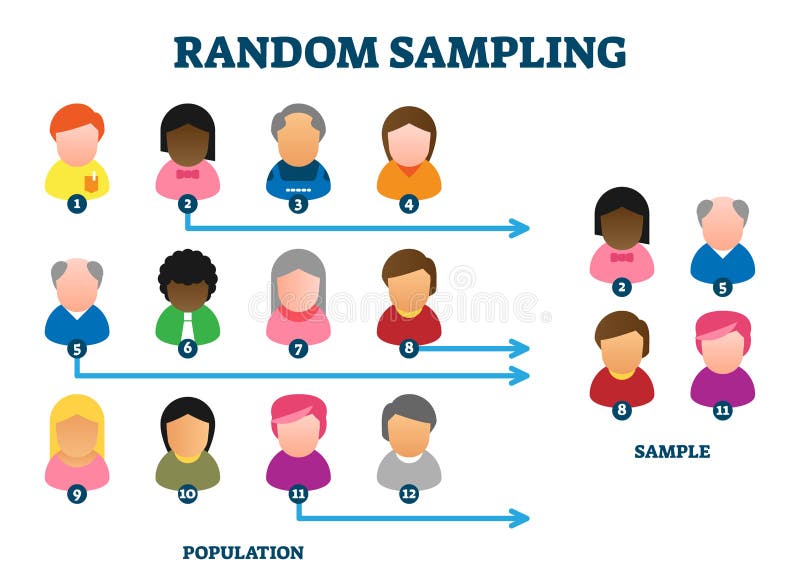
Free with trial Random sampling analysis method, vector illustration example diagram. Unbiased choosing people sample from the crowd. Population statistics and data research science. Various person types collection. Probability vectors Random sampling analysis method, vector illustration example diagram. Unbiased choosing people sample from the crowd. Population statistics and data research
Free with trial Stratified sampling method in statistics. Research on sample collecting data in scientific survey techniques. Vector. Probability vectors Stratified sampling method in statistics. Research on sample collecting data in scientific survey techniques. Vector
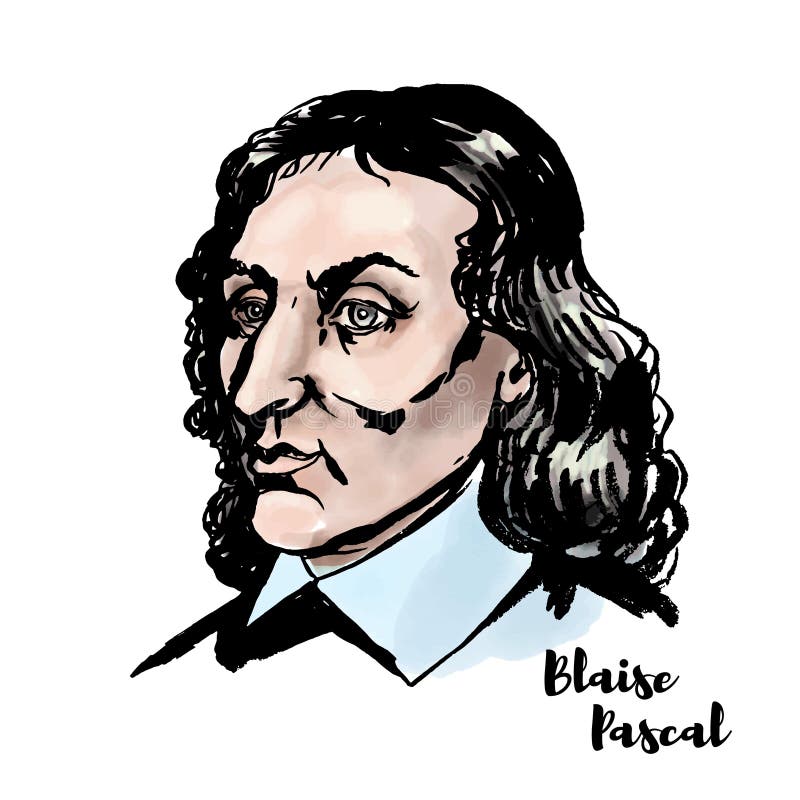
Free with trial Blaise Pascal watercolor vector portrait with ink contours. French mathematician, physicist, inventor, writer and Catholic theologian. Probability vectors Blaise Pascal Portrait. Blaise Pascal watercolor vector portrait with ink contours. French mathematician, physicist, inventor, writer and Catholic theologian. Blaise Pascal watercolor vector portrait with ink contours. French mathematician, physicist, inventor, writer and Catholic theologian.
Free with trial Cluster sampling method in statistics. Research on sample collecting data in scientific survey techniques. Vector. Probability vectors Cluster sampling method in statistics. Research on sample collecting data in scientific survey techniques. Vector
Free with trial Systematic sampling method in statistics. Research on sample collecting data in scientific survey techniques. Vector. Probability vectors Systematic sampling method in statistics. Research on sample collecting data in scientific survey techniques. Vector
Free with trial Double-slit experiment. Diffraction of light waves. Or particles. Theory of quantum mechanics. Young's experiment. Vector illustration. Probability vectors Double-slit experiment. Diffraction of light waves. Or particles. Theory of quantum mechanics. Young's experiment. Vector illustration
Free with trial A young woman having acne. Infection problem skin concept vector illustration. Probability vectors A young woman having acne. Infection problem skin concept vector illustration
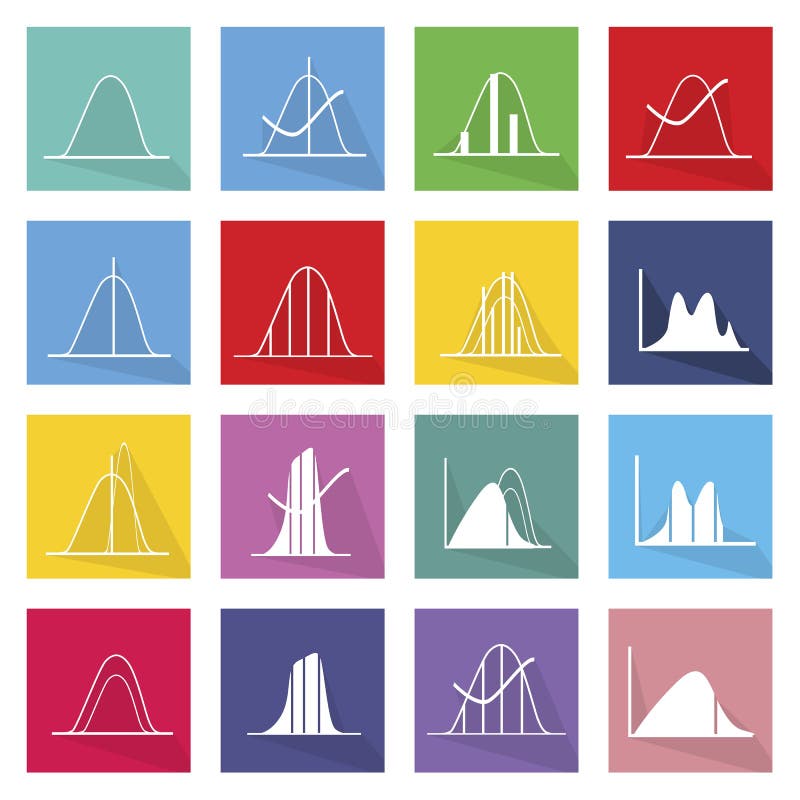
Free with trial Flat Icons, Illustration Set of 16 Gaussian, Bell or Normal Distribution Curve Icon Labels. Probability vectors Collection of 16 Normal Distribution Curve Icons. Flat Icons, Illustration Set of 16 Gaussian, Bell or Normal Distribution Curve Icon Labels. Flat Icons, Illustration Set of 16 Gaussian, Bell or Normal Distribution Curve Icon Labels.
Free with trial Mendels law of dominance. Vector illustration diagram of Mendel's Law of Dominance demonstrating with traits of peas and a punnett square. Probability vectors Mendels law of dominance. Vector illustration diagram of Mendel's Law of Dominance demonstrating with traits of peas and a punnett square
Free with trial Business and Marketing Concepts, Illustration of Standard Deviation Diagram, Gaussian Bell or Normal Distribution Curve Population Pyramid Chart for Sample Size Determination. Probability vectors Standard Deviation Diagram with Sample Size Chart. Business and Marketing Concepts, Illustration of Standard Deviation Diagram, Gaussian Bell or Normal. Business and Marketing Concepts, Illustration of Standard Deviation Diagram, Gaussian Bell or Normal Distribution Curve Population Pyramid Chart for Sample Size Determination.
Free with trial Business and Marketing Concepts, Illustration of Standard Deviation, Gaussian Bell or Normal Distribution Curve on Black Chalkboard Background. Probability vectors Normal Distribution Chart or Gaussian Bell Curve on Chalkboard. Business and Marketing Concepts, Illustration of Standard Deviation, Gaussian Bell or Normal. Business and Marketing Concepts, Illustration of Standard Deviation, Gaussian Bell or Normal Distribution Curve on Black Chalkboard Background.
Free with trial Business and Marketing Concepts, Illustration of Standard Deviation, Gaussian Bell or Normal Distribution Curve on A Chalkboard Background. Probability vectors Normal Distribution Chart or Gaussian Bell Curve on Chalkboard. Business and Marketing Concepts, Illustration of Standard Deviation, Gaussian Bell or Normal. Business and Marketing Concepts, Illustration of Standard Deviation, Gaussian Bell or Normal Distribution Curve on A Chalkboard Background.
Free with trial Business and Marketing Concepts, Illustration of Gaussian Bell or Normal Distribution Curve on Black Chalkboard Background. Probability vectors Normal Distribution Curve Chart on Chalkboard Background. Business and Marketing Concepts, Illustration of Gaussian Bell or Normal Distribution Curve on Black. Business and Marketing Concepts, Illustration of Gaussian Bell or Normal Distribution Curve on Black Chalkboard Background.
Free with trial Business and Marketing Concepts, Illustration of Gaussian Bell Curve or Normal Distribution Diagram on Brown Chalkboard Background. Probability vectors Normal Distribution Diagram or Bell Curve on Brown Chalkboard. Business and Marketing Concepts, Illustration of Gaussian Bell Curve or Normal Distribution. Business and Marketing Concepts, Illustration of Gaussian Bell Curve or Normal Distribution Diagram on Brown Chalkboard Background.
Free with trial Purposive sampling sample taken from a group of people statistic method non-probability technique. Vector. Probability vectors Purposive sampling sample taken from a group of people statistic method non-probability technique. Vector
Free with trial Voluntary response sampling sample taken from a group of people sampling statistic method non-probability technique. Vector. Probability vectors Voluntary response sampling sample taken from a group of people sampling statistic method non-probability technique. Vector
Free with trial Probability percentages as mathematical branch for analysis outline diagram. Labeled educational scheme with impossible, unlikely, likely and certain scenario likelihood odds vector illustration. Probability vectors Probability percentages as mathematical branch for analysis outline diagram. Labeled educational scheme with impossible, unlikely, likely and certain scenario
Free with trial Business and Marketing or Social Research Process, Classification of Sampling Methods The Probability and Non-Probability Sampling in Qualitative Research. Probability vectors The Probability Sampling and Non-Probability Sampling Method. Business and Marketing or Social Research Process, Classification of Sampling Methods The. Business and Marketing or Social Research Process, Classification of Sampling Methods The Probability and Non-Probability Sampling in Qualitative Research.
Free with trial Probability word cloud. Concept. Collage made of words about probability. Vector illustration. Probability vectors Probability word cloud. Concept. Collage made of words about probability. Vector illustration
Free with trial Probability. Statistics, probability, analysis icon vector image. Can also be used for Math Symbols. Suitable for use on web apps, mobile apps and print media. Probability vectors Probability. Statistics, probability, analysis icon vector image. Can also be used for Math Symbols. Suitable for use on web apps, mobile apps and print media
Free with trial Probability. Statistics, probability, analysis icon vector image. Can also be used for Math Symbols. Suitable for use on web apps, mobile apps and print media. Probability vectors Probability. Statistics, probability, analysis icon vector image. Can also be used for Math Symbols. Suitable for use on web apps, mobile apps and print media
Free with trial Probability. Statistics, probability, analysis icon vector image. Can also be used for Math Symbols. Suitable for use on web apps, mobile apps and print media. Probability vectors Probability. Statistics, probability, analysis icon vector image. Can also be used for Math Symbols. Suitable for use on web apps, mobile apps and print media
Free with trial Probability and statistics turquoise concept icon. Data analyst skill abstract idea thin line illustration. Isolated outline drawing. Editable stroke. Arial, Myriad Pro-Bold fonts used. Probability vectors Probability and statistics turquoise concept icon. Data analyst skill abstract idea thin line illustration. Isolated outline drawing. Editable stroke. Arial
Free with trial Probability. Statistics, probability, analysis icon vector image. Can also be used for Math Symbols. Suitable for use on web apps, mobile apps and print media. Probability vectors Probability. Statistics, probability, analysis icon vector image. Can also be used for Math Symbols. Suitable for use on web apps, mobile apps and print media
Free with trial Dice roll probability table to calculate the probability of 2 dices. Vector. Probability vectors Dice roll probability table to calculate the probability of 2 dices. Vector
Free with trial Dice roll probability table to calculate the probability of 2 dices. Vector. Probability vectors Dice roll probability table to calculate the probability of 2 dices. Vector
Free with trial Probability and statistics concept icon. Analysis and prediction. Data analyst skill abstract idea thin line illustration. Isolated outline drawing. Editable stroke. Arial, Myriad Pro-Bold fonts used. Probability vectors Probability and statistics concept icon. Analysis and prediction. Data analyst skill abstract idea thin line illustration. Isolated outline drawing. Editable
Free with trial Business Contingency Plan for forecast the scenario, probability, impact, preparation, response. Vector. Probability vectors Business Contingency Plan for forecast the scenario, probability, impact, preparation, response. Vector
Free with trial Business Contingency Plan for forecast the likelihood, probability, impact and calculate the risk level of each scenario with 4 color thar meaning, low, medium, high and critical. Probability vectors Risk mitigation matrix for forecast the likelihood, probability, impact and calculate the risk level of each scenario. Business Contingency Plan for forecast the. Business Contingency Plan for forecast the likelihood, probability, impact and calculate the risk level of each scenario with 4 color thar meaning, low, medium, high and critical
Free with trial Business Contingency Plan for forecast the likelihood, probability, impact and calculate the risk level of each scenario with 4 color thar meaning, low, medium, high and critical. Probability vectors Risk mitigation matrix for forecast the likelihood, probability, impact and calculate the risk level of each scenario. Business Contingency Plan for forecast the. Business Contingency Plan for forecast the likelihood, probability, impact and calculate the risk level of each scenario with 4 color thar meaning, low, medium, high and critical
Free with trial Gaus chart with different height columns. Normal distribution graph. Bell shaped curve template for statistics or logistic data. Probability theory math function. Vector flat illustration. Probability vectors Gaussian or normal distribution graph. Bell shaped curve template for statistics or logistic data. Probability theory. Gaus chart with different height columns. Gaus chart with different height columns. Normal distribution graph. Bell shaped curve template for statistics or logistic data. Probability theory math function. Vector flat illustration
Free with trial Math, Mathematical probability, probability problems, exam question, for teachers, editable, eps, two sisters speech bubble. Probability vectors Math, Mathematical probability, probability problems, exam question. For teachers, editable, eps, two sisters speech bubble
Free with trial Math, Mathematical probability, probability problems, exam question, for teachers, editable, eps, two sisters speech bubble. Probability vectors Math, Mathematical probability, probability problems, exam question. For teachers, editable, eps, two sisters speech bubble
Free with trial Math, Mathematical probability, probability problems, exam question, for teachers, editable, eps, two sisters speech bubble. Probability vectors Math, Mathematical probability, probability problems, exam question. For teachers, editable, eps, two sisters speech bubble
Free with trial Math, Mathematical probability, probability problems, exam question, for teachers, editable, eps, two sisters speech bubble. Probability vectors Math, Mathematical probability, probability problems, exam question. For teachers, editable, eps, two sisters speech bubble
Free with trial Math, Mathematical probability, probability problems, exam question, for teachers, editable, eps, two sisters speech bubble. Probability vectors Math, Mathematical probability, probability problems, exam question. For teachers, editable, eps, two sisters speech bubble
Free with trial Math, Mathematical probability, probability problems, exam question, for teachers, editable, eps, two sisters speech bubble. Probability vectors Math, Mathematical probability, probability problems, exam question. For teachers, editable, eps, two sisters speech bubble
Free with trial Business Contingency Plan for forecast the likelihood, probability, impact and calculate the risk level of each scenario. Vector. Probability vectors Business Contingency Plan for forecast the likelihood, probability, impact and calculate the risk level of each scenario. Vector
Free with trial Color illustration icon for Probability, contingency, climate, rain, cloud, prospect and chances. Probability vectors Color illustration icon for Probability, prospect and chances. Color illustration icon for Probability, contingency, climate, rain, cloud, prospect and chances. Color illustration icon for Probability, contingency, climate, rain, cloud, prospect and chances
Free with trial Gauss distribution. Standard normal distribution. Bell curve symbol. Math probability theory. Vector illustration isolated on white background. Probability vectors Gauss distribution. Standard normal distribution. Bell curve symbol. Math probability theory. Vector illustration. Isolated on white background
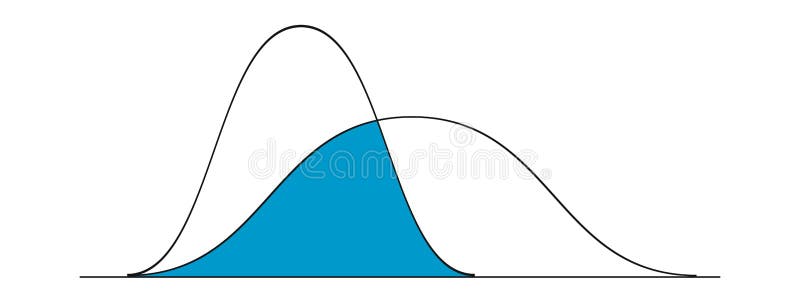
Free with trial Gaussian or normal distribution graphs examples. Bell curve templates. Probability theory concept. Layout for statistics or logistic data isolated on white background. Vector illustration. Probability vectors Gaussian or normal distribution graphs examples. Bell curve templates. Probability theory concept. Layout for statistics. Or logistic data isolated on white. Gaussian or normal distribution graphs examples. Bell curve templates. Probability theory concept. Layout for statistics or logistic data isolated on white background. Vector illustration
Free with trial Cloud probability linear icons set. Chance, Forecast, Possibility, Likelihood, Uncertainty, Risk, Probability vector symbols and line concept signs. Predictability,Expectation,Potentiality illustration. Probability vectors Cloud probability linear icons set. Chance, Forecast, Possibility, Likelihood, Uncertainty, Risk, Probability line. Cloud probability linear icons set. Chance. Cloud probability linear icons set. Chance, Forecast, Possibility, Likelihood, Uncertainty, Risk, Probability vector symbols and line concept signs. Predictability,Expectation,Potentiality illustration
Free with trial Statistical Methods outline icons collection. Regression, Confidence interval, Hypothesis, Probability, Correlation. Probability vectors Statistical Methods line icons collection. Regression, Confidence interval, Hypothesis, Probability, Correlation. Statistical Methods outline icons collection. Statistical Methods outline icons collection. Regression, Confidence interval, Hypothesis, Probability, Correlation
 Sign in