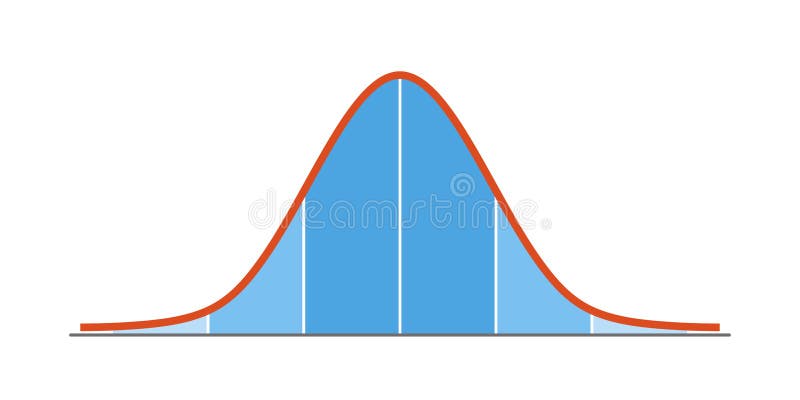
Free with trial Bell curve graph. . Gaussian or normal distribution graph. Probability vectors Bell curve graph. Gaussian or normal distribution graph. Probability theory mathematical function. Infographic, Giving, Parabola,. Bell curve graph. . Gaussian. Bell curve graph. . Gaussian or normal distribution graph
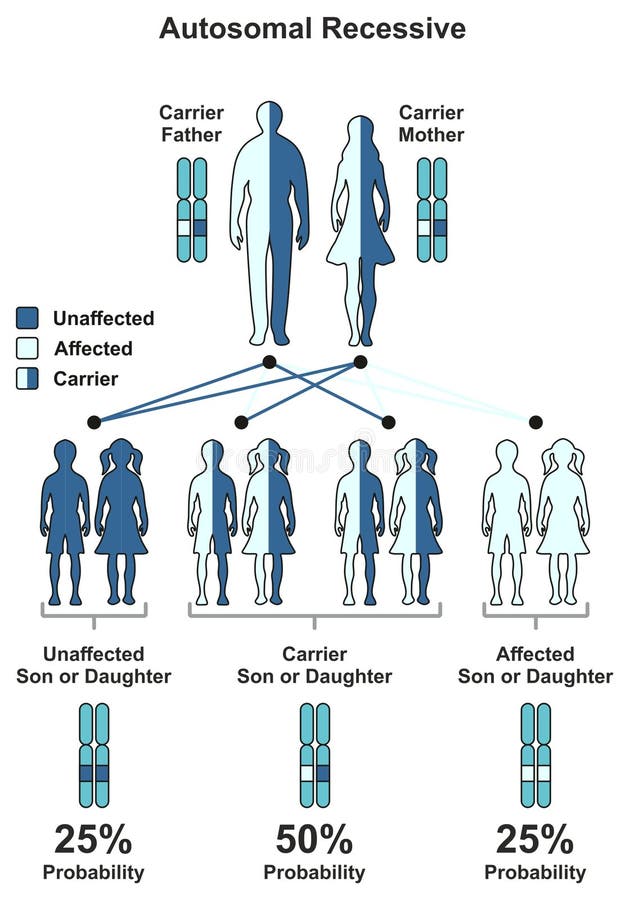
Free with trial Autosomal Recessive Hereditary Trait infographic diagram including parents father and mother probability of son and daughter to be affected unaffected or carrier for genetic science education. Probability vectors Autosomal Recessive Hereditary Trait. Infographic diagram including parents father and mother probability of son and daughter to be affected unaffected or. Autosomal Recessive Hereditary Trait infographic diagram including parents father and mother probability of son and daughter to be affected unaffected or carrier for genetic science education
Free with trial Gauss distribution. Standard normal distribution. Gaussian bell graph curve. Business and marketing concept. Math probability theory. Editable stroke. Vector illustration isolated on white background. Probability vectors Gauss distribution. Standard normal distribution. Gaussian bell graph curve. Business and marketing concept. Math. Probability theory. Editable stroke. Vector. Gauss distribution. Standard normal distribution. Gaussian bell graph curve. Business and marketing concept. Math probability theory. Editable stroke. Vector illustration isolated on white background.
Free with trial Women and men avatars design of Probability of contagion of Covid 19 virus using masks theme Vector illustration. Probability vectors Probability of contagion using masks women and men avatars vector design. Women and men avatars design of Probability of contagion of Covid 19 virus using masks. Women and men avatars design of Probability of contagion of Covid 19 virus using masks theme Vector illustration
Free with trial Women avatars design of Probability of contagion of Covid 19 virus using masks theme Vector illustration. Probability vectors Probability of contagion using masks and women avatars vector design. Women avatars design of Probability of contagion of Covid 19 virus using masks theme Vector. Women avatars design of Probability of contagion of Covid 19 virus using masks theme Vector illustration
Free with trial Women and men avatars design of Probability of contagion of Covid 19 virus using masks theme Vector illustration. Probability vectors Probability of contagion using masks women and men avatars vector design. Women and men avatars design of Probability of contagion of Covid 19 virus using masks. Women and men avatars design of Probability of contagion of Covid 19 virus using masks theme Vector illustration
Free with trial Bell curve graph. . Gaussian or normal distribution graph. Probability vectors Bell curve graph. Gaussian or normal distribution graph. Probability theory mathematical function. Infographic, Giving, Parabola,. Bell curve graph. . Gaussian. Bell curve graph. . Gaussian or normal distribution graph
Free with trial Sex Linked Characters Infographic Diagram with example of optic atrophy nerve fiber sense of vision. eye to brain visual deterioration punnett square genetic probability for heredity gene science education vector. Probability vectors Sex Linked Characters Infographic Diagram with example of optic atrophy. Nerve fiber sense of vision. eye to brain visual deterioration punnett square genetic. Sex Linked Characters Infographic Diagram with example of optic atrophy nerve fiber sense of vision. eye to brain visual deterioration punnett square genetic probability for heredity gene science education vector
Free with trial Bell curve symbol, a simplified diagram for a standard normal distribution, also called Gaussian distribution, used in probability theory and in statistics. Illustration on white background. Vector. Probability vectors Bell curve symbol, simplified diagram for a standard normal distribution. Bell curve symbol, a simplified diagram for a standard normal distribution, also called. Bell curve symbol, a simplified diagram for a standard normal distribution, also called Gaussian distribution, used in probability theory and in statistics. Illustration on white background. Vector.
Free with trial Data report and science model research, deep analysis with AI thin line icons set vector illustration. Abstract outline machine learning, probability calculation, algorithms and system prediction. Probability vectors Data report and science model research, deep analysis with AI thin line icons set. Vector illustration. Abstract outline machine learning, probability. Data report and science model research, deep analysis with AI thin line icons set vector illustration. Abstract outline machine learning, probability calculation, algorithms and system prediction
Free with trial Business and Marketing or Social Research Process, Snowball Sampling Is A Non-Probability Sampling Technique in Qualitative Research on Black Chalkboard. Probability vectors Snowball Sampling, The Sampling Methods in Qualitative Research. Business and Marketing or Social Research Process, Snowball Sampling Is A Non-Probability. Business and Marketing or Social Research Process, Snowball Sampling Is A Non-Probability Sampling Technique in Qualitative Research on Black Chalkboard.
Free with trial A pair of dice, depicted in a flat style, showing distinct numbers. Represents games of chance, probability, and gambling. Ideal for casino promotions, board game designs, or decision-making concepts. Simple and versatile for various gaming-related projects. vector design Generative AI. Probability vectors Pair of Dice Game and Chance Elements, vector design Generative AI. A pair of dice, depicted in a flat style, showing distinct numbers. Represents games of. A pair of dice, depicted in a flat style, showing distinct numbers. Represents games of chance, probability, and gambling. Ideal for casino promotions, board game designs, or decision-making concepts. Simple and versatile for various gaming-related projects. vector design Generative AI
Free with trial Business and Marketing or Social Research Process, Classification of Sampling Methods The Probability and Non-Probability Sampling in Qualitative Research on Black Chalkboard. Probability vectors Classification of Sampling Methods in Qualitative Research. Business and Marketing or Social Research Process, Classification of Sampling Methods The Probability. Business and Marketing or Social Research Process, Classification of Sampling Methods The Probability and Non-Probability Sampling in Qualitative Research on Black Chalkboard.
Free with trial Covid-19 transmission probability infographic showing how high the risk of coronavirus transmission depending on prevention measures taken. A children with face masks at school. Vector illustration. Probability vectors Covid-19 transmission probability infographic showing how high is the risk of coronavirus transmission depending on. Covid-19 transmission probability. Covid-19 transmission probability infographic showing how high the risk of coronavirus transmission depending on prevention measures taken. A children with face masks at school. Vector illustration
Free with trial Business and Marketing or Social Research Process, Snowball Sampling Is A Non-Probability Sampling Technique in Qualitative Research. Probability vectors Snowball Sampling, The Sampling Methods in Qualitative Research. Business and Marketing or Social Research Process, Snowball Sampling Is A Non-Probability. Business and Marketing or Social Research Process, Snowball Sampling Is A Non-Probability Sampling Technique in Qualitative Research.
Free with trial Business and Marketing or Social Research Process, Snowball Sampling Is A Non-Probability Sampling Technique in Qualitative Research on Old Antique Vintage Grunge Paper Texture Background. Probability vectors Snowball Sampling, The Sampling Methods in Qualitative Research. Business and Marketing or Social Research Process, Snowball Sampling Is A Non-Probability. Business and Marketing or Social Research Process, Snowball Sampling Is A Non-Probability Sampling Technique in Qualitative Research on Old Antique Vintage Grunge Paper Texture Background.
Free with trial Four Set of Snowball Samplings, The Non-Probability Sampling Technique in Qualitative Research. Probability vectors Snowball Sampling, The Sampling Methods in Qualitative Research. Four Set of Snowball Samplings, The Non-Probability Sampling Technique in Qualitative Research. Four Set of Snowball Samplings, The Non-Probability Sampling Technique in Qualitative Research.
Free with trial Two Set of Snowball Samplings, The Non-Probability Sampling Technique in Qualitative Research. Probability vectors Snowball Sampling, The Sampling Methods in Qualitative Research. Two Set of Snowball Samplings, The Non-Probability Sampling Technique in Qualitative Research. Two Set of Snowball Samplings, The Non-Probability Sampling Technique in Qualitative Research.
Free with trial Basic principles of genetics. Mendel peas experiment. Probability of inheriting particular traits. Vector illustration. Probability vectors Mendelian inheritance. Punnett square. Genetic cross with known genotypes. Basic principles of genetics. Mendel peas experiment. Probability of inheriting. Basic principles of genetics. Mendel peas experiment. Probability of inheriting particular traits. Vector illustration.
Free with trial A sketch-style vector illustration of two dice tumbling, representing a game of chance. This dynamic image is perfect for casino branding, game night invitations, and content about luck, risk, and probability. Fun and engaging, vector design Generative AI. Probability vectors Two Rolling Dice Sketch, Game of Chance Vector Illustration, vector design Generative AI. A sketch-style vector illustration of two dice tumbling, representing a. A sketch-style vector illustration of two dice tumbling, representing a game of chance. This dynamic image is perfect for casino branding, game night invitations, and content about luck, risk, and probability. Fun and engaging, vector design Generative AI
Free with trial Gauss distribution. Standard normal distribution. Gaussian bell graph curve. Business and marketing concept. Math probability theory. Editable stroke. Vector illustration isolated on white background. Probability vectors Gauss distribution. Standard normal distribution. Gaussian bell graph curve. Business and marketing concept. Math. Probability theory. Editable stroke. Vector. Gauss distribution. Standard normal distribution. Gaussian bell graph curve. Business and marketing concept. Math probability theory. Editable stroke. Vector illustration isolated on white background.
Free with trial Gauss distribution. Standard normal distribution. Gaussian bell graph curve. Business and marketing concept. Math probability theory. Editable stroke. Vector illustration isolated on white background. Probability vectors Gauss distribution. Standard normal distribution. Gaussian bell graph curve. Business and marketing concept. Math. Probability theory. Editable stroke. Vector. Gauss distribution. Standard normal distribution. Gaussian bell graph curve. Business and marketing concept. Math probability theory. Editable stroke. Vector illustration isolated on white background.
Free with trial Risk management matrix with impact and likelihood, businessman analyzing the level of risk by considering the category of probability or likelihood against the category of consequence severity. Probability vectors Risk management matrix with impact and likelihood, businessman analyzing the level of risk by considering the category of. Probability or likelihood against the. Risk management matrix with impact and likelihood, businessman analyzing the level of risk by considering the category of probability or likelihood against the category of consequence severity
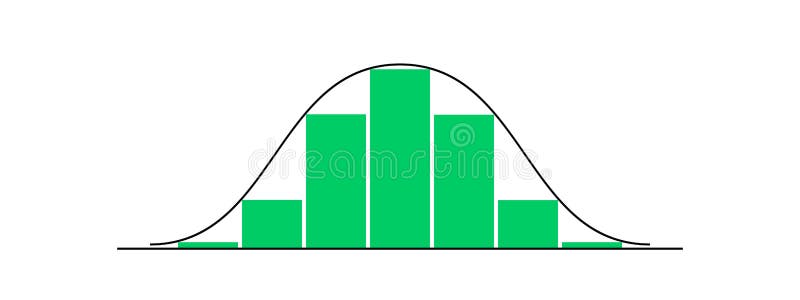
Free with trial Bell shaped curve with different heights columns. Gaussian or normal distribution graph. Template for statistics or logistic data. Probability theory mathematical function. Vector flat illustration. Probability vectors Bell shaped curve with different heights columns. Gaussian or normal distribution graph. Template for statistics or. Logistic data. Probability theory. Bell shaped curve with different heights columns. Gaussian or normal distribution graph. Template for statistics or logistic data. Probability theory mathematical function. Vector flat illustration
Free with trial National Fireworks Safety Month is traditionally celebrated in June at the height of the holidays and the high probability of dangerous fires. All elements are isolated. Probability vectors National Fireworks Safety Month is traditionally celebrated in June at the height of the holidays and the high probability of. Dangerous fires. All elements are
Free with trial An image of a 3d venn diagram. Probability vectors 3d Venn Diagram. An image of a 3d venn diagram. An image of a 3d venn diagram.
Free with trial Bayesian analysis example model, vector illustration labeled graph lines. Decision making approach for drawing evidence based conclusions about hypothesis. Prior and posterior beliefs relationship. Probability vectors Bayesian analysis example model. Vector illustration labeled graph lines. Decision making approach for drawing evidence based conclusions about hypothesis. Bayesian analysis example model, vector illustration labeled graph lines. Decision making approach for drawing evidence based conclusions about hypothesis. Prior and posterior beliefs relationship.
Free with trial Number Wheel 1-10. Vector number wheel showing numbers 1-10 in a random odd-even order. Assets are on separate layers with dashed strokes. Probability vectors Number Wheel 1-10. Vector number wheel showing numbers 1-10 in a random odd-even order. Assets are on separate layers with dashed strokes
Free with trial Set of modern thin line icons for math. Vector illustration with different elements on the subject mathematics. Probability vectors Set of modern thin line icons for math. Vector illustration with different elements on the subject mathematics
Free with trial Allthe numbers from 0 to 9 in a unique fruit machine (slot machine) format. Fruits, bells coins, cherries and lemons are just some of the standard icons used. Probability vectors Slot Machine Numbers. Allthe numbers from 0 to 9 in a unique fruit machine (slot machine) format. Fruits, bells coins, cherries and lemons are just some of the. Allthe numbers from 0 to 9 in a unique fruit machine (slot machine) format. Fruits, bells coins, cherries and lemons are just some of the standard icons used.
Free with trial A team of business people who assess and monitor possible threats to business. The concept of risk management. Illustration in flat style. Probability vectors Risk Management Concept. A team of business people who assess and monitor possible threats to business. The concept of risk management. Illustration in flat. A team of business people who assess and monitor possible threats to business. The concept of risk management. Illustration in flat style
Free with trial Bean machine, Galton board, wooden textured, iron balls - generating Gaussian bell curve. Education and science tool for mathematics and physics. Isolated vector illustration. Probability vectors Bean Machine Galton Board Wooden Texture. Bean machine, Galton board, wooden textured, iron balls - generating Gaussian bell curve. Education and science tool. Bean machine, Galton board, wooden textured, iron balls - generating Gaussian bell curve. Education and science tool for mathematics and physics. Isolated vector illustration.
Free with trial Two pigs with wings flying high into the sky. Probability vectors When Pigs Fly. Two pigs with wings flying high into the sky. Two pigs with wings flying high into the sky.
Free with trial Child Blood Type. Chart. How mother and father blood types impact blood type of their children. Vector diagram showing the potential outcomes. illustration for educational, science and medical use. Probability vectors Child Blood Type. diagram. Child Blood Type. Chart. How mother and father blood types impact blood type of their children. Vector diagram showing the potential. Child Blood Type. Chart. How mother and father blood types impact blood type of their children. Vector diagram showing the potential outcomes. illustration for educational, science and medical use
Free with trial Galton box and normal distribution with red Gaussian bell curve. Bean machine, also quincunx, device to demonstrate the central limit theorem in mathematics. Illustration on white background. Vector. Probability vectors Galton box, normal distribution, Gaussian bell curve. Galton box and normal distribution with red Gaussian bell curve. Bean machine, also quincunx, device to. Galton box and normal distribution with red Gaussian bell curve. Bean machine, also quincunx, device to demonstrate the central limit theorem in mathematics. Illustration on white background. Vector.
Free with trial Insurance And Risk Banners Set. Insurance and risk horizontal banners set with compensation symbols flat vector illustration. Probability vectors Insurance And Risk Banners Set. Insurance and risk horizontal banners set with compensation symbols flat vector illustration
Free with trial The mathematics of the Galton board with normal distribution and Gaussian bell curve. Also quincunx, bean machine or Galton box. Device to demonstrate the central limit theorem. Illustration. Vector. Probability vectors Mathematics of the Galton board with normal distribution. The mathematics of the Galton board with normal distribution and Gaussian bell curve. Also quincunx. The mathematics of the Galton board with normal distribution and Gaussian bell curve. Also quincunx, bean machine or Galton box. Device to demonstrate the central limit theorem. Illustration. Vector.
Free with trial Math related symbols. Set of math abstract signs. Probability vectors Math related symbols. Set of math abstract signs
Free with trial Statistical data abstract with graphs and charts on paper and tablet computer. Flat style vector illustration on white background. Probability vectors Statistical data abstract on paper and tablet. Statistical data abstract with graphs and charts on paper and tablet computer. Flat style vector illustration on. Statistical data abstract with graphs and charts on paper and tablet computer. Flat style vector illustration on white background.
Free with trial Electron cloud model illustration. Describing electrons position around nucleus. Probability vectors Electron cloud model illustration. Describing electrons position around nucleus
Free with trial Bell curve graphic depicting normal performance distribution outline diagram. Labeled educational expectation measurement or prediction percentage analysis vector illustration. Average standard theory. Probability vectors Bell curve graphic depicting normal performance distribution outline diagram. Labeled educational expectation measurement or prediction percentage analysis
Free with trial A vector set of in several different colors and position. This vector is very good for design that need dice element. Probability vectors Dice in Several Positions and Colors. A vector set of in several different colors and position. This vector is very good for design that need dice element. A vector set of in several different colors and position. This vector is very good for design that need dice element.
Free with trial Tightrope business man. Illustration of a business man walking on a tightrope at risk. Probability vectors Tightrope business man. Illustration of a business man walking on a tightrope at risk
Free with trial Business Insurance Concept Icons Set. With legal assistance symbols flat vector illustration. Probability vectors Business Insurance Concept Icons Set. With legal assistance symbols flat vector illustration
Free with trial Possible Impossible. Illustration of a conceptual signboard about possibilities impossible and possible. Probability vectors Possible Impossible. Illustration of a conceptual signboard about possibilities impossible and possible
Free with trial Statistical data paper abstract with graphs and charts. Flat style vector illustration on white background. Probability vectors Statistical data paper abstract with graphs. And charts. Flat style vector illustration on white background
Free with trial Opportunity typography vector illustration. Dont wait for opportunity , create it. Motivational poster with text about leadership. Probability vectors Motivational poster about opportunity. Opportunity typography vector illustration. Dont wait for opportunity , create it. Motivational poster with text about. Opportunity typography vector illustration. Dont wait for opportunity , create it. Motivational poster with text about leadership.
Free with trial Freelance career. Actuary. Flat design. Probability vectors Freelance career. Actuary. Flat design . Freelance career. Actuary
Free with trial Bean machine and normal distribution with red Gaussian bell curve. Galton box, also quincunx, device to demonstrate the central limit theorem in mathematics. Illustration on white background. Vector. Probability vectors Bean machine, normal distribution, Gaussian bell curve. Bean machine and normal distribution with red Gaussian bell curve. Galton box, also quincunx, device to. Bean machine and normal distribution with red Gaussian bell curve. Galton box, also quincunx, device to demonstrate the central limit theorem in mathematics. Illustration on white background. Vector.
Free with trial Dice single line drawing. Classic game gambling risk. Casino ads luck chance design. Minimalist outline white background. Vector illustration. Probability vectors Dice single line drawing. Classic game gambling risk. Casino ads luck chance design. Minimalist outline white background. Vector illustration
Free with trial Math related symbols. Set of math abstract signs. Probability vectors Math related symbols. Set of math abstract signs
Free with trial Future prediction, AI forecasting and data insight concept with a glowing digital crystal ball on circuit lines, created in neon blue polygon mesh futuristic style vector illustration. Probability vectors AI Prediction Sphere. Digital Crystal Ball for Future Forecasting in Futuristic Tech Vector. Future prediction, AI forecasting and data insight concept with a. Future prediction, AI forecasting and data insight concept with a glowing digital crystal ball on circuit lines, created in neon blue polygon mesh futuristic style vector illustration.
Free with trial Galton box, bean machine, quincunx. Mathematics. Device to demonstrate the central limit theorem. The normal distribution is approximate to binomial distribution. Black and white illustration. Vector. Probability vectors Galton box, bean machine, quincunx, black and white. Galton box, bean machine, quincunx. Mathematics. Device to demonstrate the central limit theorem. The normal. Galton box, bean machine, quincunx. Mathematics. Device to demonstrate the central limit theorem. The normal distribution is approximate to binomial distribution. Black and white illustration. Vector.
Free with trial Spinning colorful wheel of fortune captures the thrill of gambling, chance, and the joy of winning a prize, embodying the excitement of games and contests in a vibrant design. Probability vectors Spinning colorful wheel of fortune captures the thrill of gambling, chance, and the joy of winning a prize, embodying. The excitement of games and contests in a
Free with trial Super hero dice with cape saves the day. Cartoon illustration dice of random super hero dice with cape. Probability vectors Super hero dice with cape saves the day. Cartoon illustration dice of random super hero dice with cape
Free with trial FMEA. Failure mode and effects analysis process diagram. Business analysis concept. Vector. Illustration. Probability vectors FMEA. Failure mode and effects analysis process diagram. Business analysis concept. Vector. Illustration
Free with trial FMEA. Failure mode and effects analysis process diagram. Business analysis concept. Vector. Illustration. Probability vectors FMEA. Failure mode and effects analysis process diagram. Business analysis concept. Vector. Illustration
Free with trial Galton board showing normal distribution, generating Gaussian bell curve. Also bean machine, quincunx or Galton box. Device to demonstrate the central limit theorem. Mathematics. Illustration. Vector. Probability vectors Galton board showing normal distribution. Generating Gaussian bell curve. Also bean machine, quincunx or Galton box. Device to demonstrate the central limit. Galton board showing normal distribution, generating Gaussian bell curve. Also bean machine, quincunx or Galton box. Device to demonstrate the central limit theorem. Mathematics. Illustration. Vector.
Free with trial Freedom and responsibility typography vector illustration. Responsibility is the price of freedom lettering. Motivational poster with text about leadership. Probability vectors Motivational poster about responsibility and freedom. Freedom and responsibility typography vector illustration. Responsibility is the price of freedom lettering. Freedom and responsibility typography vector illustration. Responsibility is the price of freedom lettering. Motivational poster with text about leadership.
Free with trial Venn diagram. 3 overlapping circles on white background. elementary set theory. Infographic chart. vector illustration. Probability vectors Venn diagram. 3 overlapping circles on white background. Elementary set theory. Infographic chart. vector illustration
Free with trial Wave of infection and epidemic outbreak of a disease. One person infects three more. Exponential increase and growth. The number of cases increases exponentially. Black illustration over white. Vector. Probability vectors Wave of infection and epidemic outbreak of a disease. One person infects three more. Exponential increase and growth. The number of cases increases
Free with trial Abstract background texture. Moon surface probabil. Ity. Vector. Probability vectors Abstract background texture. Moon surface probabil. Ity. Vector
Free with trial Bell curve graph. . Gaussian or normal distribution graph. Probability vectors Bell curve graph. Gaussian or normal distribution graph. Probability theory mathematical function. Infographic, Giving, Parabola,. Bell curve graph. . Gaussian. Bell curve graph. . Gaussian or normal distribution graph
Free with trial Snowball sampling sample taken from a group of people sampling statistic method research participants recruit other. Participants for a test or study vector. Probability vectors Snowball sampling sample taken from a group of people sampling statistic method research participants recruit other. Participants for a test or study vector
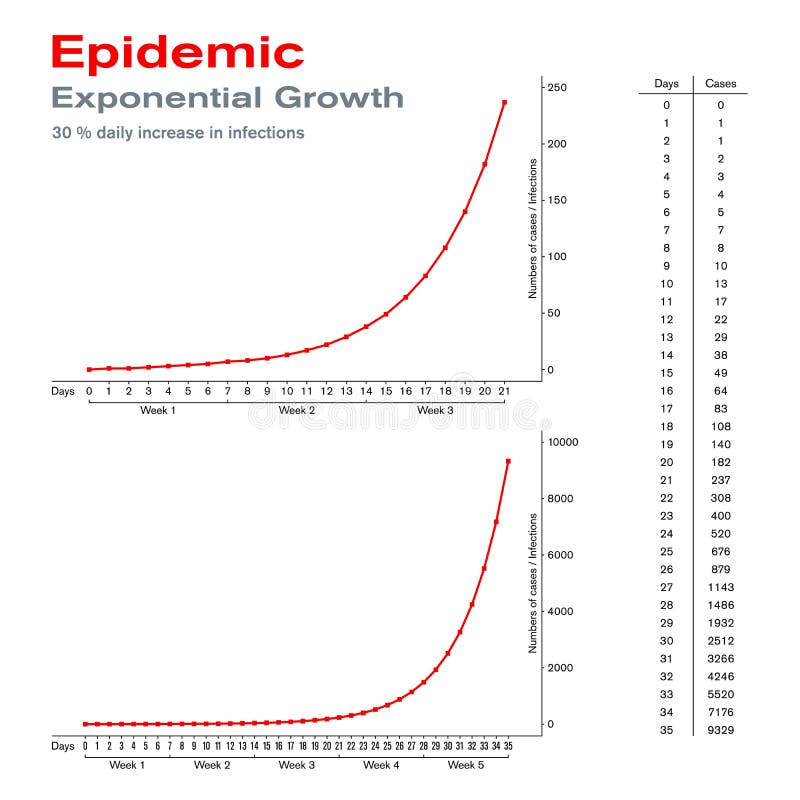
Free with trial Epidemic. Exponential growth. On the example of 30 percent daily increase in infections. Rapid spread and epidemic outbreak of a disease makes it clear how important early countermeasures are. Vector. Probability vectors Epidemic. Exponential growth with 30 percent daily increase in infections. Epidemic. Exponential growth. On the example of 30 percent daily increase in. Epidemic. Exponential growth. On the example of 30 percent daily increase in infections. Rapid spread and epidemic outbreak of a disease makes it clear how important early countermeasures are. Vector.
Free with trial Spinning wheel of fortune showcasing vibrant money and star prizes, embodying themes of luck, chance, and gambling while inviting thoughts of wealth and rewards. Probability vectors Spinning wheel of fortune showcasing vibrant money and star prizes, embodying themes of luck, chance, and gambling while. Inviting thoughts of wealth and
Free with trial Diagram seamless pattern. Illustration of diagrams on chalkboard, seamless pattern. Probability vectors Diagram seamless pattern. Illustration of diagrams on chalkboard, seamless pattern
Free with trial Correlation vs causation connection and differences analysis outline diagram. Labeled educational explanation scheme with weather example for cause relationship in statistics vector illustration. Probability vectors Correlation vs causation connection and differences analysis outline diagram. Labeled educational explanation scheme with weather example for cause
Free with trial Standard deviation as statistics mathematical calculation outline diagram. Labeled educational scheme with sample mean, observed value and formula explanation vector illustration. Math data analysis. Probability vectors Standard deviation as statistics mathematical calculation outline diagram. Labeled educational scheme with sample mean, observed value and formula explanation
Free with trial Shield with x-ray and cancer screening. For your health. Probability vectors Shield with x-ray and cancer screening. For your health
Free with trial Exclamation mark and dollar coins on scale. Risk and reward balance, danger, finance and investment concept. Flat design. EPS 8 vector illustration, no transparency, no gradients. Probability vectors Risk and money, balance. Exclamation mark and dollar coins on scale. Risk and reward balance, danger, finance and investment concept. Flat design. EPS 8 vector. Exclamation mark and dollar coins on scale. Risk and reward balance, danger, finance and investment concept. Flat design. EPS 8 vector illustration, no transparency, no gradients
Free with trial Four sets of dice are illustrated on a pink background, each comprising three red dice with white spots. The dice are arranged in various formations, showcasing different numbers visible on their surfaces. The simple, graphic style emphasizes the iconic look of casino dice, with clean lines and stark contrasts between the red and white. These dice symbolize games of chance often associated with number seven, an important figure in gambling and luck. Probability vectors Four sets of dice are illustrated on a pink background, each comprising three red dice with white spots. The dice are arranged in various formations
Free with trial Dice 3d realistic game icons set vector illustration. Probability vectors Dice 3d realistic game icons set vector illustration. Dice realistic game icons set vector illustration
Free with trial Expectations word cloud. Concept. Vector illustration. Probability vectors Expectations word cloud. Concept. Vector illustration
Free with trial Correlation and results consistency with statistics data tiny person concept. Information research based on information surveillance and variables analysis vector illustration. Graphic presentation. Probability vectors Correlation and results consistency with statistics data tiny person concept. Information research based on information surveillance and variables analysis
Free with trial Concept Line Icons Set 13 Math. Math subdisciplines and areas icons in white isolated background used for school and university education. Probability vectors Concept Line Icons Set 13 Math. Math subdisciplines and areas icons in white isolated background used for school and university education
Free with trial RISK. Concept with people, letters and icons. Colored flat vector illustration. Isolated on white background. Probability vectors RISK. Concept with people, letters and icons. Flat vector illustration. Isolated on white background. RISK. Concept with people, letters and icons. Colored flat. RISK. Concept with people, letters and icons. Colored flat vector illustration. Isolated on white background.
Free with trial Vector of flat icons, Basic graph, chart and diagram set for business data. On isolated background. Probability vectors Vector of flat icons, Basic graph, chart and diagram set for business data. On isolated background
Free with trial Business and Marketing Concepts, Illustration of 3 Stage Standard Deviation Diagram, Gaussian Bell or Normal Distribution Curve Isolated on White Background. Probability vectors Standard Deviation Diagram on A White Background. Business and Marketing Concepts, Illustration of 3 Stage Standard Deviation Diagram, Gaussian Bell or Normal. Business and Marketing Concepts, Illustration of 3 Stage Standard Deviation Diagram, Gaussian Bell or Normal Distribution Curve Isolated on White Background
Free with trial Business and Marketing Concepts, Illustration of Standard Deviation Diagram Chart, Gaussian Bell Graph or Normal Distribution Curve on Old Antique Vintage Grunge Paper Texture Background. Probability vectors Normal Distribution Diagram on Old Paper Background. Business and Marketing Concepts, Illustration of Standard Deviation Diagram Chart, Gaussian Bell Graph or. Business and Marketing Concepts, Illustration of Standard Deviation Diagram Chart, Gaussian Bell Graph or Normal Distribution Curve on Old Antique Vintage Grunge Paper Texture Background.
 Sign in