Free with trial Cost reduction concept. Quality increase and cost optimization, Hands typing on a laptop with digital icons representing business efficiency and cost reduction. Effective business, Expense reduce. Analysis decrease illustrations Cost reduction concept. Quality increase and cost optimization, Hands typing on a laptop with digital icons representing business
Free with trial A person holding a glowing globe with arrows indicating rising quality and falling costs. Analysis decrease illustrations Concept of improving quality while reducing costs with a global view. A person holding a glowing globe with arrows indicating rising quality and falling costs
Free with trial Elevate your financial presentations and data visualizations with these captivating vintage-style arrow graphics. Perfect for illustrating price fluctuations, interest rate movements, and market trends, these retro-inspired up and down arrow designs are a visually engaging way to convey complex information. The sepia tone and textured background add a touch of vintage charm, bringing a classic. Analysis decrease illustrations Vintage-Inspired Arrow Graphics for Illustrating Price & Interest Rate Trends: A Retro Style Design Element. Elevate your financial presentations and data visualizations with these captivating vintage-style arrow graphics. Perfect for illustrating price fluctuations, interest rate movements, and market trends, these retro-inspired up and down arrow designs are a visually engaging way to convey complex information. The sepia tone and textured background add a touch of vintage charm, bringing a classic
Free with trial Minimalist illustration of a presentation showing a negative trend, with a chart and a red arrow going down. Analysis decrease illustrations Presentation showing negative trend with arrow and chart going down. Minimalist illustration of a presentation showing a negative trend, with a chart and a red arrow going down
Free with trial 3D rendering of a bar graph illustrating a downward trend with blue bars decreasing in height and a red line graph charting the decline set against a dark backdrop signifying business loss economic downturn and financial risk. Analysis decrease illustrations 3D Bar Chart Showing Downward Trend with Red Line Graph Illustrating Business Loss and Economic Decline on Dark Background. 3D rendering of a bar graph. 3D rendering of a bar graph illustrating a downward trend with blue bars decreasing in height and a red line graph charting the decline set against a dark backdrop signifying business loss economic downturn and financial risk
Free with trial Visualizing the current economic downturn through a stark, red background flat lay, this image showcases a downward trend represented by wooden blocks. The falling blocks symbolize the decline in key market indicators and highlight the instability and uncertainty impacting global economies. This analytical approach provides insights into the factors driving market crashes and recessions, offering. Analysis decrease illustrations Analyzing Economic Downturn Impacts Market Crash Predictions Investment Strategies Revealed Through Declining Wooden. Visualizing the current economic downturn through a stark, red background flat lay, this image showcases a downward trend represented by wooden blocks. The falling blocks symbolize the decline in key market indicators and highlight the instability and uncertainty impacting global economies. This analytical approach provides insights into the factors driving market crashes and recessions, offering
Free with trial This vibrant image features a collection of colorful 3D bar graphs representing data trends, perfect for visualizing statistics in business presentations and analyses. Analysis decrease illustrations Colorful Bar Graph with 3D Shapes Representing Data Trends and Visualizing Statistics in Business and Finance Environments. This vibrant image features a collection of colorful 3D bar graphs representing data trends, perfect for visualizing statistics in business presentations and analyses
Free with trial Reduce labor costs icon Vector symbol or sign set collection in black and white outline. Analysis decrease vectors Worker Wage Reduction Icon Symbolizing Decrease in Labor Income. Reduce labor costs icon Vector symbol or sign set collection in black and white outline
Free with trial This image features an intricate bar graph displaying colorful statistical data trends, perfect for business reports and presentations. Analyze metrics effectively. Analysis decrease illustrations Colorful Data Visualization with Bar Graphs and Trends Displaying Statistical Information on a White Background. This image features an intricate bar graph displaying colorful statistical data trends, perfect for business reports and presentations. Analyze metrics effectively
Free with trial Two adjacent panels display a line graph icon with dual zigzagging lines and circular data points. On the left, the icon is black on a white background. On the right, it's white on a dark background. Both icons feature the line graph at a 45-degree angle, suggesting an increase in data points, with round nodes indicating specific values along the line. The simplistic design focuses on contrast and clarity, ideal for visual representation in data analysis or presentation templates. Analysis decrease vectors Increase Icon. Solid glyph series icon. Two adjacent panels display a line graph icon with dual zigzagging lines and circular data points. On the left, the icon is black on a white background. On the right, it's white on a dark background. Both icons feature the line graph at a 45-degree angle, suggesting an increase in data points, with round nodes indicating specific values along the line. The simplistic design focuses on contrast and clarity, ideal for visual representation in data analysis or presentation templates.
Free with trial Economic critical crisis concept. The bar garph with dropdown arrow on red table background. Recession financial, cryptocurrency, gold, and the stock market. Losing money and cash. Bearish. Analysis decrease vectors Economic critical crisis concept. The bar garph with dropdown arrow on red table background. Recession financial, cryptocurrency
Free with trial Blue stacked arrows illustrate financial growth, market trends. Graphic displays upward, downward movement, signifying progress, decline in business economy. Represents strategy,. Analysis decrease illustrations Blue stacked arrows illustrate financial growth, market trends. Graphic displays upward, downward movement, signifying progress
Free with trial Black outline icon representing dna structure increasing while decreasing. Analysis decrease illustrations Dna structure increasing while decreasing showing genetic mutation icon. Black outline icon representing dna structure increasing while decreasing
Free with trial A striking 3D representation of a world globe with a declining arrow and oil barrels, symbolizing economic downturn and market struggles. Analysis decrease illustrations Global downturn concept with declining arrow, oil barrels, and world map in 3D representation, illustrating market challenges. A striking 3D representation of a world globe with a declining arrow and oil barrels, symbolizing economic downturn and market struggles
Free with trial This image represents financial loss with a graph showing a downward trend, symbolizing economic decline. A hand supports the graph, highlighting investment risks. Analysis decrease vectors Vector art of financial loss concept a hand supports a graph showing a downward trend, indicating economic decline and potential. This image represents financial loss with a graph showing a downward trend, symbolizing economic decline. A hand supports the graph, highlighting investment risks
Free with trial Discount percentage arrow icon representing price reductions, financial market decline, interest rate drops, economic recession, and sales promotions, isolated on white & transparent background, this image is generated using AI. Analysis decrease vectors Discount percentage arrow icon representing price reductions, financial market decline, interest rate drops, economic recession
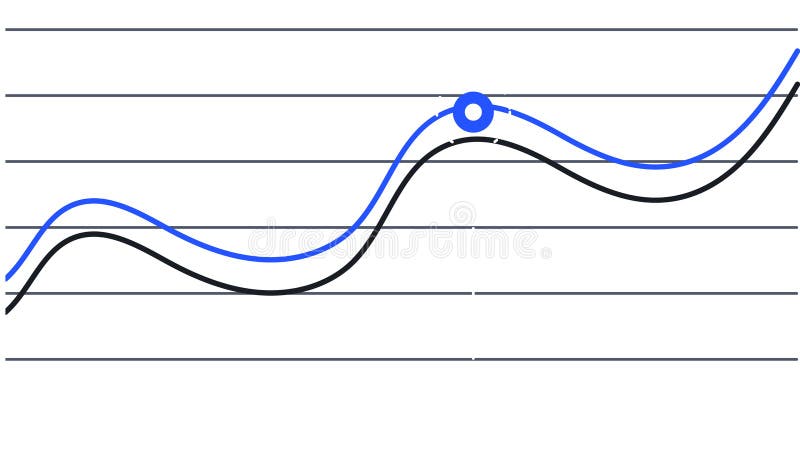
Free with trial Two lines are representing data progression over time, one blue and one black, creating a visual representation of trends and a key intersection point is marked with a blue circle. Analysis decrease illustrations Two lines are representing data progression over time, one blue and one black, creating a visual representation of
Free with trial Two lines are representing data progression over time, one blue and one black, creating a visual representation of trends and a key intersection point is marked with a blue circle. Analysis decrease vectors Two lines are representing data progression over time, one blue and one black, creating a visual representation of
Free with trial Economic critical crisis concept. The bar graph with a down arrow on red world map background. Recession financial, cryptocurrency, gold, and the stock market. Losing money and cash. Bearish. Analysis decrease vectors Economic critical crisis concept. The bar graph with a down arrow on red world map background. Recession financial, cryptocurrency
Free with trial Blue calculator and gold coins near downward trending blue graph. Financial loss and budget, calculation concept. Business analytics data. Economic recession illustration. Digital accounting. Analysis decrease illustrations Blue calculator and gold coins near downward trending blue graph. Financial loss and budget calculation concept. Business. Blue calculator and gold coins near downward trending blue graph. Financial loss and budget, calculation concept. Business analytics data. Economic recession illustration. Digital accounting
Free with trial Financial market downturn stock chart arrows falling business decline. Analysis decrease illustrations Visual representation of financial market decline with falling stock charts and downward arrows signifying economic recession. Financial market downturn stock chart arrows falling business decline
Free with trial Downward trend arrow , isolated on white background. Analysis decrease illustrations Downward trend arrow
Free with trial Watercolor illustration shows baby bottle with declining birth rate chart. Concept art about falling population decreasing birth rate statistic. Fewer babies. Modern concept of modern. Analysis decrease illustrations Watercolor illustration shows baby bottle with declining birth rate chart. Concept art about falling population decreasing birth
Free with trial Financial downturn depicted by PDG text on wooden blocks, decreasing coin stacks, and red arrow showing decline, economic recession, and investment loss. Analysis decrease illustrations PDG text on wooden blocks with declining stack of coins and red arrow indicating decrease representing financial downturn. Financial downturn depicted by PDG text on wooden blocks, decreasing coin stacks, and red arrow showing decline, economic recession, and investment loss
Free with trial A three-dimensional chart displaying colorful lines and coin representations illustrates trends in data, highlighting key financial insights and fluctuations over time. Analysis decrease illustrations Trend Analysis with Colorful Graph Lines and Currency Coins Representing Data Points on a Three-Dimensional Chart. A three-dimensional chart displaying colorful lines and coin representations illustrates trends in data, highlighting key financial insights and fluctuations over time
Free with trial The Cost reduction and coins for Business concept 3d rendering. Analysis decrease illustrations The Cost reduction and coins for Business concept 3d rendering
Free with trial The Cost reduction and coins for Business concept 3d rendering. Analysis decrease illustrations The Cost reduction and coins for Business concept 3d rendering
Free with trial The Cost reduction and coins for Business concept 3d rendering. Analysis decrease illustrations The Cost reduction and coins for Business concept 3d rendering
Free with trial The Cost reduction and coins for Business concept 3d rendering. Analysis decrease illustrations The Cost reduction and coins for Business concept 3d rendering
Free with trial The Cost reduction and coins for Business concept 3d rendering. Analysis decrease illustrations The Cost reduction and coins for Business concept 3d rendering
Free with trial The Cost reduction and coins for Business concept 3d rendering. Analysis decrease illustrations The Cost reduction and coins for Business concept 3d rendering
Free with trial This image depicts two contrasting scenarios of the housing market, one showing a positive upward trend and the other a negative downward trend. Analysis decrease illustrations Visual representation of real estate market trends showing both upward and downward fluctuations in housing prices and investment. This image depicts two contrasting scenarios of the housing market, one showing a positive upward trend and the other a negative downward trend
Free with trial The Cost reduction and coins for Business concept 3d rendering. Analysis decrease illustrations The Cost reduction and coins for Business concept 3d rendering
Free with trial The Cost reduction and coins for Business concept 3d rendering. Analysis decrease illustrations The Cost reduction and coins for Business concept 3d rendering
Free with trial Line drawing of a flipchart showing a graph with a downward arrow representing economic downturn. Analysis decrease vectors Flipchart showing arrow graph going down representing financial crisis. Line drawing of a flipchart showing a graph with a downward arrow representing economic downturn
Free with trial The Cost reduction and coins for Business concept 3d rendering. Analysis decrease illustrations The Cost reduction and coins for Business concept 3d rendering
Free with trial The Cost reduction and coins for Business concept 3d rendering. Analysis decrease illustrations The Cost reduction and coins for Business concept 3d rendering
Free with trial The Cost reduction and coins for Business concept 3d rendering. Analysis decrease illustrations The Cost reduction and coins for Business concept 3d rendering
Free with trial The Cost reduction and coins for Business concept 3d rendering. Analysis decrease illustrations The Cost reduction and coins for Business concept 3d rendering
Free with trial Futuristic digital red arrow moving downward showing stock market crash, technology financial loss, and economic recession concept. Generative AI. Analysis decrease illustrations Futuristic digital red arrow moving downward showing stock market crash technology financial loss and economic recession concept
Free with trial Decreasing bar chart icon in generic style. Market crash sign symbol illustration. Analysis decrease vectors Decreasing bar chart icon in generic style. Market crash sign symbol
Free with trial Decline Visualization Dark Blue Background, Vibrant Pink Zigzags, and Yellow Bars Shown as Decreasing ThreeDimensional Cubes with Arrows Indicating the Trend by SD. Analysis decrease illustrations Decline Visualization Dark Blue Background, Vibrant Pink Zigzags, and Yellow Bars Shown as Decreasing ThreeDimensional Cubes with
Free with trial A businessman presents a glowing holographic bar and line graph displaying a peak followed by a sharp financial downturn and market decline. This visual represents economic challenges and risk. Analysis decrease illustrations Business professional holding a glowing financial chart showing a significant market downturn and economic decline in performance. A businessman presents a glowing holographic bar and line graph displaying a peak followed by a sharp financial downturn and market decline. This visual represents economic challenges and risk.
Free with trial A striking image of gold nuggets showcasing wealth and investment potential against a dark backdrop, featuring a financial trend line representing economic growth. Analysis decrease illustrations Gold nuggets on dark surface with financial trend line in background symbolizing wealth, investment, and economic growth concepts. A striking image of gold nuggets showcasing wealth and investment potential against a dark backdrop, featuring a financial trend line representing economic growth
Free with trial Decline Curve A Visual Representation of Increasing Trends Curving Downward and Overcoming Previous Bars Against a Dark Blue Background by SD. Analysis decrease illustrations Decline Curve A Visual Representation of Increasing Trends Curving Downward and Overcoming Previous Bars Against a Dark Blue Backg
Free with trial 3d isometric illustration of a brown paper shopping bag with a downward red arrow, symbolizing negative sales growth. Analysis decrease vectors Isometric brown shopping bag with negative growth arrow. 3d isometric illustration of a brown paper shopping bag with a downward red arrow, symbolizing negative sales growth
Free with trial This illustration portrays money circulation with arrows around a dollar coin, symbolizing financial flow and economic activity in a dynamic system. Analysis decrease vectors Vector art of illustration depicting money circulation with arrows around a dollar coin, representing financial flow and economic. This illustration portrays money circulation with arrows around a dollar coin, symbolizing financial flow and economic activity in a dynamic system
Free with trial This vibrant bar graph displays data trends through colorful segments, ideal for marketing and business presentations. Utilize this minimalistic design for impactful insights. Analysis decrease illustrations Colorful Bar Graph Showing Data Trends with Various Heights and Colors in a Minimalistic Style for Business and Marketing. This vibrant bar graph displays data trends through colorful segments, ideal for marketing and business presentations. Utilize this minimalistic design for impactful insights
Free with trial Curved red down arrow and green up arrow icons for visualizing growth, decline, trends, performance metrics, charts, and financial data. Analysis decrease vectors Curved red down and green up arrows for growth and decline indicators. Curved red down arrow and green up arrow icons for visualizing growth, decline, trends, performance metrics, charts, and financial data
Free with trial The visual depicts a financial bar chart in a minimalist style, showcasing a decline with bars in gradient hues, creating a striking contrast against a dark background. Analysis decrease illustrations A minimalist representation of a collapsing financial bar chart with vibrant colors. The visual depicts a financial bar chart in a minimalist style, showcasing a decline with bars in gradient hues, creating a striking contrast against a dark background.
Free with trial A modern data visualization featuring a line graph and bar chart, ideal for illustrating business trends and performance metrics in reports and presentations. Analysis decrease illustrations Data visualization with a line graph and bar chart representing trends and comparisons in a clear and modern style for business. A modern data visualization featuring a line graph and bar chart, ideal for illustrating business trends and performance metrics in reports and presentations
Free with trial This vibrant line chart illustrates growth and decline trends with colored circles, making it suitable for business presentations, reports, and educational material. Analysis decrease illustrations Colorful Line Chart Showing Growth and Decline Trends with Green, Yellow, and Red Circles Representing Data Points over Time. This vibrant line chart illustrates growth and decline trends with colored circles, making it suitable for business presentations, reports, and educational material
Free with trial This vibrant image features a collection of colorful 3D bar graphs representing data trends, perfect for visualizing statistics in business presentations and analyses. Analysis decrease illustrations Colorful Bar Graph with 3D Shapes Representing Data Trends and Visualizing Statistics in Business and Finance Environments. This vibrant image features a collection of colorful 3D bar graphs representing data trends, perfect for visualizing statistics in business presentations and analyses
Free with trial Wooden blocks display plus minus and percentage symbols representing financial concepts like profit loss interest rates discounts and investment growth used in business education and marketing materi. Analysis decrease illustrations Wooden blocks plus minus percentage math finance investment growth profit loss calculation interest rate discount sale promotion m. Wooden blocks display plus minus and percentage symbols representing financial concepts like profit loss interest rates discounts and investment growth used in business education and marketing materi
Free with trial Isolated red and green arrows for infographics representing economic trends and indicators. Analysis decrease illustrations Isolated red and green arrows for infographics representing economic trends and indicators
Free with trial Colorful bar charts illustrating positive and negative business trends from january to may provide a clear visual representation of performance. Analysis decrease vectors Colorful bar charts illustrating positive and negative business trends from january to may provide a clear visual
Free with trial Colorful bar charts are presenting statistical trends and business performance data across different time periods. Possibly days of the week. Using a vibrant color scheme of blue. Purple. And orange. Analysis decrease illustrations Colorful bar charts are presenting statistical trends and business performance data across different time periods
Free with trial Four colorful bar charts are displayed on a graph, representing trends, statistics, and timeline data, with a potential focus on business infographics elements. Analysis decrease illustrations Four colorful bar charts are displayed on a graph, representing trends, statistics, and timeline data, with a potential
Free with trial Economic critical crisis concept. The down arrow on red world map background. Recession financial, cryptocurrency, gold, and the stock market. Losing money and cash. Bearish. Analysis decrease vectors Economic critical crisis concept. The down arrow on red world map background. Recession financial, cryptocurrency, gold, and the
Free with trial Market Downturn Red candlestick chart on a grid background with metallic cylinder accents. Depth of field effect. Stock photo. Analysis decrease illustrations Market Downturn Red candlestick chart on a grid background with metallic cylinder accents. Depth of field effect
Free with trial A clean, minimalist bar chart displays a gradual decline in financial performance, with rising bars depicted in soft blue against a serene teal background. Analysis decrease illustrations Minimalist financial bar chart illustrating gradual decline in economic performance. A clean, minimalist bar chart displays a gradual decline in financial performance, with rising bars depicted in soft blue against a serene teal background.
Free with trial This image features colorful 3D bar graphs representing both growth and decline trends, ideal for business analytics and financial performance visualizations. Analysis decrease illustrations Colorful 3D Bar Graphs Displaying Growth and Decline Trends in Business Analytics and Financial Performance on a Clean White. This image features colorful 3D bar graphs representing both growth and decline trends, ideal for business analytics and financial performance visualizations
Free with trial A laconic, simple infographic showing the fall of the Ethereum on the stock exchange. Analysis decrease illustrations Abstract infographic of falling Ethereum exchange rate. A laconic, simple infographic showing the fall of the Ethereum on the stock exchange.
Free with trial This abstract data visualization features smooth blue waves representing trends and fluctuations, ideal for business reports, finance presentations, and analytical insights. Analysis decrease illustrations Abstract Blue Data Visualization Depicting Trends and Fluctuations in Graphical Format for Business and Finance Presentations. This abstract data visualization features smooth blue waves representing trends and fluctuations, ideal for business reports, finance presentations, and analytical insights
Free with trial Dynamic red and blue stock market graph with data points and financial charts on a dark background. Generative AI. Analysis decrease illustrations Dynamic red and blue stock market graph with data points and financial charts on a dark background
Free with trial Intersecting colorful lines trending up and down across a graph illustrate weekly progress from monday to sunday, capturing fluctuations in performance over time. Analysis decrease illustrations Intersecting colorful lines trending up and down across a graph illustrate weekly progress from monday to sunday
Free with trial A layered arrangement of dark wooden blocks displaying decreasing red and tan bars, with a downward arrow illustrating a downturn in financial or market performance. Analysis decrease illustrations Stacked black wooden cubes with red and tan descending bar charts and downward arrow symbolizing financial or business decline. A layered arrangement of dark wooden blocks displaying decreasing red and tan bars, with a downward arrow illustrating a downturn in financial or market performance
Free with trial Data analytics descending line graphic outline icon in white and black colors. data analytics descending line graphic flat vector icon from business collection for web, mobile apps and ui. Analysis decrease vectors Data analytics descending line graphic outline icon in white and black colors. data analytics descending line graphic flat vector
Free with trial Vector illustration of a graph with a downward arrow, representing decline or negative growth. Analysis decrease vectors Professional Graph with Arrow Down Outline Icon Vector Illustration. Vector illustration of a graph with a downward arrow, representing decline or negative growth.
Free with trial Red COST label on circular tag rests on wooden surface, chalkboard background Generative AI. Analysis decrease illustrations Red COST label on circular tag rests on wooden surface, chalkboard background
Free with trial Blue graph chart is visually representing growth, decline, and subsequent recovery, with two key points highlighted by purple circles and a red arrow indicating a temporary dip. Analysis decrease illustrations Blue graph chart is visually representing growth, decline, and subsequent recovery, with two key points highlighted by
Free with trial Blue graph chart is visually representing growth, decline, and subsequent recovery, with two key points highlighted by purple circles and a red arrow indicating a temporary dip. Analysis decrease vectors Blue graph chart is visually representing growth, decline, and subsequent recovery, with two key points highlighted by
Free with trial Vibrant and colorful bar chart illustrating various data metrics, perfect for business or marketing use, highlighting trends and insights visually engaging for audiences. Analysis decrease illustrations Colorful Bar Chart Showing Data Variations in a Bright and Engaging Style Suitable for Business Presentations or Marketing. Vibrant and colorful bar chart illustrating various data metrics, perfect for business or marketing use, highlighting trends and insights visually engaging for audiences
Free with trial This vibrant bar graph showcases varying heights for data visualization, perfect for representing trends in finance or business analysis against a clean white background. Analysis decrease illustrations Colorful Bar Graph with Varying Heights Representing Data Trends and Insights in a Minimalist Art Style on White Background. This vibrant bar graph showcases varying heights for data visualization, perfect for representing trends in finance or business analysis against a clean white background
Free with trial A vibrant 3D bar graph illustration shows financial growth trends with colorful bars. Perfect for business presentations, analytics, and creative projects. Analysis decrease illustrations Colorful 3D bar graph illustration depicting financial growth and performance trends with vibrant hues and clean modern design for. A vibrant 3D bar graph illustration shows financial growth trends with colorful bars. Perfect for business presentations, analytics, and creative projects
Free with trial A visually appealing line graph illustrates data fluctuations and trends over time. The minimalist design makes it suitable for presentations and reports in various fields. Analysis decrease illustrations Line graph depicting data trends with fluctuations and peaks over time in a minimalist style, showcasing analytical insights and. A visually appealing line graph illustrates data fluctuations and trends over time. The minimalist design makes it suitable for presentations and reports in various fields
Free with trial Colorful bar charts illustrating positive and negative business trends from january to may provide a clear visual representation of performance. Analysis decrease illustrations Colorful bar charts illustrating positive and negative business trends from january to may provide a clear visual
Free with trial Exploring property loan interest rates for buying homes a detailed review with t bbfc in natural settings generative ai illustration. Analysis decrease illustrations Exploring property loan interest rates for buying homes a detailed review with t bbfc in natural settings
Free with trial Colorful horizontal bar chart is displaying monthly statistics from january to may, indicating trends and performance with a speech bubble above. Analysis decrease vectors Colorful horizontal bar chart is displaying monthly statistics from january to may, indicating trends and performance
Free with trial Percentage sign with downward red and white arrows, financial decline, economic downturn, minimalist design, dark background, 3D render, market crash. Analysis decrease illustrations Percentage sign with downward red and white arrows, financial decline