Free with trial 3d man analyzing bar chart, a visual representation of growth, business performance, and investment strategy ,Generative ai. Analysis decrease illustrations 3d man analyzing bar chart, a visual representation of growth, business performance, and investment strategy
Free with trial A downward trending red arrow crosses a series of blue bars, visually representing a sharp financial decline and negative business performance. Analysis decrease illustrations Red arrow declining over blue bar chart symbolizing financial loss and downturn isolated on white background. A downward trending red arrow crosses a series of blue bars, visually representing a sharp financial decline and negative business performance
Free with trial Bar graph depicting a decline, representing economic downturn, stock market decline, and company insolvency with a dropping red arrow. Analysis decrease vectors Bar chart illustrating a downward trend, symbolizing financial loss, market crash, and business failure with a falling red arrow. Bar graph depicting a decline, representing economic downturn, stock market decline, and company insolvency with a dropping red arrow
Free with trial Candlestick Chart and Speech Bubble vector Cryptocurrency Trading concept colored icon or symbol. Analysis decrease illustrations Candlestick Chart and Speech Bubble vector Cryptocurrency Trading colored icon or symbol
Free with trial Crypto Triangle Pattern vector Red and Green Candlesticks concept colored icon or design element. Analysis decrease illustrations Crypto Triangle Pattern vector Red and Green Candlesticks colored icon or design element
Free with trial Investment analyst analyzing stock market crash ,financial warning signals with bearish chart ,digital alert interface ,economic downturn, volatile market conditions, urgent investment risk assessment. Analysis decrease illustrations Investment analyst analyzing stock market crash ,financial warning signals with bearish chart ,digital alert interface ,economic
Free with trial A collection of silver bars arranged in perspective with a green line graph superimposed over them, suggesting a rising trend. The bars are reflective and metallic, representing financial concepts related to silver investments. The image conveys notions of value appreciation and economic analysis. Analysis decrease illustrations Silver bars with a green line graph. a rising trend in the price or value of silver. financial concepts design element. A collection of silver bars arranged in perspective with a green line graph superimposed over them, suggesting a rising trend. The bars are reflective and metallic, representing financial concepts related to silver investments. The image conveys notions of value appreciation and economic analysis.
Free with trial This image shows a simple black icon made up of a globe with clear latitude and longitude lines, a downward pointing arrow angled toward the globe, and a dollar symbol placed inside a circle beside it. The combination of these elements suggests a shift in financial conditions that affect activity across different regions. The downward arrow introduces the idea of reduced movement, lower value, or slowing economic flow, while the globe hints at broad geographic reach. The dollar symbol adds a monetary focus, making the overall theme relate to changes in financial patterns or adjustments in international transactions. The clean design keeps attention on the shapes and their meaning without adding extra detail. This type of icon can be used in discussions about shifting markets, global cost changes, or the influence of external factors on financial outcomes. It also works well in presentations or reports that need a clear visual to represent financial movement across borders. The straightforward layout helps viewers quickly understand the concept being communicated. Analysis decrease illustrations Global icon with downward arrow and dollar symbol indicating reduced international financial activity. This image shows a simple black icon made up of a globe with clear latitude and longitude lines, a downward pointing arrow angled toward the globe, and a dollar symbol placed inside a circle beside it. The combination of these elements suggests a shift in financial conditions that affect activity across different regions. The downward arrow introduces the idea of reduced movement, lower value, or slowing economic flow, while the globe hints at broad geographic reach. The dollar symbol adds a monetary focus, making the overall theme relate to changes in financial patterns or adjustments in international transactions. The clean design keeps attention on the shapes and their meaning without adding extra detail. This type of icon can be used in discussions about shifting markets, global cost changes, or the influence of external factors on financial outcomes. It also works well in presentations or reports that need a clear visual to represent financial movement across borders. The straightforward layout helps viewers quickly understand the concept being communicated.
Free with trial This abstract image represents detailed data visualization of financial market trends featuring line graphs and bar charts on a dark backdrop. Analysis decrease illustrations Abstract Data Visualization of Financial Market Trends with Line Graph and Bar Chart on Dark Background. This abstract image represents detailed data visualization of financial market trends featuring line graphs and bar charts on a dark backdrop
Free with trial This clean studio shot illustrates a workplace safety management concept using four wooden blocks. The blocks feature icons representing hard hats, a downward trending graph labeled 'ACCIDENTS,' and a shield with a checkmark, symbolizing successful accident prevention and worker protection. It's ideal for themes related to occupational health, risk management, and industrial safety protocols. Analysis decrease illustrations Workplace Safety Management Concept. Hard Hat, Accident Reduction Graph, and Shield Icons on Wooden Blocks. This clean studio shot illustrates a workplace safety management concept using four wooden blocks. The blocks feature icons representing hard hats, a downward trending graph labeled 'ACCIDENTS,' and a shield with a checkmark, symbolizing successful accident prevention and worker protection. It's ideal for themes related to occupational health, risk management, and industrial safety protocols.
Free with trial A line graph displays two curves, one in green and one in red, indicating fluctuations in data over a set. Analysis decrease illustrations Graph showing statistical trends with positive and negative fluctuations over time in a simple line format. A line graph displays two curves, one in green and one in red, indicating fluctuations in data over a set
Free with trial Minimalist flat design illustration shows a graph declining with a dollar symbol, depicting financial losses or a downturn, with a black background. Analysis decrease vectors Declining Business Finances: Abstract Chart and Dollar Coin Illustration Showing Economic Downturn. Minimalist flat design illustration shows a graph declining with a dollar symbol, depicting financial losses or a downturn, with a black background.
Free with trial Bright yellow percentage symbol stands tall against a clean white background, utilized often in promotional contexts to signify discounts or special offers effectively. Analysis decrease illustrations Yellow percentage symbol on a clean background emphasizes discounts in marketing materials accurately. Bright yellow percentage symbol stands tall against a clean white background, utilized often in promotional contexts to signify discounts or special offers effectively
Free with trial Computer screen displaying a red arrow trending down, representing economic decline. Analysis decrease illustrations Computer showing red downward trend on blue background. Computer screen displaying a red arrow trending down, representing economic decline
Free with trial A hand touches a bright blue glowing graph on a dark digital screen, showing a downward trend with an arrow. Analysis decrease illustrations Hand touching glowing downward trending graph on digital screen. A hand touches a bright blue glowing graph on a dark digital screen, showing a downward trend with an arrow
Free with trial Minimalist icon of a falling bar chart showing a negative market trend. Analysis decrease vectors Negative market trend shown on graph with falling bar chart. Minimalist icon of a falling bar chart showing a negative market trend
Free with trial Line art business graphs set featuring financial growth and decline with dollar signs for economic performance. Analysis decrease vectors Line art business graphs set featuring financial growth and decline with dollar signs for economic performance
Free with trial A digital graphic depicting a financial chart with two prominent line graphs. A blue line trends upward, representing a rising stock price, while a red line trends downward, indicating a decrease in trading volume. The chart is set against a faint, blurred city background, featuring a grid system on the vertical axis labeled 'Volume' and a horizontal axis labeled 'Time', with a red arrow at the. Analysis decrease illustrations A financial line chart showing the inverse relationship between stock price and trading volume data. A digital graphic depicting a financial chart with two prominent line graphs. A blue line trends upward, representing a rising stock price, while a red line trends downward, indicating a decrease in trading volume. The chart is set against a faint, blurred city background, featuring a grid system on the vertical axis labeled 'Volume' and a horizontal axis labeled 'Time', with a red arrow at the
Free with trial A red neon arrow points downwards over a bar graph, symbolizing a stock market crash and economic recession. This image represents financial loss and investment decline in a crisis situation. Analysis decrease illustrations Stock market crash economic recession financial crisis investment loss chart decline red arrow downtrend. a red neon arrow points downwards over a bar graph, symbolizing a stock market crash and economic recession. This image represents financial loss and investment decline in a crisis situation.
Free with trial Red arrow indicates financial market decline. Bearish trend illustrated over chart of falling stock prices. Economic instability concept, representing losses, recession, crisis. Analysis decrease illustrations Red arrow indicates financial market decline. Bearish trend illustrated over chart of falling stock prices. Economic instability
Free with trial Abstract NFT Digital Trading Image in the downtrend Descending from the highest point on the background for entering text. Analysis decrease vectors Abstract NFT Digital Trading Image in the downtrend Descending
Free with trial Red zigzag arrow representing economic downturn rests on a white surface, surrounded by scattered red glitter, featuring a clean composition and high key lighting. Analysis decrease illustrations Red zigzag arrow graph symbolizing economic decline on a white background with scattered red glitter, minimalistic financial. Red zigzag arrow representing economic downturn rests on a white surface, surrounded by scattered red glitter, featuring a clean composition and high key lighting
Free with trial Collagen production in women based on age. Medical, healthcare infographics. Important information. Menopause problem. Editable vector illustration isolated on a white background. Horizontal banner. Analysis decrease vectors Collagen production in women based on age.
Free with trial Visualizing india's economic downturn with a declining graph on the country's map. it represents a financial crisis, market crash, and recession, showing a downward trend and economic challenges ahead. Analysis decrease illustrations India economy recession concept showing financial crisis and market crash with declining graph chart data. visualizing india's economic downturn with a declining graph on the country's map. it represents a financial crisis, market crash, and recession, showing a downward trend and economic challenges ahead.
Free with trial Conceptual image showing a declining financial graph on a hand, symbolizing business economy crisis, investment loss, or market crash. It represents negative growth and economic downturn. Analysis decrease illustrations Declining financial graph on hand concept for business economy crisis or investment loss and market crash. conceptual image showing a declining financial graph on a hand, symbolizing business economy crisis, investment loss, or market crash. It represents negative growth and economic downturn.
Free with trial This captivating abstract image showcases a glowing digital graph illustrating financial trends and statistical patterns, ideal for technology and business themes. Analysis decrease illustrations Abstract Digital Financial Graph with Glowing Lines and Data Points Representing Statistics and Market Trends. This captivating abstract image showcases a glowing digital graph illustrating financial trends and statistical patterns, ideal for technology and business themes
Free with trial A dynamic visual depicting various international currency symbols, including dollar, euro, and yen, cascading into a prominent red downward arrow labeled Cost, illustrating the concept of cost reduction and financial savings. Analysis decrease illustrations Global Currency Symbols Flowing into a Red Downward Arrow with Cost Text, Representing Financial Reduction. A dynamic visual depicting various international currency symbols, including dollar, euro, and yen, cascading into a prominent red downward arrow labeled Cost, illustrating the concept of cost reduction and financial savings
Free with trial Professional image of a hand lowering wooden blocks spelling 'COST' with a glowing red down arrow, symbolizing expense reduction and financial efficiency in business. Analysis decrease illustrations Hand adjusting wooden cost blocks with red down arrow for financial savings and business strategy concept. Professional image of a hand lowering wooden blocks spelling 'COST' with a glowing red down arrow, symbolizing expense reduction and financial efficiency in business.
Free with trial The image depicts a financial chart displaying price movements over time. It features candlestick bars in blue and yellow, indicating price changes, with a red line representing a moving average. The x-axis represents time, while the y-axis represents price. Analysis decrease illustrations A detailed financial chart showing price movements over time with candlestick bars and moving average line. The image depicts a financial chart displaying price movements over time. It features candlestick bars in blue and yellow, indicating price changes, with a red line representing a moving average. The x-axis represents time, while the y-axis represents price
Free with trial A red stock market chart displayed on a laptop screen, indicating a crash. The keyboard is visible, suggesting active trading during the downturn. Analysis decrease illustrations Red stock market crash data finance graph chart keyboard computer technology business investment loss risk. A red stock market chart displayed on a laptop screen, indicating a crash. The keyboard is visible, suggesting active trading during the downturn.
Free with trial A striking 3D rendering depicts a red arrow dramatically falling over financial charts and graphs symbolizing a market downturn or economic decline Ideal for illustrating concepts of financial loss and economic crisis. Analysis decrease illustrations Dramatic Red 3D Arrow Plunging Downward on Financial Charts and Graphs Showing Market Decline AI generated. A striking 3D rendering depicts a red arrow dramatically falling over financial charts and graphs symbolizing a market downturn or economic decline Ideal for illustrating concepts of financial loss and economic crisis
Free with trial Black hand-drawn downward arrow indicating business decline and economic downturn on a textured white background. Financial crisis concept. Analysis decrease illustrations Black hand-drawn downward arrow indicating business decline and economic downturn on a textured white background
Free with trial Candlestick Chart and Speech Bubble vector Cryptocurrency Trading concept colored seamless pattern. Analysis decrease illustrations Candlestick Chart and Speech Bubble vector Cryptocurrency Trading colored seamless pattern
Free with trial A vivid red stock market bar chart decline is displayed against a dark background. This image conveys a financial crisis or market downturn concept. Analysis decrease illustrations Red Financial Stock Market Crash with Bar Chart Decline in Dark Background Concept. A vivid red stock market bar chart decline is displayed against a dark background. This image conveys a financial crisis or market downturn concept
Free with trial A red financial graph with a descending trend indicates a stock market decline and bearish trends. The digital chart displays negative data, symbolizing loss and potential economic crisis. Analysis decrease illustrations Red Stock Market Financial Graph Demonstrating Bearish Market Decline and Negative Trends. A red financial graph with a descending trend indicates a stock market decline and bearish trends. The digital chart displays negative data, symbolizing loss and potential economic crisis
Free with trial Financial percentage reduction cycle icon with downward arrow showing decreased value and continuous process. Analysis decrease vectors Financial percentage reduction cycle icon with downward arrow showing decreased value and continuous process
Free with trial Close-up image of a red arrow pointing downwards dramatically positioned on financial charts and graphs illustrating a negative market trend representing economic decline or recession Ideal for illustrating financial loss or economic crisis. Analysis decrease illustrations Red Arrow Pointing Down on Financial Charts and Graphs Showing Market Decline Economic Crisis AI generated. Close-up image of a red arrow pointing downwards dramatically positioned on financial charts and graphs illustrating a negative market trend representing economic decline or recession Ideal for illustrating financial loss or economic crisis
Free with trial Four distinct 3D graphs illustrating different data trends and representations, featuring upward and downward movements. Analysis decrease illustrations Collection of 3d graphs showing various trends and data representations isolated on transparent background. Four distinct 3D graphs illustrating different data trends and representations, featuring upward and downward movements
Free with trial Line drawing of a flipchart showing a decreasing graph, illustrating negative business results. Analysis decrease vectors Flipchart with decreasing graph presenting business results. Line drawing of a flipchart showing a decreasing graph, illustrating negative business results
Free with trial Stylized vector graphic featuring an upward arrow and percentage sign, connected by lines, demonstrating rising performance and decreasing rates against a dark background. Analysis decrease vectors Rising Performance and Decreasing Costs: Stylized Arrow and Percentage Icons Illustrating Financial Trends. Stylized vector graphic featuring an upward arrow and percentage sign, connected by lines, demonstrating rising performance and decreasing rates against a dark background.
Free with trial Black and white icon of a statistical chart representing unemployed people applying for an open job position. Analysis decrease vectors Statistical chart showing unemployed people applying for job. Black and white icon of a statistical chart representing unemployed people applying for an open job position
Free with trial Stylized graphics depict market trends with up and down arrows. Flat design with simple shapes for business and financial presentations. Analysis decrease vectors Stylized infographics illustrating growth and decline with upward and downward arrows on black background. Stylized graphics depict market trends with up and down arrows. Flat design with simple shapes for business and financial presentations.
Free with trial The image showcases a dynamic circular arrangement of percentage symbols in varying sizes and colors. Each symbol includes a positive or negative indicator, emphasizing the duality of increases and decreases. The design is visually striking, with black and red colors dominating the composition, and it appears to be used for illustrating financial metrics, statistical data, or performance. Analysis decrease illustrations Creative illustration of percentage signs in a circular arrangement with positive and negative indicators. The image showcases a dynamic circular arrangement of percentage symbols in varying sizes and colors. Each symbol includes a positive or negative indicator, emphasizing the duality of increases and decreases. The design is visually striking, with black and red colors dominating the composition, and it appears to be used for illustrating financial metrics, statistical data, or performance
Free with trial Bold illustration of financial market trends depicting monetary growth and decline for business and investment concepts. Analysis decrease vectors Bold illustration of financial market trends depicting monetary growth and decline for business and investment concepts
Free with trial A hopeful medical technology science displays weight loss and glucose level data charts showing healthcare progress with syringe. Analysis decrease illustrations Hopeful medical technology science displays weight loss and glucose level data charts showing healthcare progress with syringe
Free with trial Collagen production in women based on age. Medical, healthcare infographics. Important information. Menopause problem. Editable vector illustration isolated on a white background. Horizontal banner. Analysis decrease vectors Collagen production in women based on age.
Free with trial Concept of economic collapse by falling graph, chart, highlighting global recession fueled by inflation, stock market crash, financial crisis, falling income, GDP decline, capital reduction. Analysis decrease illustrations Concept of economic collapse by falling graph, chart, highlighting global recession fueled by inflation, stock market crash
Free with trial A visual representation of a downward trend in finance or business. The graphic features a series of descending blue bars accompanied by a sharp red arrow signifying a decline. Analysis decrease illustrations Financial decline graph with red arrow indicating downtrend and decreasing bars isolated on white background. A visual representation of a downward trend in finance or business. The graphic features a series of descending blue bars accompanied by a sharp red arrow signifying a decline
Free with trial A red arrow points down over a bar graph, symbolizing a stock market crash, recession, or financial crisis. This image conveys economic downturn, investment loss, and business failure in a clear visual manner. Analysis decrease illustrations Stock market crash recession chart financial crisis economic downturn investment loss business failure graph. a red arrow points down over a bar graph, symbolizing a stock market crash, recession, or financial crisis. This image conveys economic downturn, investment loss, and business failure in a clear visual manner.
Free with trial Vibrant data visualization featuring bar and line graphs, sun icon, and descending trend lines against a stark black background in a flat style. Analysis decrease vectors Colorful data visualization with bar graphs, line graph, sun icon, and descending trends on a black background. Vibrant data visualization featuring bar and line graphs, sun icon, and descending trend lines against a stark black background in a flat style.
Free with trial Outdoor thermometer weather measurement low temperature heat indicator outdoor, forecast, cool, minus, negative, climate. Analysis decrease vectors Thermometer showing 18.5 degrees Celsius with downward arrow indicating cold temperature and decrease concept. Outdoor thermometer weather measurement low. Outdoor thermometer weather measurement low temperature heat indicator outdoor, forecast, cool, minus, negative, climate
Free with trial Weather thermometer cold climate temperature reading decrease symbol freezing frost, outdoor,. Analysis decrease vectors Red and white thermometer with blue downward arrow showing low temperature for cold weather or freezing point. Weather thermometer cold climate temperature reading decrease symbol freezing frost, outdoor,
Free with trial Concept of economic collapse by falling graph, chart, highlighting global recession fueled by inflation, stock market crash, financial crisis, falling income, GDP decline, capital reduction. Analysis decrease illustrations Concept of economic collapse by falling graph, chart, highlighting global recession fueled by inflation, stock market crash
Free with trial This image depicts a sharp decrease in wealth and investment value illustrated by tumbling currency alongside a plummeting chart signifying market instability. Analysis decrease illustrations A dramatic financial downturn with falling gold coins and declining market graph representing economic recession. This image depicts a sharp decrease in wealth and investment value illustrated by tumbling currency alongside a plummeting chart signifying market instability
Free with trial A striking image depicting a large red downward arrow dramatically positioned over financial charts This illustrates market downturn economic recession or financial crisis visually Ideal for articles and presentations concerning economic hardship. Analysis decrease illustrations Dramatic Red Down Arrow on Financial Charts Showing Market Decline Recession and Economic Crisis AI generated. A striking image depicting a large red downward arrow dramatically positioned over financial charts This illustrates market downturn economic recession or financial crisis visually Ideal for articles and presentations concerning economic hardship
Free with trial Image depicting a downward trend in business costs, visualized with wooden blocks spelling 'COST' and a falling graph. Analysis decrease illustrations Decreasing Business Costs: Financial Strategy and Economic Downturn Impact on Expenses. Image depicting a downward trend in business costs, visualized with wooden blocks spelling 'COST' and a falling graph
Free with trial Red financial chart arrow plunging downward over a city skyline engulfed in fog, symbolizing economic recession and market crash. Analysis decrease illustrations Red financial chart arrow plunging downward over a city skyline engulfed in fog, symbolizing economic recession
Free with trial A visual representation of a financial downturn. A hand places a downward pointing arrow on a graph showing a decline. Symbolizes economic recession, investment loss, and business failure. Analysis decrease illustrations Stock market crash financial crisis investment loss business failure economic recession downtrend graph chart. A visual representation of a financial downturn. A hand places a downward pointing arrow on a graph showing a decline. Symbolizes economic recession, investment loss, and business failure.
Free with trial Visual representation of a sharp economic downturn. Red bars and declining graphs depict financial loss and market crash. Represents recession, investment risk, and a negative economic trend. Analysis decrease illustrations Stock market crash chart financial crisis economic recession investment loss downtrend graph red bars decline. Visual representation of a sharp economic downturn. Red bars and declining graphs depict financial loss and market crash. Represents recession, investment risk, and a negative economic trend.
Free with trial Dynamic grid of fluctuating stock prices and financial data with columns and rows showing the volatile market changes in green and red creating a high-tech abstract visualization. Analysis decrease illustrations Abstract data visualization of stock market prices and financial data in rows and columns with price changes in green and red. Dynamic grid of fluctuating stock prices and financial data with columns and rows showing the volatile market changes in green and red creating a high-tech abstract visualization
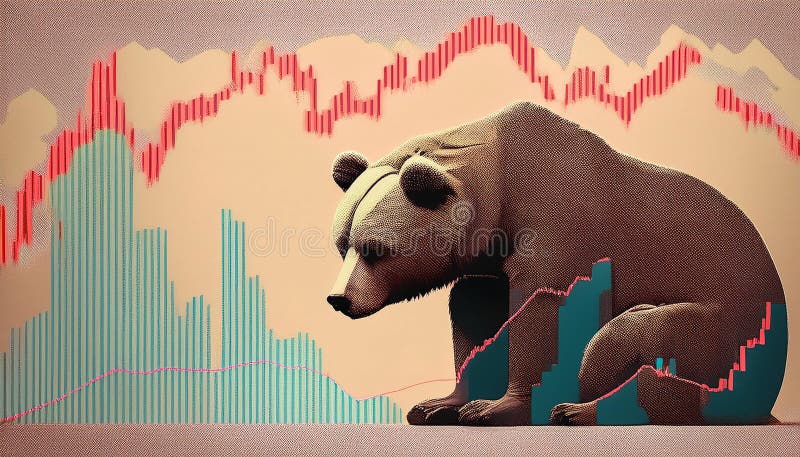
Free with trial Bad stock market chart and sad bear. Analysis decrease illustrations Bad stock market chart and sad bear
Free with trial Illustration symbolizing economic decline with a descending bar graph and dollar sign. Analysis decrease vectors Economic downturn concept with bar chart. Illustration symbolizing economic decline with a descending bar graph and dollar sign
Free with trial A line art illustration shows a bar graph with arrows and a star on a purple background. It represents business growth, success, and achievement of goals. Analysis decrease vectors Vector art of line art illustration of a bar graph with arrows and a star on a purple background business growth concept. A line art illustration shows a bar graph with arrows and a star on a purple background. It represents business growth, success, and achievement of goals
Free with trial This image illustrates an economic downturn with a purple graph, downward arrow, and dollar sign, symbolizing financial crisis and market decline in a visual manner. Analysis decrease vectors Vector art of purple graph with a downward arrow and a dollar sign, indicating economic decline and financial crisis. This image illustrates an economic downturn with a purple graph, downward arrow, and dollar sign, symbolizing financial crisis and market decline in a visual manner
Free with trial Dollar sign up and down arrow icon logo sign vector outline in black and white color. Analysis decrease vectors Dollar sign up and down arrow icon logo sign vector outline
Free with trial Flat style 2D illustration A diverse team collaborates to analyze a large screen displaying a Bounce Rate chart with a downward trend indicating successful performance improvement efforts. Analysis decrease vectors Business Team Analyzing Decreasing Bounce Rate Chart for Website Optimization Strategy Flat style 2D illustration. Flat style 2D illustration A diverse team collaborates to analyze a large screen displaying a Bounce Rate chart with a downward trend indicating successful performance improvement efforts.
Free with trial A hand with the index finger extended and a glowing blue light on the fingertip surrounded by various blue percentage symbols and arrows on a white background. Analysis decrease illustrations A hand with a glowing blue light and percentage symbols floating around isolated on transparent background, isolated on white. a hand with the index finger extended and a glowing blue light on the fingertip surrounded by various blue percentage symbols and arrows on a white background
Free with trial Stacked coins increase in height with wooden blocks spelling "COST," beside a red arrow pointing left, symbolizing cost reduction or decreasing expenses. Analysis decrease illustrations Coins increase in height with wooden blocks spelling \'COST,\' beside a red arrow pointing left, cost reduction. Stacked coins increase in height with wooden blocks spelling "COST," beside a red arrow pointing left, symbolizing cost reduction or decreasing expenses.
Free with trial A series of wooden cylinders with percentage signs on them, arranged in descending order of height, accompanied by a red arrow trending downwards, indicating a decline in percentage values. Analysis decrease illustrations A visual representation of decreasing percentage values over time, symbolizing a downward trend in financial data. A series of wooden cylinders with percentage signs on them, arranged in descending order of height, accompanied by a red arrow trending downwards, indicating a decline in percentage values
Free with trial Concept of economic collapse by falling graph, chart, highlighting global recession fueled by inflation, stock market crash, financial crisis, falling income, GDP decline, capital reduction. Analysis decrease illustrations Concept of economic collapse by falling graph, chart, highlighting global recession fueled by inflation, stock market crash
Free with trial Financial report with a declining bar graph, suggesting a negative trend in business performance. Analysis decrease vectors Financial report showing declining bar graph and statistics. Financial report with a declining bar graph, suggesting a negative trend in business performance
Free with trial Smartphone is displaying a simple line graph that is decreasing, suggesting negative performance. Analysis decrease vectors Smartphone showing decreasing bar graph icon vector outline. Smartphone is displaying a simple line graph that is decreasing, suggesting negative performance
Free with trial The red futuristic with a neon lights background. Hi-tech backdrop. Generative AI. Analysis decrease illustrations The red futuristic with a neon lights background. Hi-tech backdrop. Generative AI
Free with trial Red arrow graph drop arrow down Money losing. Stock crisis finance icon neon glow vector illustration concept. Analysis decrease vectors Red arrow graph drop arrow down Money losing. Stock crisis finance icon neon glow concept. Red arrow graph drop arrow down Money losing. Stock crisis finance icon neon glow vector illustration concept
Free with trial Green up and red down 3d arrow graph showing rising, descending trend, business result, profit or loss symbol symbol. Business arrow, goals concept. 3d world money symbols. Financial growth vector isolated. Analysis decrease vectors Green up and red down 3d arrow graph showing rising, descending trend, business result, profit. world money symbols. Green up and red down 3d arrow graph showing rising, descending trend, business result, profit or loss symbol symbol. Business arrow, goals concept. 3d world money symbols. Financial growth vector isolated
Free with trial Green up and red down 3d arrow graph showing rising, descending trend, business result, profit or loss symbol symbol. Business arrow, goals concept. 3d world money symbols. Financial growth vector isolated. Analysis decrease vectors Green up and red down 3d arrow graph showing rising, descending trend, business result, profit. world money symbols. Green up and red down 3d arrow graph showing rising, descending trend, business result, profit or loss symbol symbol. Business arrow, goals concept. 3d world money symbols. Financial growth vector isolated