Free with trial Percentage sign with downward red and white arrows, financial decline, economic downturn, minimalist design, dark background, 3D render, market crash. Analysis decrease illustrations Percentage sign with downward red and white arrows, financial decline
Free with trial Up and down trend with graph isolated on dark background. Falling and rising graph with buy and sell buttons. Stock exchange concept. Trader profit and loss. Vector illustration. Analysis decrease vectors Up and down trend with graph isolated on dark background. Falling and rising graph with buy and sell buttons. Stock exchange
Free with trial Red And Yellow Lines Trending Upwards On A Line Graph. Business, Finance, Investment Concept, Generated by AI. Analysis decrease illustrations Red And Yellow Lines Trending Upwards On A Line Graph. Business, Finance, Investment Concept
Free with trial Percentage sign with downward red and white arrows, financial decline, economic downturn, minimalist design, dark background, 3D render, market crash. Analysis decrease illustrations Percentage sign with downward red and white arrows, financial decline
Free with trial Percentage sign with downward red and white arrows, financial decline, economic downturn, minimalist design, dark background, 3D render, market crash. Analysis decrease illustrations Percentage sign with downward red and white arrows, financial decline
Free with trial This vibrant line graph showcases multiple data series, illustrating trends and fluctuations over time with a clear light grid background, perfect for reports. Analysis decrease illustrations Colorful Line Graph Representing Data Trends Over Time with Multiple Data Series and Fluctuating Values on a Light Grid Background. This vibrant line graph. This vibrant line graph showcases multiple data series, illustrating trends and fluctuations over time with a clear light grid background, perfect for reports
Free with trial Two colorful lines are representing data points over time, creating a visual representation of trends and fluctuations, with a highlighted period marked in red. Analysis decrease vectors Two colorful lines are representing data points over time, creating a visual representation of trends and fluctuations
Free with trial This abstract financial stock market trading chart with a gold arrow downtrend on a blue background conveys the concept of market volatility and uncertainty. The downward trend of the gold arrow symbolizes a decrease in stock prices or economic instability. The blue background may represent calmness or trust in the financial system despite the fluctuations. This image captures the essence of the dynamic nature of the stock market and the importance of monitoring trends for successful trading strategies. Analysis decrease illustrations Abstract Financial Stock Market Trading Chart with Gold Arrow Downtrend on Blue Background. This abstract financial stock market trading chart with a gold arrow downtrend on a blue background conveys the concept of market volatility and uncertainty. The downward trend of the gold arrow symbolizes a decrease in stock prices or economic instability. The blue background may represent calmness or trust in the financial system despite the fluctuations. This image captures the essence of the dynamic nature of the stock market and the importance of monitoring trends for successful trading strategies.
Free with trial These clean, isolated upward and downward green and red arrows are ideal for illustrating various data visualization concepts. Perfect for presentations, reports, infographics, and marketing materials, they effectively communicate growth and decline trends in business, finance, or any field requiring visual representation of progress. The simple, modern design ensures the focus remains on the. Analysis decrease illustrations Simple Green and Red Arrows Isolated Vector Graphics for Visualizing Growth and Decline Trends in Business Data. These clean, isolated upward and downward green and red arrows are ideal for illustrating various data visualization concepts. Perfect for presentations, reports, infographics, and marketing materials, they effectively communicate growth and decline trends in business, finance, or any field requiring visual representation of progress. The simple, modern design ensures the focus remains on the
Free with trial Graph depicting 3D line and bar data visualization in red, white background, financial trends concept. Analysis decrease illustrations Graph showing 3D line and bar data visualization in red, white background, financial trends concept
Free with trial Magnifying glass showing falling dollar currency value with red downward arrow for finance and business concepts. Analysis decrease vectors Magnifying glass showing falling dollar currency value with red downward arrow
Free with trial Small house sits on pile of coins. Yellow arrow graph shows sharp fall. Night cityscape background suggests economic downturn financial crisis. Analysis decrease illustrations Small house sits on pile of coins. Yellow arrow graph shows sharp fall. Night cityscape background suggests economic downturn
Free with trial This vibrant 3D bar graph showcases data trends with a colorful aesthetic, perfect for presentations in business, finance, or technology sectors emphasizing analytics. Analysis decrease illustrations Colorful Bar Graph Visualization of Data Trends in Modern Business Environment with 3D Perspective and Vibrant Gradient Colors. This vibrant 3D bar graph showcases data trends with a colorful aesthetic, perfect for presentations in business, finance, or technology sectors emphasizing analytics
Free with trial The visualization displays a collapsing financial bar chart, illustrating a significant decrease in financial metrics with a clean, minimalist aesthetic. Analysis decrease illustrations Visual representation of financial decline using a collapsing bar chart in a modern design. The visualization displays a collapsing financial bar chart, illustrating a significant decrease in financial metrics with a clean, minimalist aesthetic.
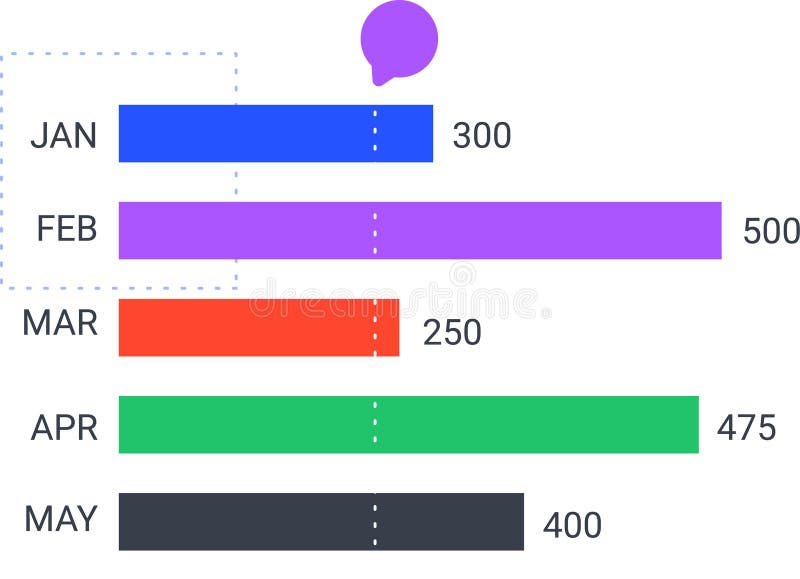
Free with trial Colorful horizontal bar chart is displaying monthly statistics from january to may, indicating trends and performance with a speech bubble above. Analysis decrease vectors Colorful horizontal bar chart is displaying monthly statistics from january to may, indicating trends and performance
Free with trial Stock Market Graph With City Lights Background Financial Data, Investment, Trading Concept. , Generated by AI. Analysis decrease illustrations Stock Market Graph With City Lights Background Financial Data, Investment, Trading Concept.
Free with trial Two colorful lines are representing data points over time, creating a visual representation of trends and fluctuations, with a highlighted period marked in red. Analysis decrease illustrations Two colorful lines are representing data points over time, creating a visual representation of trends and fluctuations
Free with trial No decline icon. Prohibition symbol with graph. Red and black warning. Financial growth concept. EPS 10. Analysis decrease vectors No decline icon. Prohibition symbol with graph. Red and black warning. Financial growth concept.
Free with trial 3d Up and Down sign with red arrows vector collection. Design vector illustration concept of sales bar chart symbol icon set with arrow moving down and sales bar chart with arrow moving up. Analysis decrease vectors 3d Up and Down sign with red arrows vector collection. Design vector illustration concept of sales bar chart symbol icon set
Free with trial Glowing neon Global economic crisis icon isolated on brick wall background. World finance crisis. Neon light alphabet. Vector. Analysis decrease illustrations Glowing neon Global economic crisis icon isolated on brick wall background. World finance crisis. Neon light alphabet
Free with trial Silhouette of a head with stock market decline graph overlay, red and black tones, digital concept of financial crisis. 3D. Analysis decrease illustrations Silhouette of a head with stock market decline graph overlay, red and black tones, digital concept of financial crisis. 3D
Free with trial US dollar tumbling down as symbol for inflation and devaluation. Digital financial visualization of red stock market graph line trending downward on a dark background. Economic falling and recession. Generative Ai. Analysis decrease illustrations US dollar tumbling down as symbol for inflation and devaluation. Digital financial visualization of red stock market graph line
Free with trial This sleek, minimalist linear bar graph is perfect for showcasing downward trends in your business data. Ideal for presentations, reports, and dashboards, this editable graphic allows you to easily customize stroke width and colors to match your brand. The clean design and simple layout make complex data easily digestible, highlighting key performance indicators and areas needing attention. Analysis decrease illustrations Editable Linear Bar Graph Visualize Downward Trends for Powerful Business Analytics Reports and Presentations. This sleek, minimalist linear bar graph is perfect for showcasing downward trends in your business data. Ideal for presentations, reports, and dashboards, this editable graphic allows you to easily customize stroke width and colors to match your brand. The clean design and simple layout make complex data easily digestible, highlighting key performance indicators and areas needing attention.
Free with trial Candlestick chart line icon. Neumorphic, Orange gradient, 3d pin buttons. Analytics graph sign. Market analytics symbol. Line icons. Neumorphic buttons with outline signs. Vector. Analysis decrease vectors Candlestick chart line icon. Analytics graph sign. Line icons. Vector. Candlestick chart line icon. Neumorphic, Orange gradient, 3d pin buttons. Analytics graph sign. Market analytics symbol. Line icons. Neumorphic buttons with outline signs. Vector
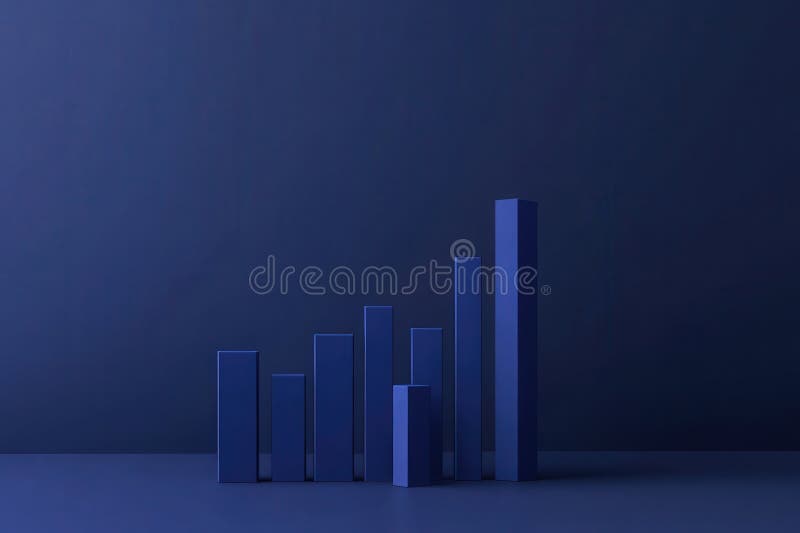
Free with trial The visual displays a clean and minimalist bar chart, illustrating a notable decrease in financial performance over a recent quarter, with a focus on dark blue tones to enhance impact. Analysis decrease illustrations Minimalist financial bar chart showing significant decline in earnings over the past quarter. The visual displays a clean and minimalist bar chart, illustrating a notable decrease in financial performance over a recent quarter, with a focus on dark blue tones to enhance impact.
Free with trial Stock market charts depicting a downward trend, symbolizing a financial crisis, set on a dark, abstract background, illustrating the concept of economic decline. Analysis decrease illustrations Stock market charts depicting a downward trend, symbolizing a financial crisis, set on a dark, abstract background, illustrating
Free with trial A sinking stock market graph reflecting investor panic. Generative AI. Analysis decrease illustrations A sinking stock market graph reflecting investor panic
Free with trial Clean red line graph shows a steep decline against white, emphasizing negative space. Analysis decrease illustrations Minimalist red line graph showing sharp decline on white background, clean lines, negative space. Clean red line graph shows a steep decline against white, emphasizing negative space.
Free with trial Upward and downward arrows with a percentage symbol. An illustration of arrows pointing up and down, often used to represent changes, fluctuations, or progress, along with a percentage symbol. Analysis decrease vectors Upward and Downward Arrows with Percentage, Financial Growth and Decline Concept. Upward and downward arrows with a percentage symbol. An illustration of arrows pointing up and down, often used to represent changes, fluctuations, or progress, along with a percentage symbol.
Free with trial Upward and downward arrows with a percentage symbol. An illustration of arrows pointing up and down, often used to represent changes, fluctuations, or progress, along with a percentage symbol. Analysis decrease vectors Upward and Downward Arrows with Percentage, Financial Growth and Decline Concept. Upward and downward arrows with a percentage symbol. An illustration of arrows pointing up and down, often used to represent changes, fluctuations, or progress, along with a percentage symbol.
Free with trial Upward and downward arrows with a percentage symbol. An illustration of arrows pointing up and down, often used to represent changes, fluctuations, or progress, along with a percentage symbol. Analysis decrease vectors Upward and Downward Arrows with Percentage, Financial Growth and Decline Concept. Upward and downward arrows with a percentage symbol. An illustration of arrows pointing up and down, often used to represent changes, fluctuations, or progress, along with a percentage symbol.
Free with trial Male and female characters beside a financial downfall chart, vector illustration on a blue background, concept of business success. Flat cartoon vector illustration. Analysis decrease vectors Male and female characters beside a financial downfall chart, vector illustration
Free with trial A businessman presents a cost reduction concept, featuring a downward-trending graph illustrating financial success. Ideal for finance, business strategy, and marketing materials, this digital illustration conveys budget management and. Analysis decrease illustrations Businessman presenting cost reduction concept with falling graph representing financial progress and success. A businessman presents a cost reduction concept, featuring a downward-trending graph illustrating financial success. Ideal for finance, business strategy, and marketing materials, this digital illustration conveys budget management and
Free with trial Explore the dramatic decrease of the Aral Sea highlighting ecological issues and climate impact through stunning aerial views. Analysis decrease illustrations Nature photography of the aral sea aerial perspectives on climate change and environmental decline in central asia. Explore the dramatic decrease of the Aral Sea highlighting ecological issues and climate impact through stunning aerial views
Free with trial A futuristic bear walking through a glowing urban cityscape with stock market data charts and graphs symbolizing a bearish financial market trend. Generative AI. Analysis decrease illustrations A futuristic bear walking through a glowing urban cityscape with stock market data charts and graphs symbolizing a bearish
Free with trial Image displaying stock market chart, rising or falling trends Generative AI. Analysis decrease illustrations Image displaying stock market chart, rising or falling trends
Free with trial Collagen production in women based on age. Medical, healthcare infographics. Important information. Menopause problem. Editable vector illustration isolated on a white background. Horizontal banner. Analysis decrease vectors Collagen production in women based on age. Medical, healthcare infographics.
Free with trial Collagen production in women based on age. Medical, healthcare infographics. Important information. Menopause problem. Editable vector illustration isolated on a white background. Horizontal banner. Analysis decrease vectors Collagen production in women based on age. Medical, healthcare infographics.
Free with trial Reduction chart icon. eps. Analysis decrease vectors Chart Icon Demonstrating Reduction in Data, Business Decline, and Statistical Analysis. Reduction chart icon.eps
Free with trial Collagen production in women based on age. Medical, healthcare infographics. Important information. Menopause problem. Editable vector illustration isolated on a white background. Horizontal banner. Analysis decrease vectors Collagen production in women based on age. Medical, healthcare infographics.
Free with trial Wooden blocks stacked coins illustrate rising inflation and economic growth concept economy. Analysis decrease illustrations Rising Inflation Economic Growth Financial Crisis Concept Wooden Blocks Stacked Coins Business Chart Graph red risk cost. Wooden blocks stacked coins illustrate rising inflation and economic growth concept economy
Free with trial Financial data shows downward trend. Spreadsheet exhibits economic decline. Magnifying glass focuses on, negative indicators. Business recession impacting market. Stock loss visible. Analysis decrease illustrations Financial data shows downward trend. Spreadsheet exhibits economic decline. Magnifying glass focuses on negative indicators. Financial data shows downward trend. Spreadsheet exhibits economic decline. Magnifying glass focuses on, negative indicators. Business recession impacting market. Stock loss visible.
Free with trial Magnifying glass focuses on declining spreadsheet numbers during economic downturn. Financial data shows significant drop in figures. Business analyst examines, alarming trend. Analysis decrease illustrations Magnifying glass focuses on declining spreadsheet numbers during economic downturn. Financial data shows significant drop in
Free with trial Collagen production in women based on age. Medical, healthcare infographics. Important information. Menopause problem. Editable vector illustration isolated on a white background. Horizontal banner. Analysis decrease vectors Collagen production in women based on age. Medical, healthcare infographics.
Free with trial Image of businessman standing in modern office with hands on head looking distressed at large screen displaying fluctuating financial red charts indicating bear market. Recession, stock market concept. Analysis decrease illustrations Image of businessman standing in modern office with hands on head looking distressed at large screen displaying fluctuating
Free with trial Black Searching for food in trash can on streets outdoors icon isolated on white background. Homelessness and poverty concept. Vector. Analysis decrease illustrations Black Searching for food in trash can on streets outdoors icon isolated on white background. Homelessness and poverty
Free with trial Minimalist black and white outline vector illustration of a simplified line graph icon for business analytics and financial performance tracking in a corporate environment. Analysis decrease vectors Clean and straightforward icon depicting an increasing and decreasing line graph. Minimalist black and white outline vector illustration of a simplified line graph icon for business analytics and financial performance tracking in a corporate environment
Free with trial Colored outline declining coin bar chart with stack coin icon logo vector illustration design. Analysis decrease vectors Colored outline declining coin bar chart with stack coin icon logo vector illustration design
Free with trial Stock market trading graph in red color as economy 3D illustration background. Analysis decrease illustrations Stock market trading graph in red color as economy 3D illustration
Free with trial Abstract black trend line fractures downward on white, suggesting geometric collapse. Analysis decrease illustrations Abstract minimalist fractured downward trend line black on white, geometric fragments suggesting collapse. Abstract black trend line fractures downward on white, suggesting geometric collapse.
Free with trial Abstract black trend line fractures downward on white, suggesting geometric collapse. Analysis decrease illustrations Abstract minimalist fractured downward trend line black on white, geometric fragments suggesting collapse. Abstract black trend line fractures downward on white, suggesting geometric collapse.
Free with trial Abstract black trend line fractures downward on white, suggesting geometric collapse. Analysis decrease illustrations Abstract minimalist fractured downward trend line black on white, geometric fragments suggesting collapse. Abstract black trend line fractures downward on white, suggesting geometric collapse.
Free with trial Abstract black trend line fractures downward on white, suggesting geometric collapse. Analysis decrease illustrations Abstract minimalist fractured downward trend line black on white, geometric fragments suggesting collapse. Abstract black trend line fractures downward on white, suggesting geometric collapse.
Free with trial Credit card transactions for home purchases are not increasing amid a fluctuating real estate market, Credit card sales for homes are not increasing or decreasing. Analysis decrease vectors Credit card transactions for home purchases are not increasing amid a fluctuating real estate market, Credit card sales for homes
Free with trial 3D delivery truck with arrow graph, transportation and inflation concept Generative AI. Analysis decrease illustrations 3D delivery truck with arrow graph, transportation and inflation concept
Free with trial Business losses abstract concept vector illustration. Company leaders upset with financial statements, disappointing financial report, business documents, corporate paperwork abstract metaphor. Analysis decrease vectors Business losses abstract concept vector illustration.
Free with trial Cost text and down arrows. budget, Cost Management. Analysis decrease vectors Cost text and down arrows. budget, Cost Management
Free with trial 3D Isometric Flat Vector Illustration of Business Chart, Data and Statistic. Analysis decrease vectors 3D Isometric Flat Vector Illustration of Business Chart
Free with trial The sales target schedule displays flat trends alongside varying performance metrics in a colorful chart Sales target schedule is trending flat. Analysis decrease vectors The sales target schedule displays flat trends alongside varying performance metrics in a colorful chart Sales target schedule is
Free with trial Glowing neon line Global economic crisis icon isolated on blue background. World finance crisis. Vector. Analysis decrease illustrations Glowing neon line Global economic crisis icon isolated on blue background. World finance crisis. Vector
Free with trial A detailed circuit board displaying a red declining stock market graph, representing challenges in the semiconductor and technology sectors - AI-generated. Analysis decrease illustrations A detailed circuit board displaying a red declining stock market graph, representing challenges in the semiconductor and
Free with trial Cost reduction concept icon with downward arrows, money bag, and minimalist design for financial management and budget savings in business investment and economic planning. Analysis decrease vectors Line art icon illustrating cost reduction concept with a money bag and downward arrows. Cost reduction concept icon with downward arrows, money bag, and minimalist design for financial management and budget savings in business investment and economic planning
Free with trial A striking and impactful collection of illustrations depicting a stock market crash with dramatic downward trend graphs. Analysis decrease vectors Stock market crash down graph illustration. A striking and impactful collection of illustrations depicting a stock market crash with dramatic downward trend graphs
Free with trial Multicolored graph trending downward icon. Analysis decrease illustrations Wfh140125. Multicolored graph trending downward icon
Free with trial Vector illustration depicting financial challenges and savings strategies. Scenes show individuals interacting with money-saving tools, analyzing graphs, and managing expenses. Analysis decrease vectors Financial Challenges and Savings Solutions. Vector illustration depicting financial challenges and savings strategies. Scenes show individuals interacting with money-saving tools, analyzing graphs, and managing expenses.
Free with trial Close-up of a red circuit board with a glowing red stock market graph, representing fluctuations in the tech and semiconductor industry - AI-generated. Analysis decrease illustrations Close-up of a red circuit board with a glowing red stock market graph, representing fluctuations in the tech and semiconductor
Free with trial No tariff economy trade sign in set vector. Analysis decrease vectors No tariff economy trade sign in set
Free with trial A digital financial chart with downward trending arrows, symbolizing a market crash or economic crisis on a dark background with red and blue accents. 3D Rendering. Analysis decrease illustrations A digital financial chart with downward trending arrows, symbolizing a market crash or economic crisis on a dark background with
Free with trial Piles of gold coins in front of a digital stock market crash graph, signifying financial crisis on a dark red background, concept of investment loss. 3D Rendering. Analysis decrease illustrations Piles of gold coins in front of a digital stock market crash graph, signifying financial crisis on a dark red background, concept
Free with trial Businessman sitting on coin stack with laptop, downturn arrow points at worried man. Financial loss and economic downturn concept. Investment risk management vector illustration. Analysis decrease vectors Businessman sitting on coin stack with laptop, downturn arrow points at worried man. Financial loss and economic
Free with trial Global trade tariff ban symbol design vector. Analysis decrease vectors Global trade tariff ban symbol design
Free with trial Doodle Graph going down illustration. Analysis decrease illustrations Doodle Graph going down
Free with trial Doodle Graph going down illustration. Analysis decrease illustrations Doodle Graph going down
Free with trial A close-up view of a monitor displaying complex financial data, including stock market charts and numerical values. Stock market Data Displayed on a Monitor. Analysis decrease illustrations Stock market Data Displayed on a Monitor
Free with trial Bitcoin on broken circuit board. Bitcoin price crash concept. Virtual money asset. Analysis decrease illustrations Bitcoin on broken circuit board. Bitcoin price crash concept. Virtual money asset
Free with trial Economic downturn trade war tariffs war recession crisis magnifying glass declining graph coins gears arrows abstract background mobile app screen Vector illustration. Analysis decrease vectors Economic downturn trade war tariffs war recession crisis magnifying glass declining graph coins gears arrows abstract background
Free with trial Clean animated bar chart visualizing rising and falling market trends with green bars representing growth, profit, and positive performance, and red bars indicating decline, loss, and negative movement. Symbolizes financial volatility, stock market cycles, economic fluctuations, investment performance, and business analytics. Ideal for illustrating bullish and bearish phases, economic indicators, trading activity, and financial data visualization. Analysis decrease illustrations Financial Market Trend Animation Showing Upturn and Downturn Phases. Clean animated bar chart visualizing rising and falling market trends with green bars representing growth, profit, and positive performance, and red bars indicating decline, loss, and negative movement. Symbolizes financial volatility, stock market cycles, economic fluctuations, investment performance, and business analytics. Ideal for illustrating bullish and bearish phases, economic indicators, trading activity, and financial data visualization.
Free with trial Financial risk diagram vector icon. filled flat sign for mobile concept and web design. Financial Risk glyph icon. Symbol, logo illustration. Vector graphics. Analysis decrease vectors Financial risk diagram vector icon
Free with trial Composite trend artwork 3D image photo collage of copyspace young woman miniature stand huge arrow show direction down star achieve goal. Analysis decrease illustrations Composite trend artwork 3D image photo collage of copyspace young woman miniature stand huge arrow show direction down
Free with trial Magnifying glass coin graph arrows snail lightbulb financial crisis recession downturn slow growth concept abstract background website banner Vector illustration. Analysis decrease vectors Magnifying glass coin graph arrows snail lightbulb financial crisis recession downturn slow growth concept abstract background