Free with trial Set Data analysis, Binary code, Folder and lock, Financial growth, Search data, and decrease icon. Vector. Analysis decrease vectors Set Data analysis, Binary code, Folder and lock, Financial growth, Search data, and decrease icon. Vector
Free with trial Arrow icon with percent symbol, economic growth, increase, decrease arrow, up and down arrow icon. Analysis decrease vectors Arrow icon with percent symbol, economic growth, increase, decrease arrow, up and down arrow icon
Free with trial Stock market chart displaying data and financial analysis. Green and red candles show trading on background. Investment indicators and performance trends. Analysis decrease illustrations Stock market chart data and financial analysis. Stock market chart displaying data and financial analysis. Green and red candles show trading on background. Investment indicators and performance trends
Free with trial Set Mind map infographic Pie chart Server Folder and lock Sales funnel with Financial growth decrease Data analysis and icon. Vector. Analysis decrease vectors Set Mind map infographic, Pie chart, Server, Folder and lock, Sales funnel with, Financial growth decrease, Data. Set Mind map infographic Pie chart Server Folder and lock Sales funnel with Financial growth decrease Data analysis and icon. Vector.
Free with trial Decrease glowing style sales graph split illustration profit revenue, analysis forecast, growth decline decrease glowing style sales graph split. Analysis decrease illustrations Decrease glowing style sales graph split
Free with trial A clear vector icon of a minus sign with a magnifying glass, symbolizing zoom out, decrease view, or subtract function. Ideal for image editing, map navigation, and data analysis, this design allows users to reduce magnification or remove elements, providing versatile control over content display, vector design Generative AI. Analysis decrease vectors Zoom Out: Decrease View and Subtract Icon, vector design Generative AI. A clear vector icon of a minus sign with a magnifying glass, symbolizing zoom out, decrease view, or subtract function. Ideal for image editing, map navigation, and data analysis, this design allows users to reduce magnification or remove elements, providing versatile control over content display, vector design Generative AI
Free with trial Calculator alongside arrows indicating increase and decrease, and a line graph with fluctuations. Ideal for finance, budgeting, economics, analysis, statistics, decision-making, simple flat metaphor. Analysis decrease illustrations Calculator with Arrows and Graph Representing Financial Analysis and Data Trends. Calculator alongside arrows indicating increase and decrease, and a line graph with fluctuations. Ideal for finance, budgeting, economics, analysis, statistics, decision-making, simple flat metaphor
Free with trial A vector icon illustrating a downward trending line graph, symbolizing a decline, decrease, or negative performance. Ideal for financial reports, data analysis dashboards, or warning indicators. This clear and concise graphic is scalable, perfect for conveying trend information in various digital interfaces, vector design Generative AI. Analysis decrease vectors Declining Trend Graph Icon - Downturn Analysis Symbol, vector design Generative AI. A vector icon illustrating a downward trending line graph, symbolizing a decline, decrease, or negative performance. Ideal for financial reports, data analysis dashboards, or warning indicators. This clear and concise graphic is scalable, perfect for conveying trend information in various digital interfaces, vector design Generative AI
Free with trial Set pop art Coal mine trolley, Data analysis, and Financial growth decrease icon. Vector. Analysis decrease illustrations Set pop art Coal mine trolley, Data analysis, and Financial growth decrease icon. Vector
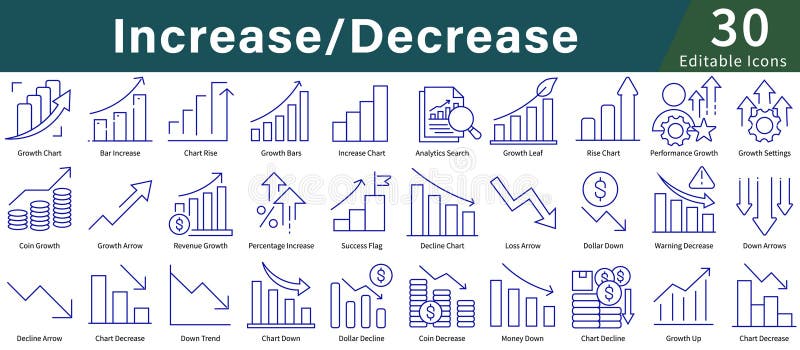
Free with trial Icons illustrating concepts of "Increase Decrease," using simple blue line art. Features include graphs and charts with upward and downward arrows, coins, dollar symbols, and percentage signs. Icons depict growth, decline, analytics, and performance tracking. Suitable for business, finance, or data analysis themes, these icons provide a visual representation of financial trends and statistics, making abstract concepts clear and easily understandable. The design is minimalistic and user-friendly, aimed at enhancing clarity in presentations and reports. Analysis decrease vectors Increase Decrease Icon Set in Line Style with Editable Vector for Growth, Analytics, Charts, and Data Visualization. Icons illustrating concepts of "Increase Decrease," using simple blue line art. Features include graphs and charts with upward and downward arrows, coins, dollar symbols, and percentage signs. Icons depict growth, decline, analytics, and performance tracking. Suitable for business, finance, or data analysis themes, these icons provide a visual representation of financial trends and statistics, making abstract concepts clear and easily understandable. The design is minimalistic and user-friendly, aimed at enhancing clarity in presentations and reports.
Free with trial Bar Chart Decline Line And Solid Icon Set. Financial Loss, Economic Downturn, And Business Performance Decrease Symbol Collection. Data Analysis And Market Trends. Isolated Vector Illustration. Analysis decrease vectors Bar Chart Decline Line And Solid Icon Set. Financial Loss, Economic Downturn, And Business Performance Decrease Symbol
Free with trial A police department is using data analysis to track traffic violations and target areas with high rates of accidents resulting in a decrease in trafficrelated crimes.. Vector illustration. Analysis decrease vectors A police department is using data analysis to track traffic violations and target areas with high rates of accidents
Free with trial Set line Pie chart infographic Financial growth decrease and Search data analysis on seamless pattern. Vector. Analysis decrease illustrations Set line Pie chart infographic, Financial growth decrease and Search data analysis on seamless pattern. Vector
Free with trial Set Search data analysis, Financial growth decrease, Server and Binary code icon. Vector. Analysis decrease illustrations Set Search data analysis, Financial growth decrease, Server and Binary code icon. Vector
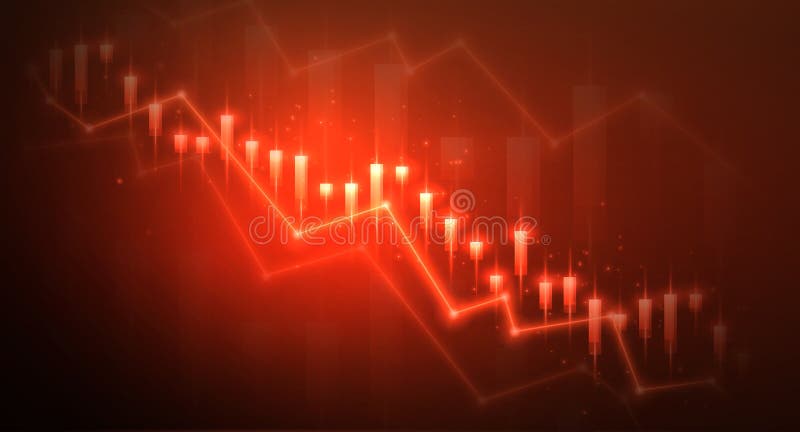
Free with trial Stock and economic crisis graph background. Trade exchange, financial decrease, bed business strategy, digital asset, loss investment fund, online broker, stock collapse and crisis concept. Analysis decrease vectors Stock and economic crisis graph background. Trade exchange, financial decrease
Free with trial Stock and economic crisis graph background. Trade exchange, financial decrease, bed business strategy, digital asset, loss investment fund, online broker, stock collapse and crisis concept. Analysis decrease illustrations Stock and economic crisis graph background. Trade exchange, financial decrease
Free with trial Stock and economic crisis graph background. Trade exchange, financial decrease, bed business strategy, digital asset, loss investment fund, online broker, stock collapse and crisis concept. Analysis decrease illustrations Stock and economic crisis graph background. Trade exchange, financial decrease
Free with trial Broker trader analyzing economic crisis. Trade exchange, financial decrease, bed business strategy, digital asset, loss investment fund, online broker, stock collapse and crisis concept. Analysis decrease vectors Broker trader analyzing economic crisis. Trade exchange, financial decrease
Free with trial Declining graph icon in line design. decline, graph, chart, analytics, business, decrease, statistics on white background vector. Declining graph editable stroke icon. Analysis decrease vectors Declining graph icon in line design. decline, graph, chart, analytics, business, decrease, statistics on white background vector
Free with trial Decrease : Decrease represents a reduction in value, profit, or financial performance over a specific period. Analysis decrease vectors Illustration of Decrease. Decrease : Decrease represents a reduction in value, profit, or financial performance over a specific period.
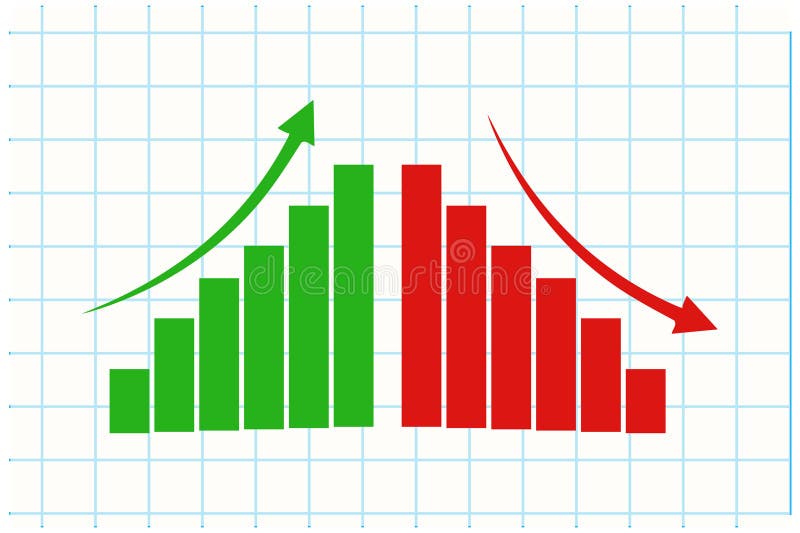
Free with trial A cartoon woman with brown hair in a ponytail, wearing a blue shirt and red pants, stands confidently between two bar graphs. The green graph on the left shows an increase, while the purple graph on the right shows a decrease. The image is a simple, illustrative representation of data analysis or business concepts. Analysis decrease vectors Woman Standing Between Two Bar Graphs. A cartoon woman with brown hair in a ponytail, wearing a blue shirt and red pants, stands confidently between two bar graphs. The green graph on the left shows an increase, while the purple graph on the right shows a decrease. The image is a simple, illustrative representation of data analysis or business concepts.
Free with trial 3D bar chart with descending green bars and blue downward arrow on white background. Ideal for finance, business decline, loss and market analysis. Analysis decrease illustrations 3D Declining Bar Chart with Blue Arrow Down Icon on Transparent Background for Finance Analysis. 3D bar chart with descending green bars and blue downward arrow. 3D bar chart with descending green bars and blue downward arrow on white background. Ideal for finance, business decline, loss and market analysis
Free with trial Decrease: Decrease represents a reduction in value, amount, or performance over time. Analysis decrease illustrations Illustration of Decrease. Decrease: Decrease represents a reduction in value, amount, or performance over time.
Free with trial Trade war impact on usa vs china stock market crisis with data visualization for economic analysis. Generative AI. Analysis decrease illustrations Trade war impact on usa vs china stock market crisis with data visualization for economic analysis
Free with trial Comparing Bar Chart Data Analysis Icons vol 30444. Analysis decrease vectors Comparing Bar Chart Data Analysis Icons
Free with trial Analysis audit sales growth report icon vector modern comparing with loss failure statistics business data performance set sign symbol, progress assessment strategy vs recession decrease graph clipart. Analysis decrease vectors Analysis audit sales growth report icon vector modern comparing with loss failure statistics business data performance set sign
Free with trial Funny pizza slice cartoon character presenting a sales report bar graph. This vector illustration is perfect for business analysis, food industry, and creative presentations about market trends. Analysis decrease illustrations Pizza Sales Report Cartoon Icon, Business Analysis Concept. Funny pizza slice cartoon character presenting a sales report bar graph. This vector illustration is perfect for business analysis, food industry, and creative presentations about market trends.
Free with trial Blue growing chart and magnifying glass with falling coins inside. Market analysis, financial audit, growth tracking, decline detection, data insight concept. Digital futuristic low poly style Vector. Analysis decrease vectors Blue growing chart and magnifying glass with falling coins inside. Market analysis, financial audit, growth tracking
Free with trial Blue arrow pointing down symbolizes decrease, globe indicates world aspect, pendulum reflects instability. Ideal for economy, finance, global change, risk, analysis, prediction simple flat metaphor. Analysis decrease vectors Downward Arrow with Globe and Pendulum Representing Global Decline and Impact. Blue arrow pointing down symbolizes decrease, globe indicates world aspect, pendulum reflects instability. Ideal for economy, finance, global change, risk, analysis, prediction simple flat metaphor
Free with trial A modern flat design graphic set featuring two icons: opposing arrows indicating increase decrease and a bar chart showing financial growth or decline, perfect for business concepts. Analysis decrease vectors Increase and decrease arrows with bar chart icon. A modern flat design graphic set featuring two icons: opposing arrows indicating increase decrease and a bar chart showing financial growth or decline, perfect for business concepts
Free with trial Simple black and white vector illustration showing bar charts indicating increase and decrease, perfect for financial or data concepts. Analysis decrease vectors Bar chart icon showing increase and decrease data. Simple black and white vector illustration showing bar charts indicating increase and decrease, perfect for financial or data concepts
Free with trial Bar chart showing stock market increase and decrease. Analysis decrease vectors Bar chart showing stock market increase and decrease.
Free with trial Decrease bar chart icon on circle line. Statistic sign symbol illustration. Analysis decrease vectors Decrease bar chart icon on circle line. Statistic sign symbol
Free with trial Business performance, negative trends, data analysis, economic decline, search results, user concerns. Sad emoticon, graph with downward trend magnifying glass. Business and negative trends. Analysis decrease vectors Declining Graph with Sad Face and Search Bar Negative Trends and Analysis. Business performance, negative trends, data analysis, economic decline, search results, user concerns. Sad emoticon, graph with downward trend magnifying glass. Business and negative trends
Free with trial A set of money growth and decrease icons featuring coins and directional arrows, indicating financial increase and decline. These images represent concepts of economic growth, loss, and currency fluctuation, suitable for various financial and business design projects. Analysis decrease vectors Set of Money Growth and Decrease Icons with Arrows and Coins. A set of money growth and decrease icons featuring coins and directional arrows, indicating financial increase and decline. These images represent concepts of economic growth, loss, and currency fluctuation, suitable for various financial and business design projects
Free with trial A line art icon depicting business performance analysis. Analysis decrease illustrations Gear, Chart, Envelope Business Performance Analysis Icon. A line art icon depicting business performance analysis.
Free with trial Business analysis, performance tracking, resource management, environmental monitoring, sustainability, decline. Declining arrow with graph and water droplet. Business analysis and environmental. Analysis decrease vectors Data Analysis Concept with Decline Arrow, Chart, and Blue Water Droplet Icon. Business analysis, performance tracking, resource management, environmental monitoring, sustainability, decline. Declining arrow with graph and water droplet. Business analysis and environmental
Free with trial Candlestick chart icons on a digital trading screen showing market movements, price trends and investment data for finance, stock analysis, trading strategy and economic growth. Analysis decrease illustrations Candlestick chart displaying financial market data analysis. Candlestick chart icons on a digital trading screen showing market movements, price trends and investment data for finance, stock analysis, trading strategy and economic growth
Free with trial Data analysis. Visualizing analytics through a chart and declining arrow downward trends. Data analysis for business reporting, statistics, forecasting, and presentations. Analysis decrease vectors Data Analysis and Declining Metrics by Graphs and Arrows for Business Reporting. Data analysis. Visualizing analytics through a chart and declining arrow downward trends. Data analysis for business reporting, statistics, forecasting, and presentations
Free with trial Euro Currency Decrease Icons with Downward Arrow vol 30127. Analysis decrease vectors Euro Currency Decrease Icons with Downward Arrow
Free with trial Business decline chart or bar graph icon. Decrease, loss, and financial crisis sign symbol vector. Analysis decrease vectors Business decline chart or bar graph icon. Decrease, loss, and financial crisis sign symbol
Free with trial Colorful pie chart is showing positive statistics and business growth, target and financial analysis and marketing report, data with copy space. Analysis decrease vectors Colorful pie chart is showing positive statistics and business growth, target and financial analysis and marketing
Free with trial An abstract visual representation of data, featuring a vibrant red bar chart resembling a cityscape or sound wave, overlaid with a line graph and connecting dots. This dynamic graphic is ideal for concepts related to financial analysis, business intelligence, or data visualization. Analysis decrease illustrations Red Abstract Bar Chart Waveform with Connecting Dots and Lines - Data Analysis. An abstract visual representation of data, featuring a vibrant red bar chart resembling a cityscape or sound wave, overlaid with a line graph and connecting dots. This dynamic graphic is ideal for concepts related to financial analysis, business intelligence, or data visualization.
Free with trial Data trends. Data with arrows indicating increase and decrease, growth chart, and audio waveform. Data trends highlight growth, performance tracking, and communication analysis. Suitable. Analysis decrease illustrations Data Trends and Analysis with Arrows, Graph, and Audio Waveform Communication Metrics. Data trends. Data with arrows indicating increase and decrease, growth chart, and audio waveform. Data trends highlight growth, performance tracking, and communication analysis. Suitable
Free with trial Bar graph with an upward trend, blue downward arrow, and percentage sign. Ideal for business analysis, finance, growth, decline trends, statistics economics comparison. Flat simple metaphor. Analysis decrease vectors Financial chart with growth trend, declining arrow, and percentage symbol representing data analysis. Bar graph with an upward trend, blue downward arrow, and percentage sign. Ideal for business analysis, finance, growth, decline trends, statistics economics comparison. Flat simple metaphor
Free with trial Decrease and increase chart icon with arrow. Negative and positive trend symbol illustration. Analysis decrease vectors Decrease and increase chart icon with arrow. Negative and positive trend symbol
Free with trial Illustration of a growing business intelligence with a dashboard displaying high metrics, a stack of data chips, and a simple magnifying glass. Vector flat icon design on a white background for a data analysis illustration --chaos 30 --ar 16:9 --v 7 Job ID: cfbe4cc3-3bae-455f-ac79-f340192ae4d4. Analysis decrease illustrations Data Analysis and Reporting Concept Computer Screen with Charts and Magnifying Glass. Illustration of a growing business intelligence with a dashboard displaying high metrics, a stack of data chips, and a simple magnifying glass. Vector flat icon design on a white background for a data analysis illustration --chaos 30 --ar 16:9 --v 7 Job ID: cfbe4cc3-3bae-455f-ac79-f340192ae4d4
Free with trial Statistic Bar Chart Outline Sign Data Stats Business Performance Market Analysis Economic Trend Line Icon Presentation Display Board Symbol. Analysis decrease vectors Statistic Bar Chart Outline Sign Data Stats Business Performance Market Analysis Economic Trend Line Icon Presentation Display
Free with trial Minimalist outline drawing of a bar chart representing data analysis and statistical information. Great for presentations and data representations. Analysis decrease vectors Simple Outline Bar Chart Sign Statistical Data Analysis Diagram Icon. Minimalist outline drawing of a bar chart representing data analysis and statistical information. Great for presentations and data representations.
Free with trial Yellow sad emoticon and green pants next to stylized line graph with nodes. Ideal for fashion industry, sales decrease, trends, dissatisfaction, analysis, loss, economics. Simple flat metaphor. Analysis decrease illustrations Sad face with pants and graph chart symbolizing loss or decline in trends or fashion demand. Yellow sad emoticon and green pants next to stylized line graph with nodes. Ideal for fashion industry, sales decrease, trends, dissatisfaction, analysis, loss, economics. Simple flat metaphor
Free with trial Loss Report Document Icons for Financial Decline and Business Analysis vol 11482. Analysis decrease vectors Loss Report Document Icons for Financial Decline and Business Analysis
Free with trial Arrow icon with percent symbol, economic growth, increase, decrease arrow, up and down arrow icon. Analysis decrease vectors Arrow icon with percent symbol, economic growth, increase, decrease arrow, up and down arrow icon
Free with trial Percentage Decrease Bar Chart Icons for Financial Reports and Analytics vol 34492. Analysis decrease vectors Percentage Decrease Bar Chart Icons for Financial Reports and Analytics
Free with trial A simple and clean line graph icon illustration, perfect for illustrating financial data, growth charts, and statistical analysis. Ideal for use in presentations, reports, and websites. Analysis decrease vectors Minimalist Line Graph Icon Design for Financial Data Analysis Presentation. A simple and clean line graph icon illustration, perfect for illustrating financial data, growth charts, and statistical analysis. Ideal for use in presentations, reports, and websites.
Free with trial Data performance, emotional analysis, trends, efficiency, technology, decision-making. Graph with declining curve, sad and happy faces gear mechanism. Data performance and emotional analysis concept. Analysis decrease vectors Data Analysis Chart with Declining Trend, Emotional Reactions, and Gear Mechanism Efficiency. Data performance, emotional analysis, trends, efficiency, technology, decision-making. Graph with declining curve, sad and happy faces gear mechanism. Data performance and emotional analysis concept
Free with trial Data melting line graph illustration trend analysis, visualization ice, decrease plot data melting line graph. Analysis decrease illustrations Data melting line graph
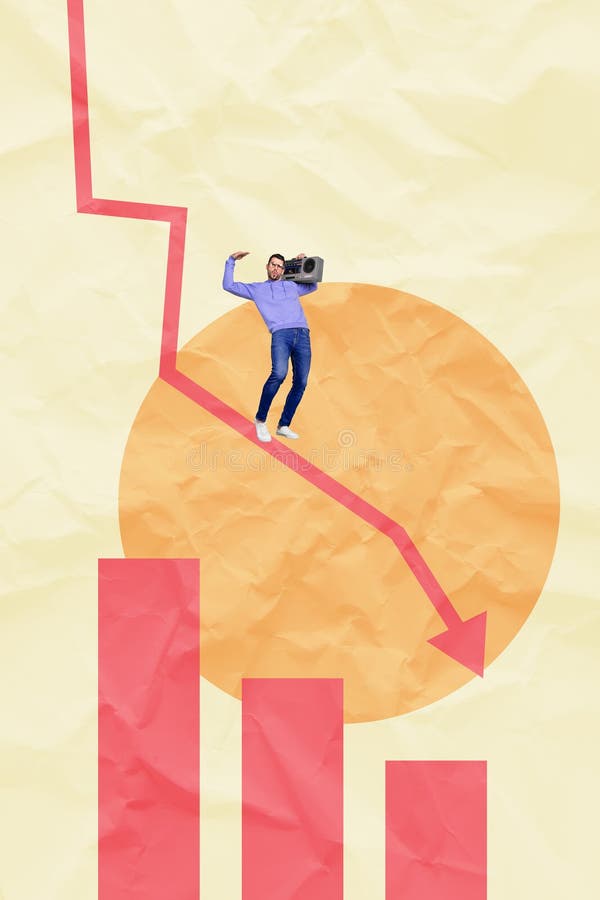
Free with trial Modern business crisis collage witt business analyzing shocking falling stats graph symbolizing global decrease. Analysis decrease illustrations Modern business crisis collage witt business analyzing shocking falling stats graph symbolizing global decrease
Free with trial Modern business crisis collage witt business analyzing shocking falling stats graph symbolizing global decrease. Analysis decrease illustrations Modern business crisis collage witt business analyzing shocking falling stats graph symbolizing global decrease
Free with trial Decline bar chart with downward trend arrow outline icon vector. Decrease, loss, and financial drop symbol in black circle. Analysis decrease vectors Decline bar chart with downward trend arrow outline icon. Decrease, loss, and financial drop symbol in black circle
Free with trial Temperature melting line graph illustration data trend, analysis visualization, ice decrease temperature melting line graph. Analysis decrease illustrations Temperature melting line graph
Free with trial Trend disintegrating line graph illustration dec decrease, fall analysis, visualization statistics trend disintegrating line graph. Analysis decrease illustrations Trend disintegrating line graph
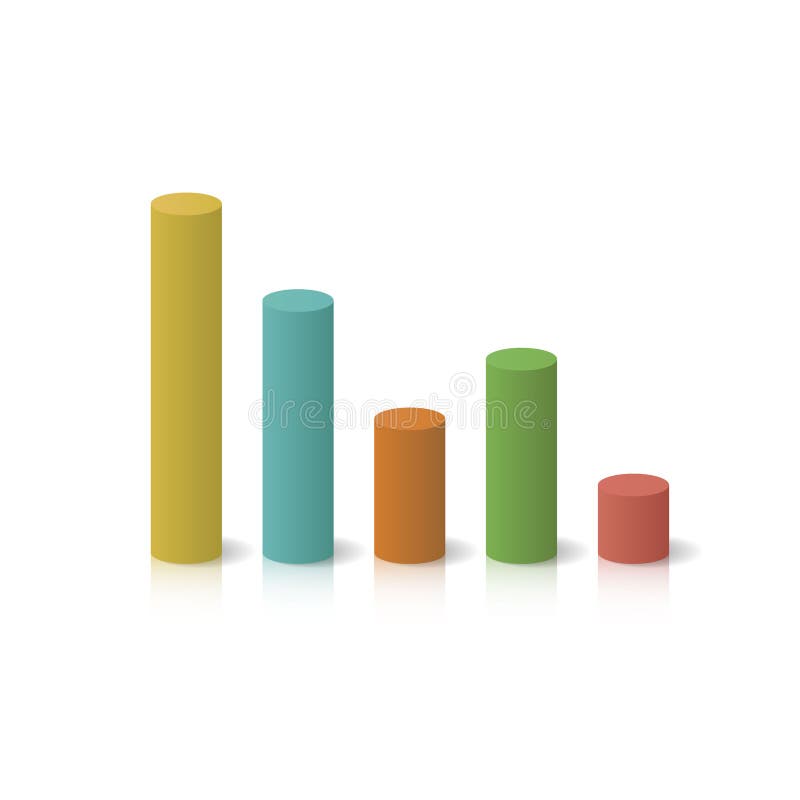
Free with trial Isometric colorful cylinder bar graph showing a financial decline. 3D chart representing loss, decrease, and business drop symbol. Analysis decrease vectors Isometric colorful cylinder bar graph showing a financial decline. 3D chart representing loss, decrease, and business drop
Free with trial Line Graph Chart Line And Solid Icon Set. Data Analysis, Trend Visualization, And Business Growth Symbol Collection. Statistical Representation And Performance Tracking. Isolated Vector Illustration. Analysis decrease vectors Line Graph Chart Line And Solid Icon Set. Data Analysis, Trend Visualization, And Business Growth Symbol Collection
Free with trial Corn price going down decrease cheaper in commodity market international trading market vector. Analysis decrease vectors Corn price going down decrease cheaper in commodity market international trading market
Free with trial A simple line graph icon showing a downward trend with two arrows and the words "DECREASE DECLINE. Analysis decrease illustrations Downward Trend Graph Icon with Decrease Decline Text chart. A simple line graph icon showing a downward trend with two arrows and the words "DECREASE DECLINE
Free with trial Trend melting line graph illustration analysis visualization, ice decrease, plot statistics trend melting line graph. Analysis decrease illustrations Trend melting line graph
Free with trial A simple yet impactful vector icon of a downward-pointing arrow, symbolizing a negative trend, decline, or decrease. This design is ideal for financial reports, economic indicators, market analysis, or any data visualization requiring a clear representation of reduction or downturns, vector design Generative AI. Analysis decrease vectors Downward Trend Arrow, Market Decline, vector design Generative AI. A simple yet impactful vector icon of a downward-pointing arrow, symbolizing a negative trend, decline, or decrease. This design is ideal for financial reports, economic indicators, market analysis, or any data visualization requiring a clear representation of reduction or downturns, vector design Generative AI
Free with trial Conceptual line art depicting business analysis and market trends. Analysis decrease illustrations Business Analysis Magnifying Glass, Thumbs Up, Declining Graph. Conceptual line art depicting business analysis and market trends.
Free with trial Collection of simple black vector icons representing financial charts, data analysis graphs, and business statistics. Includes trend arrows, magnifier, and settings symbols. Analysis decrease vectors Set of black business graph and chart icons for data analysis. Collection of simple black vector icons representing financial charts, data analysis graphs, and business statistics. Includes trend arrows, magnifier, and settings symbols
Free with trial A magnifying glass focuses on a downward trend graph and briefcase, symbolizing economic downturn analysis and market. Analysis decrease illustrations Economic Downturn Analysis Magnifying Glass on Market Decline. A magnifying glass focuses on a downward trend graph and briefcase, symbolizing economic downturn analysis and market.
Free with trial This image depicts a combination of line and bar graphs showing comparative data analysis over a period of time. Analysis decrease illustrations Comparative data analysis over time with line and bar graphs. This image depicts a combination of line and bar graphs showing comparative data analysis over a period of time
Free with trial A detailed view of gold bars and coins under a magnifying glass, set against a backdrop of financial charts and data streams. The image evokes a sense of careful scrutiny and investment analysis in the financial markets. The shiny gold textures contrast with the digital screens, creating a blend of. Analysis decrease illustrations Golden Investment Analysis. A detailed view of gold bars and coins under a magnifying glass, set against a backdrop of financial charts and data streams. The image evokes a sense of careful scrutiny and investment analysis in the financial markets. The shiny gold textures contrast with the digital screens, creating a blend of
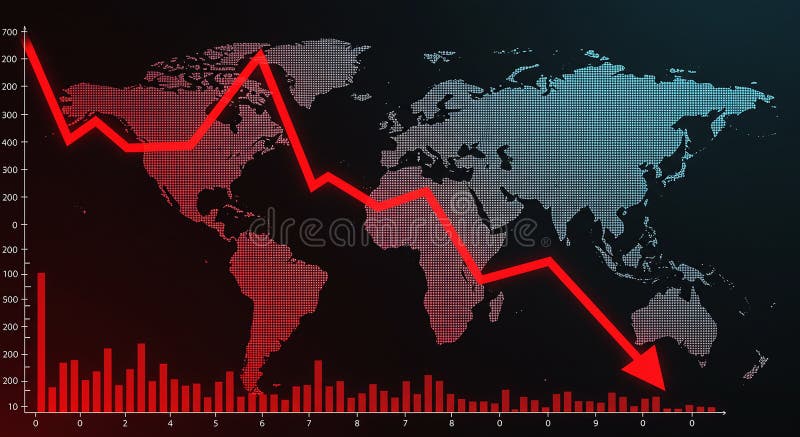
Free with trial World map with a red declining line graph overlay, illustrating a decrease or economic downturn. The graph features sharp declines across various data points, reflecting a downward trend. Red bar chart at the bottom represents additional numerical data against a black background. The map uses a dotted pattern for continents, highlighting regions globally. The image conveys financial analysis, market trends, or economic statistics. Analysis decrease illustrations World map with a red declining line graph overlay
Free with trial Flat illustration of technical analysis with a magnifying glass on a yellow background. Stock market correction concept. Bankrupt financial information. Descending trading graph. Analysis decrease vectors Flat illustration of technical analysis with a magnifying glass on a yellow background. Stock market correction concept. Bankrupt
Free with trial Negative Trend Line Icon, Outline Symbol for Market Loss, Financial Decrease, Warning Indicator, Performance Decline, and Risk Assessment. Vector Sign Icon. Analysis decrease vectors Negative Trend Line Icon, Outline Symbol for Market Loss, Financial Decrease, Warning Indicator, Performance Decline, and Risk
Free with trial This image presents a detailed analysis of business performance metrics, including market share, quarterly sales, and key performance indicators (KPIs. Analysis decrease illustrations Comprehensive business performance metrics and growth analysis. This image presents a detailed analysis of business performance metrics, including market share, quarterly sales, and key performance indicators (KPIs
Free with trial A striking 3D rendering illustrates a significant decline in consumer spending or retail sales. The image features a large green shopping bag followed by three progressively smaller white shopping bags, visually representing a reduction. A prominent red arrow, shaped like a downward trend graph, effectively symbolizes a market downturn, economic recession, or decrease in purchasing power. Set against a clean white background, this conceptual image is ideal for financial reports, business presentations, and articles discussing economic challenges, retail struggles, or market analysis. Analysis decrease illustrations Retail Sales Decline and Economic Downturn. A striking 3D rendering illustrates a significant decline in consumer spending or retail sales. The image features a large green shopping bag followed by three progressively smaller white shopping bags, visually representing a reduction. A prominent red arrow, shaped like a downward trend graph, effectively symbolizes a market downturn, economic recession, or decrease in purchasing power. Set against a clean white background, this conceptual image is ideal for financial reports, business presentations, and articles discussing economic challenges, retail struggles, or market analysis.
Free with trial Set Drop in crude oil price, Dollar rate decrease, and Global economic crisis on seamless pattern. Vector. Analysis decrease vectors Set Drop in crude oil price, Dollar rate decrease, and Global economic crisis on seamless pattern. Vector
Free with trial Futuristic Robotic Hand Pointing Towards Computer Display with Cost Analysis Concept and Digital Connections Representing Innovation and Technology Quark. Analysis decrease illustrations Futuristic Robotic Hand Pointing Towards Computer Display with Cost Analysis Concept and Digital Connections