Free with trial Coronavirus covid-19 covid 19 sars market money stocks index falling background - 3d rendering. Analysis decrease illustrations Coronavirus covid-19 covid 19 sars market stocks index falling background - 3d rendering
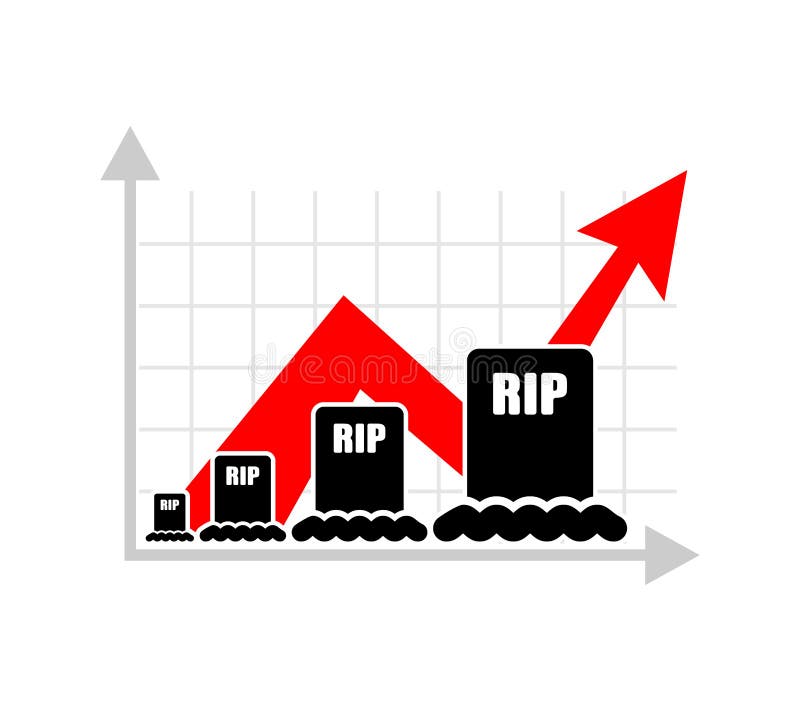
Free with trial Graph of growth of mortality of population. Growing graves. Analytical illustration for infographics. Analysis decrease vectors Graph of growth of mortality of population. Growing graves. Analytical illustration for infographics
Free with trial Ncov 2019 covid 19 coronavirus with double exposure of blurry falling financial graphs and planet hologram. Concept of global financial crisis due to coronavirus pandemic. 3d rendering. Analysis decrease illustrations Coronavirus and global financial crisis concept. Ncov 2019 covid 19 coronavirus with double exposure of blurry falling financial graphs and planet hologram. Concept of global financial crisis due to coronavirus pandemic. 3d rendering
Free with trial White arrow falls against the background of the flag of the Turkey. Analysis decrease illustrations Arrow falls against the background of the flag of the Turk
Free with trial Map of USA Recession Economic Crisis Creative Concept with Economic Crash Arrow Vector Illustration Design. Analysis decrease vectors Map of USA Recession Economic Crisis Creative Concept with Economic Crash Arrow
Free with trial Isometric global economic impacts 2020. Coronavirus or COVID-19 pandemic global impact. Closed border, collapsed world market and economic crisis, panic and food shortages, distance work, and studying. Analysis decrease vectors Isometric global economic impacts 2020. Coronavirus or COVID-19 pandemic global impact. Closed border, collapsed world
Free with trial Isometric global economic impacts 2020. Coronavirus or COVID-19 pandemic global impact. Closed border, collapsed world market and economic crisis, panic and food shortages, distance work, and studying. Analysis decrease vectors Isometric global economic impacts 2020. Coronavirus or COVID-19 pandemic global impact. Closed border, collapsed world
Free with trial Map of United Kingdom Recession Economic Crisis Creative Concept with Economic Crash Arrow Vector Illustration Design. Analysis decrease vectors Map of United Kingdom Recession Economic Crisis Creative Concept with Economic Crash Arrow
Free with trial Dropping arrows showing decreasing trend in economy in global crisis or downtrend of stocks on the stock exchange in USA. Analysis decrease illustrations Dropping arrows showing decreasing trend in economy or downtrend on the stock exchange in USA. Dropping arrows showing decreasing trend in economy in global crisis or downtrend of stocks on the stock exchange in USA.
Free with trial Fall of the Thailand Economy. Recession graph with a red arrow on the Thailand flag. Economic decline. Decline in the economy of stock trading. Downward trends in the economy. Business. Analysis decrease illustrations Fall of the Thailand Economy. Recession graph with a red arrow on the Thailand flag. Economic decline. Decline in the economy of
Free with trial 2019 ncov coronavirus sketch and falling graph over blurry dark blue background. Financial and stock market crash concept. 3d rendering. Analysis decrease illustrations Coronavirus 2019 ncov stock market crisis. 2019 ncov coronavirus sketch and falling graph over blurry dark blue background. Financial and stock market crash concept. 3d rendering
Free with trial Ncov 2019 covid 19 coronavirus with double exposure of blurry falling financial graphs. Concept of financial crisis due to coronavirus pandemic. 3d rendering. Analysis decrease illustrations Coronavirus and financial stock market crisis. Ncov 2019 covid 19 coronavirus with double exposure of blurry falling financial graphs. Concept of financial crisis due to coronavirus pandemic. 3d rendering
Free with trial Text Small business crashed by red coronavirus sketch and falling graphs over grey wall background. Concept of financial crisis due to 2019 ncov coronavirus pandemic. 3d rendering. Analysis decrease illustrations Small business crash due to covid 19 coronavirus. Text Small business crashed by red coronavirus sketch and falling graphs over grey wall background. Concept of financial crisis due to 2019 ncov coronavirus pandemic. 3d rendering
Free with trial Diagram red line falling down with epidemic Coronavirus, Covid-19. Economic business global. Financial, marketing, banking concept. Copy space. Analysis decrease vectors Diagram red line falling down with epidemic Coronavirus Covid-19. Diagram red line falling down with epidemic Coronavirus, Covid-19. Economic business global. Financial, marketing, banking concept. Copy space.
Free with trial Small business and coronavirus sketch and falling graphs over cityscape background. Concept of financial crisis due to 2019 ncov coronavirus pandemic. 3d rendering toned image double exposure. Analysis decrease illustrations Coronavirus small business financial crisis. Small business and coronavirus sketch and falling graphs over cityscape background. Concept of financial crisis due to 2019 ncov coronavirus pandemic. 3d rendering toned image double exposure
Free with trial Small business crashed by red coronavirus sketch over dark blue background. Concept of financial crisis due to 2019 ncov coronavirus pandemic. 3d rendering. Analysis decrease illustrations Coronavirus small business financial crash. Small business crashed by red coronavirus sketch over dark blue background. Concept of financial crisis due to 2019 ncov coronavirus pandemic. 3d rendering
Free with trial Dropping arrows showing decreasing trend in economy in global crisis or downtrend of stocks on the stock exchange in Spain. March 2022, San Francisco, USA. Analysis decrease illustrations Dropping arrows showing decreasing trend in economy or downtrend on the stock exchange in Spain. Dropping arrows showing decreasing trend in economy in global crisis or downtrend of stocks on the stock exchange in Spain. March 2022, San Francisco, USA
Free with trial Set line Financial growth decrease, Data analysis, and Server on black and white. Vector. Analysis decrease illustrations Set line Financial growth decrease, Data analysis, and Server on black and white. Vector
Free with trial Set line Pie chart infographic, Financial growth decrease and Data analysis icon. Vector. Analysis decrease vectors Set line Pie chart infographic, Financial growth decrease and Data analysis icon. Vector
Free with trial Set line Data analysis, Financial growth, Calculator, Folder and lock, decrease and icon. Vector. Analysis decrease illustrations Set line Data analysis, Financial growth, Calculator, Folder and lock, decrease and icon. Vector
Free with trial Set Isometric Financial growth decrease Data analysis and Pie chart infographic icon. Vector. Analysis decrease vectors Set Isometric Financial growth decrease, Data analysis and Pie chart infographic icon. Vector
Free with trial Set line Data analysis, Financial growth decrease, and Search data. Business infographic template. Vector. Analysis decrease illustrations Set line Data analysis, Financial growth decrease, and Search data. Business infographic template. Vector
Free with trial Set line Financial growth decrease, Data analysis, Pie chart infographic, Server, Binary code, and icon. Vector. Analysis decrease illustrations Set line Financial growth decrease, Data analysis, Pie chart infographic, Server, Binary code, and icon. Vector
Free with trial Set line Financial growth decrease Binary code Data analysis Search data with folder and Pie chart infographic icon. Vector. Analysis decrease illustrations Set line Financial growth decrease, Binary code, Data analysis, Search data, with folder and Pie chart infographic icon
Free with trial Set Coal mine trolley Server Pie chart infographic Financial growth Data analysis decrease and Sales funnel with icon. Vector. Analysis decrease vectors Set Coal mine trolley, Server, Pie chart infographic, Financial growth, Data analysis, decrease, and Sales funnel with. Set Coal mine trolley Server Pie chart. Set Coal mine trolley Server Pie chart infographic Financial growth Data analysis decrease and Sales funnel with icon. Vector.
Free with trial Set Financial growth decrease Cloud computing lock Pie chart infographic Server Sales funnel with and Data analysis icon. Vector. Analysis decrease illustrations Set Financial growth decrease, Cloud computing lock, Pie chart infographic, Server, Sales funnel with, and Data analysis
Free with trial A red graph with arrows illustrating decrease and increase, representing data analysis and performance evaluation in business. Suitable for reports and presentations. Analysis decrease vectors Vector art of red graph with arrow, illustrating decrease and increase, representing data analysis and performance evaluation in. A red graph with arrows illustrating decrease and increase, representing data analysis and performance evaluation in business. Suitable for reports and presentations
Free with trial Line art illustration of a bar chart depicting financial decrease for business analysis. Analysis decrease vectors Line art illustration of a bar chart depicting financial decrease for business analysis
Free with trial Three dimensional blue arrows and plus sign representing growth, progress, increase, decrease, statistics, data analysis, business, finance, charts, and trends. Analysis decrease vectors Three dimensional blue arrows and plus sign symbolizing growth progress increase decrease statistics data analysis. Three dimensional blue arrows and plus sign representing growth, progress, increase, decrease, statistics, data analysis, business, finance, charts, and trends
Free with trial FMEA analysis infographic template with round vertical box container gradually decrease on right column dark background style with 4 point for slide presentation vector. Analysis decrease illustrations FMEA analysis infographic template with round vertical box container gradually decrease on right column dark background style with
Free with trial Set line Financial growth decrease, Data analysis, Server and Search data icon. Vector. Analysis decrease illustrations Set line Financial growth decrease, Data analysis, Server and Search data icon. Vector
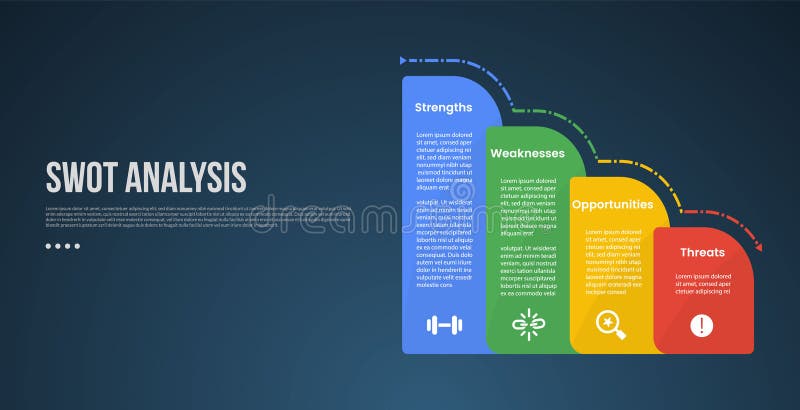
Free with trial SWOT business analysis infographic template with round vertical box container gradually decrease on right column with dark background style. Analysis decrease illustrations SWOT business analysis infographic template with round vertical box container gradually decrease on right column with dark
Free with trial Set Binary code Pie chart infographic Data analysis Coal mine trolley Financial growth decrease and Browser with stocks market icon. Vector. Analysis decrease illustrations Set Binary code, Pie chart infographic, Data analysis, Coal mine trolley, Financial growth decrease, and Browser with. Set Binary code Pie chart infographic Data analysis Coal mine trolley Financial growth decrease and Browser with stocks market icon. Vector.
Free with trial Set line Data analysis Search data Financial growth decrease Server security with padlock Pie chart infographic and icon. Vector. Analysis decrease vectors Set line Data analysis, Search data, Financial growth decrease, Server security with padlock, Pie chart infographic, and
Free with trial A collection of icons Upward graph, Downward graph, Growth chart, Decrease chart, Sales Analysis, Progress graph, icon. Analysis decrease vectors Upward graph, Downward graph, Growth chart, Decrease chart, Sales Analysis, Progress graph, icon
Free with trial Set Isometric line Financial growth decrease, Coal mine trolley, and Data analysis icon. Vector. Analysis decrease vectors Set Isometric line Financial growth decrease, Coal mine trolley, and Data analysis icon. Vector
Free with trial Set line Data analysis Folder and lock Financial growth decrease and Pie chart infographic. Business infographic template. Vector. Analysis decrease vectors Set line Data analysis, Folder and lock, Financial growth decrease and Pie chart infographic. Business infographic. Set line Data analysis Folder and lock Financial growth decrease and Pie chart infographic. Business infographic template. Vector.
Free with trial Set Isometric Financial growth decrease Coal mine trolley and Data analysis icon. Vector. Analysis decrease vectors Set Isometric Financial growth decrease, Coal mine trolley and Data analysis icon. Vector
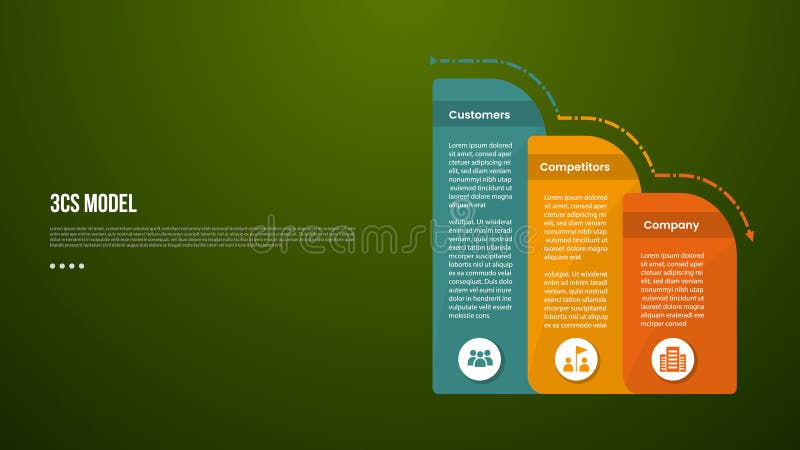
Free with trial 3C analysis business model infographic template with round box container decrease gradually with dark background style with 3 point for slide presentation vector. Analysis decrease illustrations 3C analysis business model infographic template with round box container decrease gradually with dark background style with 3
Free with trial FAB analysis model infographic template with round box container decrease gradually with dark background style with 3 point for slide presentation vector. Analysis decrease illustrations FAB analysis model infographic template with round box container decrease gradually with dark background style with 3 point for
Free with trial Set line Financial growth, Pie chart infographic, decrease, Server, Data analysis, and icon. Vector. Analysis decrease vectors Set line Financial growth, Pie chart infographic, decrease, Server, Data analysis, and icon. Vector
Free with trial PEST analysis infographic template with dark gradient background style with round vertical box container gradually decrease on right column 4 point for slide presentation vector. Analysis decrease illustrations PEST analysis infographic template with dark gradient background style with round vertical box container gradually decrease on
Free with trial Set Financial growth decrease Server Search data analysis Pie chart infographic cloud computing Browser with exclamation mark Data and icon. Vector. Analysis decrease illustrations Set Financial growth decrease, Server, Search data analysis, Pie chart infographic, cloud computing, Browser with. Set Financial growth decrease Server Search data analysis Pie chart infographic cloud computing Browser with exclamation mark Data and icon. Vector.
Free with trial Set Search data analysis, Pie chart infographic, Calculator, Financial growth decrease, with folder, and icon. Vector. Analysis decrease vectors Set Search data analysis, Pie chart infographic, Calculator, Financial growth decrease, with folder, and icon. Vector
Free with trial Set Data analysis Financial growth decrease Mind map infographic Cloud download and upload Calculator Pie chart and icon. Vector. Analysis decrease illustrations Set Data analysis, Financial growth decrease, Mind map infographic, Cloud download and upload, Calculator, Pie chart and
Free with trial Set line Financial growth decrease, Document with graph chart, Cloud download and upload and Data analysis icon. Vector. Analysis decrease illustrations Set line Financial growth decrease, Document with graph chart, Cloud download and upload and Data analysis icon. Vector
Free with trial Set line Search data analysis Server Cloud download and upload Binary code Financial growth decrease Browser with exclamation mark Data and icon. Vector. Analysis decrease vectors Set line Search data analysis, Server, Cloud download and upload, Binary code, Financial growth decrease, Browser with. Set line Search data analysis Server Cloud download and upload Binary code Financial growth decrease Browser with exclamation mark Data and icon. Vector.
Free with trial Set line Data analysis Financial growth decrease Cloud and shield and Browser with stocks market. Business infographic template. Vector. Analysis decrease illustrations Set line Data analysis, Financial growth decrease, Cloud and shield and Browser with stocks market. Business infographic
Free with trial Set Data analysis Financial growth and decrease on seamless pattern. Vector. Analysis decrease vectors Set Data analysis, Financial growth and decrease on seamless pattern. Vector
Free with trial Set line Financial growth decrease Data analysis Browser with stocks market Pie chart infographic Coal mine trolley and Cloud computing lock icon. Vector. Analysis decrease vectors Set line Financial growth decrease, Data analysis, Browser with stocks market, Pie chart infographic, Coal mine trolley. Set line Financial growth decrease Data analysis Browser with stocks market Pie chart infographic Coal mine trolley and Cloud computing lock icon. Vector.
Free with trial Set Search with folder Financial growth decrease and Data analysis. Business infographic template. Vector. Analysis decrease illustrations Set Search with folder, Financial growth decrease and Data analysis. Business infographic template. Vector
Free with trial Set Data analysis, Financial growth decrease, Search data and Pie chart infographic icon. Vector. Analysis decrease vectors Set Data analysis, Financial growth decrease, Search data and Pie chart infographic icon. Vector
Free with trial Set Pie chart infographic, Financial growth decrease, Data analysis and Search data on seamless pattern. Vector. Analysis decrease illustrations Set Pie chart infographic, Financial growth decrease, Data analysis and Search data on seamless pattern. Vector
Free with trial Set Binary code, Pie chart infographic, Data analysis and Financial growth decrease icon. Vector. Analysis decrease vectors Set Binary code, Pie chart infographic, Data analysis and Financial growth decrease icon. Vector
Free with trial Bar chart with descending bars and dashed arrow illustrating decline in value or trend analysis. Ideal for business, finance, economy, performance, forecasting, data, and growth planning. Simple flat. Analysis decrease illustrations Declining Bar Chart with Dashed Arrow Representing Decrease and Trend Analysis. Bar chart with descending bars and dashed arrow illustrating decline in value or trend analysis. Ideal for business, finance, economy, performance, forecasting, data, and growth planning. Simple flat
Free with trial Isometric banner template showing inflation concept. Vector illustration of financial crisis, rising prices, and money value decrease. Data analysis report with charts and upward arrow for web design. Analysis decrease vectors Inflation And Economic Crisis Data Analysis Isometric Banner Template Vector Illustration. Isometric banner template showing inflation concept. Vector illustration of financial crisis, rising prices, and money value decrease. Data analysis report with charts and upward arrow for web design
Free with trial Economic crisis icon, analysis of global market economy downturn and bankruptcy, vector line symbol. Magnifier and arrow down icon of stock exchange and economical index decrease of financial crisis. Analysis decrease vectors Economic crisis icon, analysis of market downturn. Economic crisis icon, analysis of global market economy downturn and bankruptcy, vector line symbol. Magnifier and arrow down icon of stock exchange and economical index decrease of financial crisis
Free with trial Analysis growing loss graph illustration data visualization, metrics performance, decrease increase analysis growing loss graph. Analysis decrease illustrations Analysis growing loss graph
Free with trial Analysis spiraling line graph illustration curve plot, statistics diagram, increase decrease analysis spiraling line graph. Analysis decrease illustrations Analysis spiraling line graph
Free with trial Analysis stretching line graph illustration chvisualization axis, points curve, increase decrease analysis stretching line graph. Analysis decrease illustrations Analysis stretching line graph
Free with trial An outline icon of a magnifying glass with a minus sign, symbolizing zoom out, reduction, or decreasing view. Useful for editing software, detailed analysis, or visual adjustments. Represents refining focus and broader perspective. Functional and clear vector design, vector design Generative AI. Analysis decrease vectors Minus Magnifying Glass Icon: Zoom Out, Reduce, Decrease, Analysis Tool vector design Generative AI. An outline icon of a magnifying glass with a minus sign, symbolizing zoom out, reduction, or decreasing view. Useful for editing software, detailed analysis, or visual adjustments. Represents refining focus and broader perspective. Functional and clear vector design, vector design Generative AI
Free with trial A clean, minimalist icon representing a decrease of ten percent, symbolized by a down arrow and the -10% sign. Perfect for financial reports, data analysis, or any context requiring a visual representation of decline. Analysis decrease vectors Simple Outline Decrease Percentage Ten Percent Drop Down Arrow Icon. A clean, minimalist icon representing a decrease of ten percent, symbolized by a down arrow and the -10% sign. Perfect for financial reports, data analysis, or any context requiring a visual representation of decline.
Free with trial This image depicts a financial market trend analysis using a candlestick chart. The chart shows the fluctuations in stock prices over a period of time. Each candlestick represents the price movement of a stock within a specific time frame, with green candlesticks indicating an increase in price and red candlesticks indicating a decrease. The vertical lines extending from each candlestick represent. Analysis decrease illustrations Financial market trend analysis
Free with trial Stock market bullish point analysis. This image depicts a stock market chart highlighting a bullish point. The chart shows a trend line indicating an upward trajectory in stock prices over time. Green and red bars represent price movements, with green bars indicating an increase and red bars indicating a decrease. The bullish point is marked with an arrow, suggesting a significant upward movement. Analysis decrease illustrations Stock market bullish point analysis
Free with trial Finance data analytics, decrease graph line icon. Business research report analysis, finance performance analytics or company statistic outline vector icon column infographics and pointing down arrow. Analysis decrease illustrations Finance data analytics, decrease graph line icon
Free with trial Twenty-five colorful icons depict various financial and business concepts related to growth and decline. Each icon combines elements like arrows, charts, coins, and gears in vibrant red, yellow, and blue colors. Labels such as "Chart Focus," "Growth Arrow," "Money Stock," "Market Decline," and "Data Analytics" accompany each icon, suggesting themes of financial analysis and performance metrics. Set against a white background with a maroon accent on the left that reads "Increase Decrease Icons," these symbols visually represent economic trends and business strategies. Analysis decrease vectors Increase Decrease Icon Set - Business Growth Analytics, Up Down Arrows, Charts and Performance Statistics Vector Icons Collection. Twenty-five colorful icons depict various financial and business concepts related to growth and decline. Each icon combines elements like arrows, charts, coins, and gears in vibrant red, yellow, and blue colors. Labels such as "Chart Focus," "Growth Arrow," "Money Stock," "Market Decline," and "Data Analytics" accompany each icon, suggesting themes of financial analysis and performance metrics. Set against a white background with a maroon accent on the left that reads "Increase Decrease Icons," these symbols visually represent economic trends and business strategies.
Free with trial Decline graph chart icon. Descending market stock scheme vector illustration. Decrease statistics symbol. Failing finance data sign. Arrow down economic analysis. Business loss trend. Report diagram. Analysis decrease vectors Decline graph chart icon. Descending market stock scheme vector illustration. Decrease statistics symbol. Failing finance data
Free with trial A minimalist 3D rendered white graph depicting a sharp downward trend with jagged peaks and valleys. The graph is isolated on a white background, casting a subtle shadow. The visual represents a decline or decrease, suitable for concepts related to finance, economics, or data analysis. Analysis decrease illustrations White 3D Jagged Line Graph Showing Decline Isolated on White Background chart decrease. A minimalist 3D rendered white graph depicting a sharp downward trend with jagged peaks and valleys. The graph is isolated on a white background, casting a subtle shadow. The visual represents a decline or decrease, suitable for concepts related to finance, economics, or data analysis
Free with trial This image features a candlestick chart displaying a trend analysis on a white background. The chart includes green and red candlesticks, with a green trend line indicating an upward trend. The candlesticks show price movements over time, with green indicating an increase and red indicating a decrease. Analysis decrease illustrations Candlestick chart trend analysis isolated on white background. This image features a candlestick chart displaying a trend analysis on a white background. The chart includes green and red candlesticks, with a green trend line indicating an upward trend. The candlesticks show price movements over time, with green indicating an increase and red indicating a decrease
Free with trial A businessman's hands interact with a futuristic virtual interface displaying a declining bar chart, symbolizing cost reduction or performance decrease. This central icon is encircled by various business process icons, representing data analysis, management, and strategy. The concept illustrates managing a business downturn, financial crisis, or economic recession through technology and data-driven decisions. It's an ideal visual for topics like risk management, cost optimization, efficiency improvement, and corporate strategy in a challenging economic environment, set against a modern, dark background. Analysis decrease illustrations Business Cost Reduction and Performance Decline Analysis Concept. A businessman's hands interact with a futuristic virtual interface displaying a declining bar chart, symbolizing cost reduction or performance decrease. This central icon is encircled by various business process icons, representing data analysis, management, and strategy. The concept illustrates managing a business downturn, financial crisis, or economic recession through technology and data-driven decisions. It's an ideal visual for topics like risk management, cost optimization, efficiency improvement, and corporate strategy in a challenging economic environment, set against a modern, dark background.
Free with trial This image depicts a bold red downward zigzag arrow, which is commonly used to represent a decline, decrease, or downward trend in various contexts such as finance, data analysis, or general presentations. The arrow has a jagged path, emphasizing the irregular or fluctuating nature of the decline before reaching its final downward point. Analysis decrease illustrations Red downward zigzag arrow indicating a decline or decrease trend. This image depicts a bold red downward zigzag arrow, which is commonly used to represent a decline, decrease, or downward trend in various contexts such as finance, data analysis, or general presentations. The arrow has a jagged path, emphasizing the irregular or fluctuating nature of the decline before reaching its final downward point
Free with trial A straightforward vector illustration of a minus sign. This icon commonly represents subtraction, negative values, reduction, or decrease. Useful for mathematical contexts, data analysis, or any design indicating a reduction or removal, vector design Generative AI. Analysis decrease vectors Simple minus sign icon, subtraction, negative, decrease, reduction, vector design Generative AI. A straightforward vector illustration of a minus sign. This icon commonly represents subtraction, negative values, reduction, or decrease. Useful for mathematical contexts, data analysis, or any design indicating a reduction or removal, vector design Generative AI
Free with trial A concise vector illustration of a red downward trending line graph, indicating an economic downturn or statistical decrease. This graphic is ideal for financial analysis, business reports, performance reviews, or economic forecasts. It clearly represents a decline in data, suitable for analytical and business-oriented designs, vector design Generative AI. Analysis decrease vectors Red downward trend line graph, economic downturn, statistical decrease, vector design Generative AI. A concise vector illustration of a red downward trending line graph, indicating an economic downturn or statistical decrease. This graphic is ideal for financial analysis, business reports, performance reviews, or economic forecasts. It clearly represents a decline in data, suitable for analytical and business-oriented designs, vector design Generative AI
Free with trial This infographic showcases a variety of graphs and charts, including bar graphs, line graphs, and pie charts, in a range of colors such as blue, green, and red. The image represents business data analysis, with arrows indicating growth, increase, and decrease trends. The infographic is a visual representation of market research, economy indicators, and metrics, making it a useful tool for business strategy and planning. Analysis decrease vectors A colorful infographic featuring various graphs and charts to represent business data analysis. This infographic showcases a variety of graphs and charts, including bar graphs, line graphs, and pie charts, in a range of colors such as blue, green, and red. The image represents business data analysis, with arrows indicating growth, increase, and decrease trends. The infographic is a visual representation of market research, economy indicators, and metrics, making it a useful tool for business strategy and planning.
Free with trial Set line Financial growth decrease, Cloud and shield and Search data analysis icon. Vector. Analysis decrease illustrations Set line Financial growth decrease, Cloud and shield and Search data analysis icon. Vector