Free with trial A three-dimensional bar graph composed of translucent blue bars illustrates a significant downward trend. The bars decrease in height from left to right, and a large, transparent blue arrow points downwards, reinforcing the concept of decline. The graph is set against a gradient blue background, creating a sense of depth and focus on the data visualization. Arrow financial growth decrease illustrations A3D Rendered Blue Bar Graph Showing a Downward Trend with a Falling Arrow chart data. A three-dimensional bar graph composed of translucent blue bars illustrates a significant downward trend. The bars decrease in height from left to right, and a large, transparent blue arrow points downwards, reinforcing the concept of decline. The graph is set against a gradient blue background, creating a sense of depth and focus on the data visualization
Free with trial An illustration featuring two contrasting arrows against a plain white background. The red arrow shows a wavy upward trend, symbolizing growth, increase, or positive performance with fluctuation. The black arrow shows a wavy downward trend, symbolizing decline, decrease, or negative performance with fluctuation. This visual concept is often used to represent financial market volatility, business. Arrow financial growth decrease vectors Dynamic business trends illustrated by contrasting red upward and black downward arrows Vector. An illustration featuring two contrasting arrows against a plain white background. The red arrow shows a wavy upward trend, symbolizing growth, increase, or positive performance with fluctuation. The black arrow shows a wavy downward trend, symbolizing decline, decrease, or negative performance with fluctuation. This visual concept is often used to represent financial market volatility, business
Free with trial Negative interest rates in investment financial recession. Crisis monetary policy number below zero growth vector. Arrow financial growth decrease vectors Negative interest rates in investment financial recession. Crisis monetary policy number below zero growth
Free with trial Modern black and white vector icons depicting financial trends like rising, falling, and stable graphs, dollar signs, and investment arrows for business presentations and reports. Arrow financial growth decrease vectors Financial trend icons vector illustration showing profit loss growth and investment flat design. Modern black and white vector icons depicting financial trends like rising, falling, and stable graphs, dollar signs, and investment arrows for business presentations and reports.
Free with trial 3D chart illustration showing a red arrow and decreasing blue bars on a light background, representing loss, decline or negative trend. Arrow financial growth decrease illustrations . 3D chart illustration showing a red arrow and decreasing blue bars on a light background, representing loss, decline or negative trend
Free with trial A bold, red arrow with a zig-zag pattern points downwards, symbolizing a decline or negative trend. The arrow is rendered in a 3D style with subtle shading, giving it depth. It is isolated on a transparent background, making it versatile for various design applications. This graphic is ideal for representing financial losses, market downturns, declining performance, or any concept associated with a downward trajectory. Arrow financial growth decrease illustrations Red Downward Trend Arrow. A bold, red arrow with a zig-zag pattern points downwards, symbolizing a decline or negative trend. The arrow is rendered in a 3D style with subtle shading, giving it depth. It is isolated on a transparent background, making it versatile for various design applications. This graphic is ideal for representing financial losses, market downturns, declining performance, or any concept associated with a downward trajectory.
Free with trial A bold, three-dimensional red arrow forms a jagged downward trend, symbolizing decline, loss, or negative performance. The arrow's sharp angles and bright red color convey urgency and a significant downturn. Isolated on a clean white background, this graphic is versatile for illustrating financial losses, market crashes, declining statistics, or any concept related to a negative trajectory. Its minimalist design makes it suitable for presentations, reports, and digital media. Arrow financial growth decrease illustrations Red Downward Trend Arrow. A bold, three-dimensional red arrow forms a jagged downward trend, symbolizing decline, loss, or negative performance. The arrow's sharp angles and bright red color convey urgency and a significant downturn. Isolated on a clean white background, this graphic is versatile for illustrating financial losses, market crashes, declining statistics, or any concept related to a negative trajectory. Its minimalist design makes it suitable for presentations, reports, and digital media.
Free with trial Frozen icicle bar chart showing a downward trend and frosty arrow. Concept of economic recession or financial crisis. Arrow financial growth decrease illustrations Frozen icicle bar chart showing a downward trend and frosty arrow
Free with trial A flat design vector illustration depicting a financial market data board or stock ticker. The black-bordered display features various stock symbols, numerical values like '$ ,80K', '$ ,22,50', and indicators of market performance. Prominently highlighted in red is the word 'LOSING', accompanied by a red downward arrow signifying a price drop, and a red downward triangle. Conversely, a green upward arrow indicates a price increase. This icon effectively visualizes concepts of financial loss, gain, market volatility, and investment trends, suitable for business, finance, and economic content. Arrow financial growth decrease illustrations Financial Market Data Board Icon with Loss and Gain Indicators. A flat design vector illustration depicting a financial market data board or stock ticker. The black-bordered display features various stock symbols, numerical values like '$ ,80K', '$ ,22,50', and indicators of market performance. Prominently highlighted in red is the word 'LOSING', accompanied by a red downward arrow signifying a price drop, and a red downward triangle. Conversely, a green upward arrow indicates a price increase. This icon effectively visualizes concepts of financial loss, gain, market volatility, and investment trends, suitable for business, finance, and economic content.
Free with trial Economic downturn, financial challenges, loss, stock management, economy, recession. Downward arrow, black briefcase and containers on a shelf. Economic downturn and financial challenges concept. Arrow financial growth decrease vectors Business Decline Concept with Briefcase, Downward Arrow, and Containers on Shelf. Economic downturn, financial challenges, loss, stock management, economy, recession. Downward arrow, black briefcase and containers on a shelf. Economic downturn and financial challenges concept
Free with trial A conceptual vector illustration depicting a severe economic downturn. The image features a grey bar chart with progressively shorter bars, symbolizing declining profits or performance. A bold red arrow points sharply downwards, representing a crash or significant loss, alongside a blue line graph also showing a negative trend. This graphic is ideal for illustrating concepts such as financial crisis, recession, stock market crash, business failure, bankruptcy, and negative growth. Perfect for financial reports, business presentations, news articles, and economic analysis infographics. Arrow financial growth decrease illustrations Economic Downturn and Financial Crisis Graph. A conceptual vector illustration depicting a severe economic downturn. The image features a grey bar chart with progressively shorter bars, symbolizing declining profits or performance. A bold red arrow points sharply downwards, representing a crash or significant loss, alongside a blue line graph also showing a negative trend. This graphic is ideal for illustrating concepts such as financial crisis, recession, stock market crash, business failure, bankruptcy, and negative growth. Perfect for financial reports, business presentations, news articles, and economic analysis infographics.
Free with trial Money increase and decrease icons. Low or high total cost icon. Price, sale, rate or profit going up or down symbol with arrow and dollar sign. Arrow financial growth decrease illustrations Money increase and decrease icons. Low or high total cost icon. Price, sale, rate or profit going up or down symbol
Free with trial Money increase and decrease icons. Low or high total cost icon. Price, sale, rate or profit going up or down symbol with arrow and dollar sign. Arrow financial growth decrease illustrations Money increase and decrease icons. Low or high total cost icon. Price, sale, rate or profit going up or down symbol
Free with trial Money increase and decrease icons. Low or high total cost icon. Price, sale, rate or profit going up or down symbol with arrow and dollar sign. Arrow financial growth decrease illustrations Money increase and decrease icons. Low or high total cost icon. Price, sale, rate or profit going up or down symbol
Free with trial Money increase and decrease icons. Low or high total cost icon. Price, sale, rate or profit going up or down symbol with arrow and dollar sign. Arrow financial growth decrease illustrations Money increase and decrease icons. Low or high total cost icon. Price, sale, rate or profit going up or down symbol
Free with trial Money increase and decrease icons. Low or high total cost icon. Price, sale, rate or profit going up or down symbol with arrow and dollar sign. Arrow financial growth decrease illustrations Money increase and decrease icons. Low or high total cost icon. Price, sale, rate or profit going up or down symbol
Free with trial Money increase and decrease icons. Low or high total cost icon. Price, sale, rate or profit going up or down symbol with arrow and dollar sign. Arrow financial growth decrease illustrations Money increase and decrease icons. Low or high total cost icon. Price, sale, rate or profit going up or down symbol
Free with trial Money increase and decrease icons. Low or high total cost icon. Price, sale, rate or profit going up or down symbol with arrow and dollar sign. Arrow financial growth decrease illustrations Money increase and decrease icons. Low or high total cost icon. Price, sale, rate or profit going up or down symbol
Free with trial Money increase and decrease icons. Low or high total cost icon. Price, sale, rate or profit going up or down symbol with arrow and dollar sign. Arrow financial growth decrease illustrations Money increase and decrease icons. Low or high total cost icon. Price, sale, rate or profit going up or down symbol
Free with trial Money increase and decrease icons. Low or high total cost icon. Price, sale, rate or profit going up or down symbol with arrow and dollar sign. Arrow financial growth decrease illustrations Money increase and decrease icons. Low or high total cost icon. Price, sale, rate or profit going up or down symbol
Free with trial Money increase and decrease icons. Low or high total cost icon. Price, sale, rate or profit going up or down symbol with arrow and dollar sign. Arrow financial growth decrease illustrations Money increase and decrease icons. Low or high total cost icon. Price, sale, rate or profit going up or down symbol
Free with trial Money increase and decrease icons. Low or high total cost icon. Price, sale, rate or profit going up or down symbol with arrow and dollar sign. Arrow financial growth decrease illustrations Money increase and decrease icons. Low or high total cost icon. Price, sale, rate or profit going up or down symbol
Free with trial Three stacks of coins decreasing in height, each topped with a wooden block featuring a black downward arrow, symbolizing financial decline, economic downturn, or decreasing profits against a blue background. Arrow financial growth decrease illustrations Financial Decline Concept with Stacks of Coins and Downward Arrows. Three stacks of coins decreasing in height, each topped with a wooden block featuring a black downward arrow, symbolizing financial decline, economic downturn, or decreasing profits against a blue background
Free with trial This image depicts a bar graph with a clear downward trend. Blue bars decrease in height from left to right, representing a decline in value. A bold red arrow overlays the bars, visually emphasizing the negative trend. A blue line also shows a downward trend. The image conveys a sense of loss, recession, or negative performance and is suitable for illustrating financial or economic concepts. Arrow financial growth decrease illustrations Declining Bar Graph with Downward Trend Lines. This image depicts a bar graph with a clear downward trend. Blue bars decrease in height from left to right, representing a decline in value. A bold red arrow overlays the bars, visually emphasizing the negative trend. A blue line also shows a downward trend. The image conveys a sense of loss, recession, or negative performance and is suitable for illustrating financial or economic concepts.
Free with trial Two distinct bar charts are depicted against a white background. The left chart a downward trend with bars in blue, yellow, and purple, accompanied by a yellow coin with a dollar sign and an arrow pointing down towards it from a small graph indicating a rising trend. The right chart an upward trend with bars in red, green, and blue, and a green coin with a dollar sign connected to a circle with a. Arrow financial growth decrease illustrations Bar charts showing financial growth and decline with dollar symbols. Two distinct bar charts are depicted against a white background. The left chart a downward trend with bars in blue, yellow, and purple, accompanied by a yellow coin with a dollar sign and an arrow pointing down towards it from a small graph indicating a rising trend. The right chart an upward trend with bars in red, green, and blue, and a green coin with a dollar sign connected to a circle with a
Free with trial This vector illustration set features six distinct icons representing key financial and economic concepts. It includes bar charts depicting growth with a green arrow and decline with a red arrow, alongside currency exchange rate indicators for USD, INR, and EUR. Two donut charts visualize data distribution, while a world map colored green and red signifies global market trends or segmentation. Ideal for business presentations, financial reports, economic analysis, and investment-related content, these versatile graphics convey complex data clearly and concisely. Arrow financial growth decrease vectors Financial Growth, Decline, and Global Market Data Visualization Icons Set. This vector illustration set features six distinct icons representing key financial and economic concepts. It includes bar charts depicting growth with a green arrow and decline with a red arrow, alongside currency exchange rate indicators for USD, INR, and EUR. Two donut charts visualize data distribution, while a world map colored green and red signifies global market trends or segmentation. Ideal for business presentations, financial reports, economic analysis, and investment-related content, these versatile graphics convey complex data clearly and concisely.
Free with trial A vibrant red arrow curves downwards, symbolizing a decrease, loss, or negative trajectory in a business or financial context. Arrow financial growth decrease illustrations Red arrow indicating downward trend and decline. A vibrant red arrow curves downwards, symbolizing a decrease, loss, or negative trajectory in a business or financial context
Free with trial The image features a large, golden dollar sign positioned centrally with a red downward arrow on the left and a green upward arrow on the right, symbolizing financial gain and loss. Arrow financial growth decrease illustrations Financial fluctuations: gain and loss represented by arrows and dollar sign. The image features a large, golden dollar sign positioned centrally with a red downward arrow on the left and a green upward arrow on the right, symbolizing financial gain and loss
Free with trial Collection of business growth and financial analysis icons featuring bar charts and arrows with editable line art and flat shape style. Editable vector icon set. Arrow financial growth decrease vectors Collection of business growth and financial analysis icons featuring bar charts and arrows with editable line art and flat shape
Free with trial A woman is working on a laptop analyzing a digital graph that shows cost reduction for a successful business model She is using a pen to focus on the downward trend highlighting the strategy and financial planning for efficiency and growth This highlights digital transformation for effective business analysis and future cost management. Arrow financial growth decrease illustrations Cost Reduction Strategy Digital Transformation Business Analysis and Financial Planning for Success. A woman is working on a laptop analyzing a digital graph that shows cost reduction for a successful business model She is using a pen to focus on the downward trend highlighting the strategy and financial planning for efficiency and growth This highlights digital transformation for effective business analysis and future cost management
Free with trial Three stacks of coins, each topped with a wooden block featuring a downward-pointing arrow, illustrating a concept of financial loss, economic downturn, or decreasing value against a blue background. Arrow financial growth decrease illustrations Decreasing stacks of coins with down arrows symbolizing financial decline. Three stacks of coins, each topped with a wooden block featuring a downward-pointing arrow, illustrating a concept of financial loss, economic downturn, or decreasing value against a blue background
Free with trial A bustling market scene with stalls displaying upward and downward financial trends represented by glowing green and red arrows, symbolizing economic activity. Arrow financial growth decrease illustrations Market stalls with financial growth and decline indicators. A bustling market scene with stalls displaying upward and downward financial trends represented by glowing green and red arrows, symbolizing economic activity
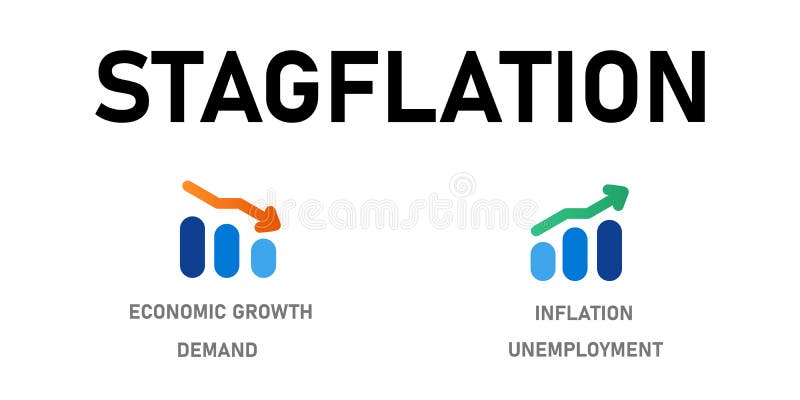
Free with trial Stagflation economic condition with high inflation increase price unemployment but low decrease economic growth and demand chart vector. Arrow financial growth decrease vectors Stagflation economic condition with high inflation increase price unemployment but low decrease economic growth and
Free with trial Finance decrease and crisis graph. Financial crisis, economic recession concept. Employees trying to support falling arrows. Arrow financial growth decrease vectors Finance decrease and crisis graph. Financial crisis, economic recession concept. Employees trying to support falling
Free with trial Illustration shows a stressed businessman with falling arrows and a sad face beside coins and a happy businessman with rising arrows and graphs. Positive financial mood. Generative AI. Arrow financial growth decrease vectors Businessman stressed and happy financial growth comparison vector illustration with coins and charts. Illustration shows a stressed businessman with falling arrows and a sad face beside coins and a happy businessman with rising arrows and graphs. Positive financial mood. Generative AI
Free with trial The background features blurred lights, creating a dramatic effect. financial markets. Arrow financial growth decrease illustrations A red downward arrow symbolizes a decline in financial markets. The background features blurred lights, creating a dramatic effect. financial markets
Free with trial Negative interest rates in investment financial recession. Crisis monetary policy number below zero growth. Businessman deal vector. Arrow financial growth decrease vectors Negative interest rates in investment financial recession. Crisis monetary policy number below zero growth. Businessman
Free with trial Hand pouring water from blue watering can as drops fall towards coin and downward arrow labeled SALE. Ideal for investment, finance tips, sales strategies, growth, marketing, business decline, simple. Arrow financial growth decrease vectors Hand pouring water from watering can onto coin with downward arrow labeled SALE. Hand pouring water from blue watering can as drops fall towards coin and downward arrow labeled SALE. Ideal for investment, finance tips, sales strategies, growth, marketing, business decline, simple
Free with trial Downward arrow pointing alongside a falling dollar coin with a cloud above. Ideal for finance, economics, loss, investment, risk, business, savings, simple flat metaphor. Arrow financial growth decrease vectors Downward Arrow and Dollar Coin Representing Financial Decline or Economic Loss. Downward arrow pointing alongside a falling dollar coin with a cloud above. Ideal for finance, economics, loss, investment, risk, business, savings, simple flat metaphor
Free with trial A visual representation of cost reduction, featuring decreasing stacks of gold coins with wooden blocks spelling COST and a prominent red downward arrow, symbolizing financial savings and efficiency. Arrow financial growth decrease illustrations Cost Reduction Concept with Stacks of Coins and Wooden Blocks Spelling COST with a Downward Arrow. A visual representation of cost reduction, featuring decreasing stacks of gold coins with wooden blocks spelling COST and a prominent red downward arrow, symbolizing financial savings and efficiency
Free with trial A hand holds a glowing blue bar graph with a downward trending arrow and the word COST above. Arrow financial growth decrease illustrations Man holding glowing cost reduction graph with downward arrow chart financial. A hand holds a glowing blue bar graph with a downward trending arrow and the word COST above
Free with trial A red, 3D, zigzagging arrow points downward, symbolizing decline or decrease. The arrow features smooth, glossy surfaces, accentuating its vivid color against a clean white background, creating a striking contrast. This design is often used in financial or analytical contexts to represent falling trends or negative growth. Arrow financial growth decrease vectors Red 3d arrow pointing downward against black background. A red, 3D, zigzagging arrow points downward, symbolizing decline or decrease. The arrow features smooth, glossy surfaces, accentuating its vivid color against a clean white background, creating a striking contrast. This design is often used in financial or analytical contexts to represent falling trends or negative growth.
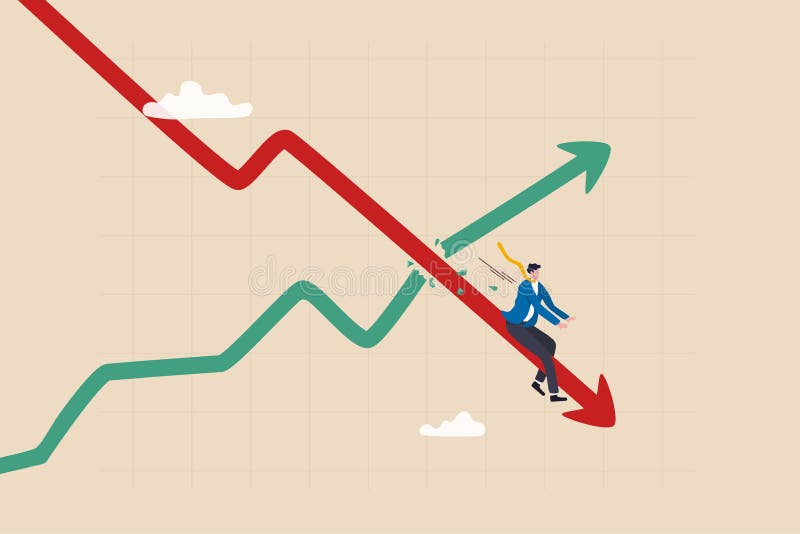
Free with trial Stagflation, economic slow down or recession while inflation high up, GDP growth decrease causing by unemployment concept, fearful businessman riding fall down economic graph with inflation high up. Arrow financial growth decrease vectors Stagflation, economic slow down or recession while inflation high up, GDP growth decrease causing by unemployment concept, fearful
Free with trial Red 3d arrow going down stock icon on white background. Bankruptcy, financial market crash icon for your web site design. chart going down sign. 3d rendering. Vector illustration. Arrow financial growth decrease vectors 3d arrow going down stock icon
Free with trial Colorful line graph illustrating growth and decline over time, with variously colored data points on a dark background, visualizing financial performance and trends. Arrow financial growth decrease vectors Colorful line graph illustrating growth and decline over time, with variously colored data points on a dark background
Free with trial An arrow pointing downward to indicate loss or decrease, isolated on a white background, symbolizing decline in a visual manner. Arrow financial growth decrease illustrations Loss arrow down isolated on white background. An arrow pointing downward to indicate loss or decrease, isolated on a white background, symbolizing decline in a visual manner
Free with trial An arrow pointing downward to indicate loss or decrease, isolated on a white background, symbolizing decline in a visual manner. Arrow financial growth decrease illustrations Loss arrow down isolated on white background. An arrow pointing downward to indicate loss or decrease, isolated on a white background, symbolizing decline in a visual manner
Free with trial This illustration features a collection of five distinct icons representing various financial concepts. From left to right, it shows a Bitcoin symbol with an upward trending graph, an envelope overflowing with cash, a hand holding a gold coin, a calculator with a downward arrow and stacked coins labeled 'Cost Management', and a magnifying glass over a market analysis graph. The icons are stylized with a clean, flat design and vibrant colors, making them ideal for presentations, infographics, and financial content. Arrow financial growth decrease vectors Financial Concepts Icons: Bitcoin Growth, Cash Envelope, Investment, Cost Management, Market Analysis. This illustration features a collection of five distinct icons representing various financial concepts. From left to right, it shows a Bitcoin symbol with an upward trending graph, an envelope overflowing with cash, a hand holding a gold coin, a calculator with a downward arrow and stacked coins labeled 'Cost Management', and a magnifying glass over a market analysis graph. The icons are stylized with a clean, flat design and vibrant colors, making them ideal for presentations, infographics, and financial content.
Free with trial Increase and Decrease Stroke icon collections. Containing Increase, Decrease, Growth, Fall, up, down icons. Editable Stroke icon collections. Arrow financial growth decrease vectors Increase and Decrease Stroke icon collections.
Free with trial Graphic element displays contrasting financial indicators featuring a jagged green arrow pointing up signifying growth alongside a similar red arrow pointing sharply down representing decline or market correction. Arrow financial growth decrease vectors Graphic representation contrasting upward trending market growth with sharp downward trending financial decline. Graphic element displays contrasting financial indicators featuring a jagged green arrow pointing up signifying growth alongside a similar red arrow pointing sharply down representing decline or market correction
Free with trial This striking image depicts a downward arrow crashing through a globe, symbolizing market decline. The glowing red elements evoke urgency in financial analytics. Arrow financial growth decrease illustrations Downward Arrow Crashing Through the Globe Concept. This striking image depicts a downward arrow crashing through a globe, symbolizing market decline. The glowing red elements evoke urgency in financial analytics
Free with trial A collection of black and white icons representing financial concepts such as growth charts, decline arrows, and money symbols, all presented clearly on a plain white background for easy integration i. Arrow financial growth decrease vectors Financial growth and decline icons isolated on transparent background. A collection of black and white icons representing financial concepts such as growth charts, decline arrows, and money symbols, all presented clearly on a plain white background for easy integration i
Free with trial A 3D illustration depicts a financial chart with a downward trend. Four vertical bars, colored yellow, orange, and green, are arranged in descending order of height, suggesting a decline. To the left, a prominent orange circle contains a white downward-pointing arrow, reinforcing the theme of a negative trend or decrease. The entire composition is set against a plain white background. Arrow financial growth decrease illustrations Financial chart with downward trend indicator stock market. A 3D illustration depicts a financial chart with a downward trend. Four vertical bars, colored yellow, orange, and green, are arranged in descending order of height, suggesting a decline. To the left, a prominent orange circle contains a white downward-pointing arrow, reinforcing the theme of a negative trend or decrease. The entire composition is set against a plain white background
Free with trial Bitcoin rate and falling icon with down arrow. Exchange indicating growth and a drop in prices and profits. Concept of purchase of cryptocurrency or paying online service. Vector Illustration. Arrow financial growth decrease vectors Bitcoin rate and falling icon with down arrow. Exchange indicating growth and a drop in prices and profits. Concept of purchase of
Free with trial Bitcoin rate and falling icon with down arrow. Exchange indicating growth and a drop in prices and profits. Concept of purchase of cryptocurrency or paying online service. Vector Illustration. Arrow financial growth decrease vectors Bitcoin rate and falling icon with down arrow. Exchange indicating growth and a drop in prices and profits. Concept of purchase of
Free with trial Financial risk icons. Decrease icon set. Vector illustration isolated on white background. Arrow financial growth decrease illustrations Financial risk icons
Free with trial Laptop displays a money bag graphic surrounded by upward and downward arrows, suggesting potential investment changes, great for illustrating financial concepts. Arrow financial growth decrease illustrations Money Bag on Laptop Screen with Arrows Showing Financial Growth. Laptop displays a money bag graphic surrounded by upward and downward arrows, suggesting potential investment changes, great for illustrating financial concepts
Free with trial A flat, cartoon-style line graph on a white grid background shows a green upward-pointing arrow representing growth and a red downward-pointing arrow indicating decline, with a red dollar sign placed atop the green arrow to symbolize financial gain, illustrating contrasting economic trends in a simplified, visually engaging manner ideal for business, finance, and investment-related content that. Arrow financial growth decrease illustrations Upward and downward financial trend with green and red arrows on grid graph. A flat, cartoon-style line graph on a white grid background shows a green upward-pointing arrow representing growth and a red downward-pointing arrow indicating decline, with a red dollar sign placed atop the green arrow to symbolize financial gain, illustrating contrasting economic trends in a simplified, visually engaging manner ideal for business, finance, and investment-related content that
Free with trial A conceptual vector illustration depicting the duality of business performance. On a modern teal background, two reports are shown side-by-side. One features a rising red graph symbolizing growth, profit, and success, while the other displays a descending graph representing decline, loss, and failure. This flat design graphic is ideal for financial analysis, market trend comparisons, business presentations, and infographics illustrating opposite outcomes or strategic choices. The long shadow effect adds a contemporary feel to the design. Arrow financial growth decrease vectors Growth and Decline Business Charts Comparison. A conceptual vector illustration depicting the duality of business performance. On a modern teal background, two reports are shown side-by-side. One features a rising red graph symbolizing growth, profit, and success, while the other displays a descending graph representing decline, loss, and failure. This flat design graphic is ideal for financial analysis, market trend comparisons, business presentations, and infographics illustrating opposite outcomes or strategic choices. The long shadow effect adds a contemporary feel to the design.
Free with trial Economic recession, financial crisis or stock market crash concept with injured businessman investor or business owner. Red down arrow. Vector illustration. Arrow financial growth decrease vectors Economic recession, financial crisis
Free with trial Two gold coins, one with green upward arrow symbol for growth, other with red downward arrow symbol for decline, white background. Arrow financial growth decrease vectors Two gold coins, one with green up arrow, other with red down arrow. Two gold coins, one with green upward arrow symbol for growth, other with red downward arrow symbol for decline, white background
Free with trial A vibrant and playful collection of hand-drawn financial and business icons. The set includes a bar graph, gold bars, a downward arrow, calculators, a smiley face, and cartoon dollar bills. These icons are perfect for illustrating concepts related to finance, economics, investment, and business growth. The simple and cheerful design makes them ideal for educational materials, presentations, and websites. Arrow financial growth decrease vectors Finance and Business Icons Set. A vibrant and playful collection of hand-drawn financial and business icons. The set includes a bar graph, gold bars, a downward arrow, calculators, a smiley face, and cartoon dollar bills. These icons are perfect for illustrating concepts related to finance, economics, investment, and business growth. The simple and cheerful design makes them ideal for educational materials, presentations, and websites.
Free with trial A flat design illustration featuring a golden euro coin prominently displayed against a white background. Two gray arrows flank the coin: one pointing upwards, symbolizing growth or increase, and another pointing downwards, representing decline or decrease. This graphic effectively visualizes concepts related to currency fluctuations, financial markets, and economic trends of the Euro. Arrow financial growth decrease vectors Euro Coin with Up and Down Arrows. A flat design illustration featuring a golden euro coin prominently displayed against a white background. Two gray arrows. A flat design illustration featuring a golden euro coin prominently displayed against a white background. Two gray arrows flank the coin: one pointing upwards, symbolizing growth or increase, and another pointing downwards, representing decline or decrease. This graphic effectively visualizes concepts related to currency fluctuations, financial markets, and economic trends of the Euro.
Free with trial A visual representation of economic downturn and falling interest rates, with stacks of coins decreasing in height and a downward trending arrow indicating a decline in financial value and market performance. Arrow financial growth decrease illustrations Decreasing interest rates and economic recession represented by stacked coins and a downward arrow with percentage symbols. A visual representation of economic downturn and falling interest rates, with stacks of coins decreasing in height and a downward trending arrow indicating a decline in financial value and market performance
Free with trial A 3D line graph showing a downward trend with a red arrow pointing downwards, indicating a decline in data or financial performance. The graph is set against a grid background with a professional and ultra-detailed quality. Arrow financial growth decrease illustrations Downward Trend Graph with Red Arrow. A 3D line graph showing a downward trend with a red arrow pointing downwards, indicating a decline in data or financial performance. The graph is set against a grid background with a professional and ultra-detailed quality.
Free with trial This graphic features a stylized bar chart with a descending red arrow, symbolizing a downward trend. The image is presented in a split design, with the left side on a white background and the right side on a red background. This visual metaphor is ideal for representing financial losses, declining performance, economic downturns, or any situation indicating a negative trajectory. Its clean, minimalist style makes it versatile for various business, financial, and analytical contexts. Arrow financial growth decrease illustrations Red Downward Trend Graph with Arrow. This graphic features a stylized bar chart with a descending red arrow, symbolizing a downward trend. The image is presented in a split design, with the left side on a white background and the right side on a red background. This visual metaphor is ideal for representing financial losses, declining performance, economic downturns, or any situation indicating a negative trajectory. Its clean, minimalist style makes it versatile for various business, financial, and analytical contexts.
Free with trial Visualizing cost reduction with stacked coins and a downward arrow. A concept showing financial challenges, expense management, and the importance of strategic planning for business success. Arrow financial growth decrease illustrations Cost reduction strategies and expense management tips for business to improve profitability growth. visualizing cost reduction with stacked coins and a downward arrow. A concept showing financial challenges, expense management, and the importance of strategic planning for business success.
Free with trial A hand's finger pushes a bright yellow arrow downwards, directly onto a bar graph displaying a significant decrease. This image symbolizes financial decline and negative business trends. Arrow financial growth decrease illustrations Hand pushing down yellow arrow on declining business financial graph chart showing negative growth. A hand's finger pushes a bright yellow arrow downwards, directly onto a bar graph displaying a significant decrease. This image symbolizes financial decline and negative business trends
Free with trial A striking 3D render features a prominent, glossy red arrow pointing downwards, symbolizing a decline, loss, or negative trend. This arrow is positioned in the foreground, partially obscuring a bright, modern office interior. The office space includes desks, chairs, plants, and overhead lighting, suggesting a corporate or business environment. The image effectively conveys concepts such as economic recession, stock market crash, business failure, or a downward trend in performance. It is ideal for illustrating financial reports, business news, or any content related to negative business outcomes. Arrow financial growth decrease illustrations Red Downward Arrow Symbolizing Business Decline in Modern Office. A striking 3D render features a prominent, glossy red arrow pointing downwards, symbolizing a decline, loss, or negative trend. This arrow is positioned in the foreground, partially obscuring a bright, modern office interior. The office space includes desks, chairs, plants, and overhead lighting, suggesting a corporate or business environment. The image effectively conveys concepts such as economic recession, stock market crash, business failure, or a downward trend in performance. It is ideal for illustrating financial reports, business news, or any content related to negative business outcomes.
Free with trial A bold, three-dimensional blue arrow is depicted pointing downwards and to the right, indicating a downward trend. The arrow has a sharp, angular design, suggesting a sharp decline or a significant drop. It is presented in isolation against a clean white background, making it a clear and direct visual representation of negative movement, loss, or a declining trend in various contexts such as. Arrow financial growth decrease illustrations Blue downward trending arrow on white background decline decrease. A bold, three-dimensional blue arrow is depicted pointing downwards and to the right, indicating a downward trend. The arrow has a sharp, angular design, suggesting a sharp decline or a significant drop. It is presented in isolation against a clean white background, making it a clear and direct visual representation of negative movement, loss, or a declining trend in various contexts such as
Free with trial A polished, metallic golden arrow is depicted curving downwards against a clean white background. The arrow has a sharp point and a smooth, reflective surface, suggesting a concept of decline, decrease, or a negative trend. Its isolated presentation makes it suitable for representing financial or economic downturns. Arrow financial growth decrease illustrations Shiny golden arrow curving downwards on a white background metallic. A polished, metallic golden arrow is depicted curving downwards against a clean white background. The arrow has a sharp point and a smooth, reflective surface, suggesting a concept of decline, decrease, or a negative trend. Its isolated presentation makes it suitable for representing financial or economic downturns
Free with trial Concept image of a jagged downward arrow hitting black liquid with ripples, representing market crash, financial loss, or economic decline. Generative AI. Arrow financial growth decrease illustrations Zigzag Arrow Falling Into Dark Liquid Surface. Concept image of a jagged downward arrow hitting black liquid with ripples, representing market crash, financial loss, or economic decline. Generative AI
Free with trial This vibrant 3D bar graph features various colorful bars with an upward arrow, symbolizing growth and success in financial and business metrics Generative Ai. Arrow financial growth decrease illustrations Colorful 3D Bar Graph Showing Growth with Upward Arrow Design. This vibrant 3D bar graph features various colorful bars with an upward arrow, symbolizing growth and success in financial and business metrics Generative Ai
Free with trial A flat-style illustration depicting a falling bar graph, combined with a sad face emoji and recovery arrow for financial analysis. Arrow financial growth decrease vectors Decreasing bar graph with sad face emoji and upwards arrow showing potential recovery. A flat-style illustration depicting a falling bar graph, combined with a sad face emoji and recovery arrow for financial analysis.
Free with trial Illustration of a growing budget efficiency with a simple money bag closing tightly, a stylized downward-pointing cost arrow, and a stream of saved coins. Vector flat icon design on a white background for a cost control illustration --chaos 30 --ar 16:9 --v 7 Job ID: 35adf769-e45b-43cf-a8e7-0b2af69479b3. Arrow financial growth decrease illustrations Money Bag Downward Arrow, Financial Crisis, Economic Downturn, Falling Value. Illustration of a growing budget efficiency with a simple money bag closing tightly, a stylized downward-pointing cost arrow, and a stream of saved coins. Vector flat icon design on a white background for a cost control illustration --chaos 30 --ar 16:9 --v 7 Job ID: 35adf769-e45b-43cf-a8e7-0b2af69479b3
Free with trial This illustration visually compares the financial implications of renting versus buying a home. The left side depicts a 'RENT' sign with downward arrows indicating decreasing value or cost, while the right side shows a 'BUY' sign with upward arrows symbolizing increasing property value and investment growth. It's an ideal graphic for discussing real estate decisions, housing market analysis, and personal finance strategies. Arrow financial growth decrease illustrations Rent vs Buy Home Decision Real Estate Investment, Property Market Comparison, Housing Financial Choice. This illustration visually compares the financial implications of renting versus buying a home. The left side depicts a 'RENT' sign with downward arrows indicating decreasing value or cost, while the right side shows a 'BUY' sign with upward arrows symbolizing increasing property value and investment growth. It's an ideal graphic for discussing real estate decisions, housing market analysis, and personal finance strategies.
Free with trial This image features four distinct icons representing financial performance indicators. The top left icon shows a green percentage symbol with an upward arrow, indicating growth or increase. The top right icon displays a red percentage symbol with a downward arrow, symbolizing decline or decrease. The bottom left icon illustrates a series of green bar graphs, indicating positive trends or growth. Arrow financial growth decrease illustrations Financial performance indicators
Free with trial A striking 3D rendered red arrow pointing downwards, with a percentage symbol integrated into its design. The arrow is sharp and glossy, casting a subtle shadow on the clean white background. This graphic visually represents concepts such as price reduction, sales, economic decline, or negative financial trends. Arrow financial growth decrease illustrations Red 3D Percentage Symbol Arrow Pointing Downward on a White Background down arrow. A striking 3D rendered red arrow pointing downwards, with a percentage symbol integrated into its design. The arrow is sharp and glossy, casting a subtle shadow on the clean white background. This graphic visually represents concepts such as price reduction, sales, economic decline, or negative financial trends
Free with trial A black icon depicting a bar graph with three bars of decreasing height, representing a downward trend. A black arrow points diagonally downwards from the top right, indicating a decline. The icon is enclosed within a black circle and set against a white background. Arrow financial growth decrease illustrations Black Downward Trend Bar Graph Icon with Arrow Inside Circle chart decrease. A black icon depicting a bar graph with three bars of decreasing height, representing a downward trend. A black arrow points diagonally downwards from the top right, indicating a decline. The icon is enclosed within a black circle and set against a white background
Free with trial Decline, growth, success, recession business flat concept illustration. Graphs depict increase and decrease business. Vector template element for infographic, web, presentation, social networks. Arrow financial growth decrease vectors Recession, decline, growth, increase, success business arrows. F. Decline, growth, success, recession business flat concept illustration. Graphs depict increase and decrease business. Vector template element for infographic, web, presentation, social networks.