Free with trial Up and Down sign with green and red arrows vector illustration. Concept of sales bar chart symbol icon with arrow moving down and sales bar chart with arrow moving up. Arrow financial growth decrease vectors Up and Down sign with green and red arrows vector illustration. Concept of sales bar chart symbol icon with arrows. Up and Down sign with green and red arrows vector illustration. Concept of sales bar chart symbol icon with arrow moving down and sales bar chart with arrow moving up.
Free with trial Bright blue arrow points downward, signifying a drop in value above shiny gold coins. Arrow financial growth decrease illustrations Money falling down towards golden coins in a minimalistic setting. Bright blue arrow points downward, signifying a drop in value above shiny gold coins
Free with trial Elevate your everyday style with Abu Taher's collection of Typography T-Shirt Designs, where words meet artistry. Arrow financial growth decrease vectors Collection of 32 icons representing increase and decrease in business and finance. Elevate your everyday style with Abu Taher's collection of Typography T-Shirt Designs, where words meet artistry
Free with trial Business refers to the organized efforts and activities of individuals or groups to produce, buy, sell, and exchange goods or services for profit. Arrow financial growth decrease illustrations The Arrow down and coins for Business concept 3d rendering. Business refers to the organized efforts and activities of individuals or groups to produce, buy, sell, and exchange goods or services for profit
Free with trial Business refers to the organized efforts and activities of individuals or groups to produce, buy, sell, and exchange goods or services for profit. Arrow financial growth decrease illustrations The Arrow down and coins for Business concept 3d rendering. Business refers to the organized efforts and activities of individuals or groups to produce, buy, sell, and exchange goods or services for profit
Free with trial Business refers to the organized efforts and activities of individuals or groups to produce, buy, sell, and exchange goods or services for profit. Arrow financial growth decrease illustrations The Arrow down and coins for Business concept 3d rendering. Business refers to the organized efforts and activities of individuals or groups to produce, buy, sell, and exchange goods or services for profit
Free with trial Business refers to the organized efforts and activities of individuals or groups to produce, buy, sell, and exchange goods or services for profit. Arrow financial growth decrease illustrations The Arrow down and coins for Business concept 3d rendering. Business refers to the organized efforts and activities of individuals or groups to produce, buy, sell, and exchange goods or services for profit
Free with trial Business refers to the organized efforts and activities of individuals or groups to produce, buy, sell, and exchange goods or services for profit. Arrow financial growth decrease illustrations The Arrow down and coins for Business concept 3d rendering. Business refers to the organized efforts and activities of individuals or groups to produce, buy, sell, and exchange goods or services for profit
Free with trial Business refers to the organized efforts and activities of individuals or groups to produce, buy, sell, and exchange goods or services for profit. Arrow financial growth decrease illustrations The Arrow down and coins for Business concept 3d rendering. Business refers to the organized efforts and activities of individuals or groups to produce, buy, sell, and exchange goods or services for profit
Free with trial Business refers to the organized efforts and activities of individuals or groups to produce, buy, sell, and exchange goods or services for profit. Arrow financial growth decrease illustrations The Arrow down and coins for Business concept 3d rendering. Business refers to the organized efforts and activities of individuals or groups to produce, buy, sell, and exchange goods or services for profit
Free with trial Business refers to the organized efforts and activities of individuals or groups to produce, buy, sell, and exchange goods or services for profit. Arrow financial growth decrease illustrations The Arrow down and coins for Business concept 3d rendering. Business refers to the organized efforts and activities of individuals or groups to produce, buy, sell, and exchange goods or services for profit
Free with trial Reduction chart icon Vector symbol or sign set collection in black and white outline. Arrow financial growth decrease vectors Decline Chart Icon Illustrating Decrease in Performance, Economic Downturn, and Analytical Data. Reduction chart icon Vector symbol or sign set collection in black and white outline
Free with trial Graph chart infographic report set with statistic arrow data elements for financial market analysis and planning in business performance research for your illustration. Arrow financial growth decrease vectors Graph chart infographic report set
Free with trial Graph chart infographic report set with statistic arrow data elements for financial market analysis and planning in business performance research for your illustration. Arrow financial growth decrease vectors Graph chart infographic report set
Free with trial Graph chart infographic report set with statistic arrow data elements for financial market analysis and planning in business performance research for your illustration. Arrow financial growth decrease vectors Graph chart infographic report set
Free with trial A minimalist bar chart with a descending line graph overlay, symbolizing financial loss, performance decline, or negative data trends. Ideal for presentations, dashboards, economic reports, and warning visuals. Arrow financial growth decrease vectors Downward Trend Bar Chart Icon. A minimalist bar chart with a descending line graph overlay, symbolizing financial loss, performance decline, or negative data trends. Ideal for presentations, dashboards, economic reports, and warning visuals
Free with trial Candlestick Chart vector Professional Financial Trading concept icon or symbol. Arrow financial growth decrease vectors Candlestick Chart vector Professional Financial Trading icon or symbol
Free with trial Two 3D arrows, one red pointing down and one green pointing up, symbolizing contrasting financial trends or data analysis. Visual representation of market fluctuations. Arrow financial growth decrease illustrations Arrow chart up and down on. Two 3D arrows, one red pointing down and one green pointing up, symbolizing contrasting financial trends or data analysis. Visual representation of market fluctuations
Free with trial This 3D rendering shows a circular arrangement of red arrows pointing downwards, illustrating a negative trend. The image is generated by AI and is perfect for representing concepts like market decline, economic downturn, or loss. Arrow financial growth decrease illustrations Circular Red Downward Arrow. This 3D rendering shows a circular arrangement of red arrows pointing downwards, illustrating a negative trend. The image is generated by AI and is perfect for representing concepts like market decline, economic downturn, or loss.
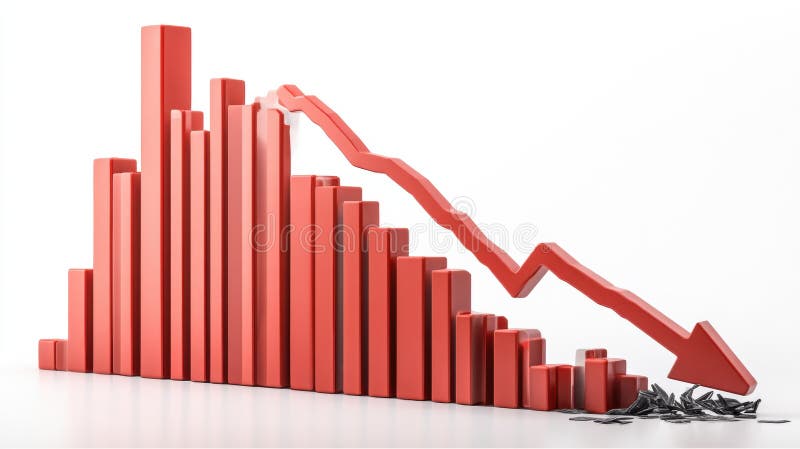
Free with trial A 3D rendering of a bar graph depicting a sharp decline in values. The red bars decrease in size, culminating in a large downward red arrow, symbolizing a significant economic downturn or market crash. The broken pieces at the bottom represent the loss or damage incurred. Arrow financial growth decrease illustrations Red Bar Graph Showing Decline. A 3D rendering of a bar graph depicting a sharp decline in values. The red bars decrease in size, culminating in a large downward red arrow, symbolizing a significant economic downturn or market crash. The broken pieces at the bottom represent the loss or damage incurred.
Free with trial A businessman in a suit interacts with a digital interface illustrating the relationship between quality and cost. The image features a visual representation of increasing quality and decreasing cost, with checkmarks indicating positive outcomes. This concept is ideal for illustrating business strategies, efficiency, and financial planning. The scene includes a clipboard with charts, adding a professional context. Arrow financial growth decrease illustrations Quality vs. Cost: Business Concept. A businessman in a suit interacts with a digital interface illustrating the relationship between quality and cost. The image features a visual representation of increasing quality and decreasing cost, with checkmarks indicating positive outcomes. This concept is ideal for illustrating business strategies, efficiency, and financial planning. The scene includes a clipboard with charts, adding a professional context.
Free with trial A close-up shot of wooden blocks arranged to form a small graph, illustrating an interest rate. The blocks are textured and have percentage symbols and directional arrows carved into them. The image has a dark, moody feel and evokes concepts of finance, economics, and growth or decline. Arrow financial growth decrease illustrations Wooden blocks interest rate graph. A close-up shot of wooden blocks arranged to form a small graph, illustrating an interest rate. The blocks are textured and have percentage symbols and directional arrows carved into them. The image has a dark, moody feel and evokes concepts of finance, economics, and growth or decline
Free with trial A hand places a Bitcoin into a piggy bank, symbolizing cryptocurrency investment. The upward arrow and growing bar graph illustrate increasing value, a visual representation of potential returns generated by AI. Arrow financial growth decrease illustrations Bitcoin Piggy Bank Savings Growth. A hand places a Bitcoin into a piggy bank, symbolizing cryptocurrency investment. The upward arrow and growing bar graph illustrate increasing value, a visual representation of potential returns generated by AI.
Free with trial A worrying business report showing a sharp decline, generated by AI, rests on a wooden desk in an office setting. The red graph line dramatically falls, symbolizing potential losses or market downturn. This AI-generated image is perfect for illustrating financial instability or economic crisis. Arrow financial growth decrease illustrations Declining Business Graph. A worrying business report showing a sharp decline, generated by AI, rests on a wooden desk in an office setting. The red graph line dramatically falls, symbolizing potential losses or market downturn. This AI-generated image is perfect for illustrating financial instability or economic crisis.
Free with trial High-Quality Vector Icons. Arrow financial growth decrease illustrations Decrease icon vector, filled. High-Quality Vector Icons
Free with trial Downward Trend Financial Graph Illustration. Arrow financial growth decrease vectors Downward Trend Financial Graph Illustration
Free with trial The image shows a downward trending line, illuminated with a bright blue glow, resembling a graph or chart. the line starts high on the left and descends diagonally to the lower right, ending in an arrow pointing downwards. the background is a dark, metallic texture, lit by several spotlights from above, creating a dramatic effect. the floor reflects the blue light, adding depth to the scene. the overall impression is one of decline or failure, possibly related to business or finance. Arrow financial growth decrease illustrations Declining trend line with arrow in spotlight. the image shows a downward trending line, illuminated with a bright blue glow, resembling a graph or chart. the line starts high on the left and descends diagonally to the lower right, ending in an arrow pointing downwards. the background is a dark, metallic texture, lit by several spotlights from above, creating a dramatic effect. the floor reflects the blue light, adding depth to the scene. the overall impression is one of decline or failure, possibly related to business or finance.
Free with trial Red arrow pointing down and the word down illuminated on a digital stock ticker display, indicating a market downturn. Arrow financial growth decrease illustrations Stock market crash showing downward trend on digital display. Red arrow pointing down and the word down illuminated on a digital stock ticker display, indicating a market downturn
Free with trial BALANCE BETWEEN THE DOLLAR AND THE EURO CURRENCY - Dollar against euro concept - Futuristic stock market background with charts, numbers, and financial trends. Arrow financial growth decrease illustrations BALANCE BETWEEN THE DOLLAR AND THE EURO CURRENCY - Dollar against euro concept - Futuristic stock market background
Free with trial A visual representation of declining interest rates, depicted by stacks of coins with percentage dice and a downward trending red arrow, symbolizing economic downturn. Arrow financial growth decrease illustrations Falling interest rates shown by dice and coins. A visual representation of declining interest rates, depicted by stacks of coins with percentage dice and a downward trending red arrow, symbolizing economic downturn
Free with trial Hand holding coin with arrows symbolizing increasing and decreasing value. Suitable for financial growth concepts in presentations, articles, and ads. Arrow financial growth decrease vectors Hand holding coin with arrows symbolizing increasing and decreasing value
Free with trial Business graphic chart line, round and candlestick graph trend with glassmorphism effect. Transparent blur glass on gradient arrow vector set. Financial diagram on black. Marketing analytics. Arrow financial growth decrease illustrations Business graphic chart line round and candlestick graph trend with glassmorphism effect vector set, arrows on black. Business graphic chart line, round and candlestick graph trend with glassmorphism effect. Transparent blur glass on gradient arrow vector set. Financial diagram on black. Marketing analytics
Free with trial Businessman stick figure character in suit standing front of downward trend graph chart. concerned situation. Business failure, crisis, bankruptcy, down negative arrow. hand drawn doodle illustration. Arrow financial growth decrease vectors Businessman stick figure character in suit standing front of downward trend graph chart. concerned situation. Business failure
Free with trial , Applied for Info Graphics, Design Elements, Websites, Presentations, and Application - Vector. Arrow financial growth decrease illustrations Decrease Icon. Down Symbol within Glyph Style - Vector. , Applied for Info Graphics, Design Elements, Websites, Presentations, and Application - Vector.
Free with trial Concept of money circulation, income and expenses, financial crisis and bankruptcy. Arrow financial growth decrease illustrations Dollar bill cashflow with up and down arrows rotating around it. Concept of money circulation, income and expenses, financial crisis and bankruptcy
Free with trial Stacks of coins with a dollar sign coin, a carbon footprint labeled CO2, and a downward arrow. Ideal for sustainability, finance, eco-friendly economics, climate action, carbon reduction, green. Arrow financial growth decrease vectors Reducing Carbon Emissions with Cost Efficiency and Financial Savings. Stacks of coins with a dollar sign coin, a carbon footprint labeled CO2, and a downward arrow. Ideal for sustainability, finance, eco-friendly economics, climate action, carbon reduction, green
Free with trial Abstract pixel dotted arrows falling down on dark background, representing economic crisis, investment loss, negative growth, and digital finance instability. Arrow financial growth decrease illustrations Digital dotted arrows pointing downward in glowing red light, symbolizing stock crash, market decline, financial risk, and. Abstract pixel dotted arrows falling down on dark background, representing economic crisis, investment loss, negative growth, and digital finance instability
Free with trial This striking image depicts a 3D rendering of a sharply declining graph, generated by AI, symbolizing a market crash or economic downturn. The red arrow dramatically plunges downwards against a blurred background of white building silhouettes, visually representing the severity of the economic decl. Arrow financial growth decrease illustrations AI-Generated Market Crash Visualization. This striking image depicts a 3D rendering of a sharply declining graph, generated by AI, symbolizing a market crash or economic downturn. The red arrow dramatically plunges downwards against a blurred background of white building silhouettes, visually representing the severity of the economic decl
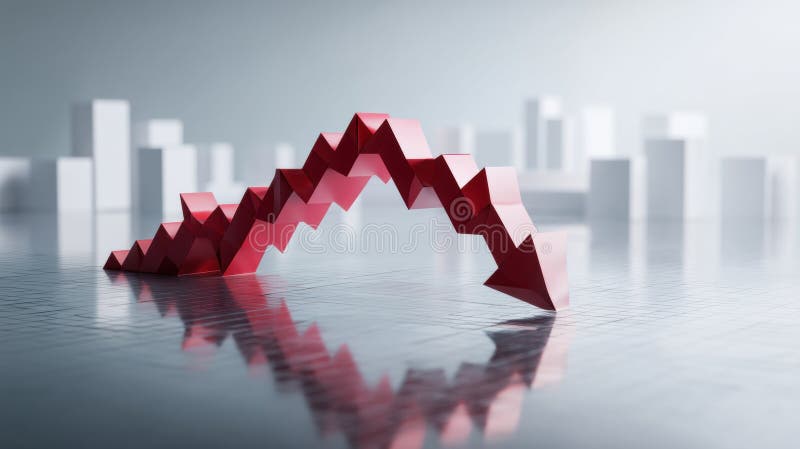
Free with trial This striking image depicts a 3D rendering of a dramatic market downturn, generated by AI. The red, origami-style arrow plunges downwards, contrasting sharply with the clean, minimalist background. The visual emphasizes the severity of the economic decline. Arrow financial growth decrease illustrations AI-Generated Market Crash Visualization. This striking image depicts a 3D rendering of a dramatic market downturn, generated by AI. The red, origami-style arrow plunges downwards, contrasting sharply with the clean, minimalist background. The visual emphasizes the severity of the economic decline.
Free with trial Abstract graphic showing currency symbols and arrows to visually represent financial market changes and exchange rate fluctuations Ideal for illustrating finance topics. Arrow financial growth decrease illustrations Currency Exchange Rate Fluctuations Abstract Graphic. Abstract graphic showing currency symbols and arrows to visually represent financial market changes and exchange rate fluctuations Ideal for illustrating finance topics
Free with trial A blackboard with a graph on it and a potted plant next to it. The graph shows a downward trend, which could represent a decrease in sales or a decline in a particular stock. Arrow financial growth decrease illustrations A blackboard with a graph on it and a potted plant next to it
Free with trial Financial crisis business market. Currency risk. White background with 3D red button for global inflation concept. Arrow financial growth decrease illustrations 3D illustration of red button switching on global inflation. Financial crisis business market. Currency risk. White background with 3D red button for global inflation concept.
Free with trial A businessman in a suit draws a red downward trend line over a bar graph, illustrating cost reduction and financial decline. Arrow financial growth decrease illustrations Businessman Drawing a Downward Trend Line on a Cost Graph. A businessman in a suit draws a red downward trend line over a bar graph, illustrating cost reduction and financial decline
Free with trial Simple line art illustration of a bar graph with a downward trend, symbolizing negative growth. Arrow financial growth decrease illustrations Declining bar graph showing negative trend with arrow pointing down. Simple line art illustration of a bar graph with a downward trend, symbolizing negative growth
Free with trial Falling interest rates concept, with stacked coins and a percentage sign alongside a red downward arrow. Arrow financial growth decrease illustrations Declining interest rates with coins and percentage symbol. Falling interest rates concept, with stacked coins and a percentage sign alongside a red downward arrow.
Free with trial Two bar charts are displayed side by side. One shows a clear upward trend with a green arrow, while the other shows a downward trend with a red arrow. Arrow financial growth decrease illustrations Bar charts showing contrasting upward and downward trends. Two bar charts are displayed side by side. One shows a clear upward trend with a green arrow, while the other shows a downward trend with a red arrow
Free with trial Two bar charts, one green showing growth and one red showing decline, with trend lines and arrows. Arrow financial growth decrease illustrations Bar charts showing upward and downward trends. Two bar charts, one green showing growth and one red showing decline, with trend lines and arrows
Free with trial Profit and loss concept. Businessmen run with briefcases on the upward growth and downward recession charts. Arrow financial growth decrease vectors Profit and loss concept. Businessmen run on the up and down arrows. Profit and loss concept. Businessmen run with briefcases on the upward growth and downward recession charts
Free with trial Downward arrow with SALE, analytics dashboard, and a cloud icon. Ideal for ecommerce, marketing, analysis, cloud services, business strategy, financial review simple landing page. Arrow financial growth decrease vectors Sales Decline with Data Analytics and Cloud Connectivity for Business Insights. Downward arrow with SALE, analytics dashboard, and a cloud icon. Ideal for ecommerce, marketing, analysis, cloud services, business strategy, financial review simple landing page
Free with trial Black and white icon of a dollar banknote with one arrow pointing up and one arrow pointing down, representing money transfer. Arrow financial growth decrease vectors Dollar banknote with up and down arrows icon representing money transfer. Black and white icon of a dollar banknote with one arrow pointing up and one arrow pointing down, representing money transfer
Free with trial A 3D bar graph with a red line graph indicating a significant decrease, isolated on a clean white background. Arrow financial growth decrease illustrations Bar graph showing downward trend isolated on white background. A 3D bar graph with a red line graph indicating a significant decrease, isolated on a clean white background
Free with trial A Vector Dollar Up Icon Symbol represents an increase in value, price, or positive movement in financial markets, often associated with economic growth or profit. This symbol is commonly used in financial contexts to indicate a rise in currency value or favorable trends. Arrow financial growth decrease vectors Vector Dollar Up Icon Symbol
Free with trial A visual representation of negative financial performance, illustrating a declining trend in business or market data with a prominent red arrow indicating a downward movement. Arrow financial growth decrease illustrations Bar chart showing a downward trend with a red arrow. A visual representation of negative financial performance, illustrating a declining trend in business or market data with a prominent red arrow indicating a downward movement
Free with trial A hand-drawn graph displays a significant downturn, visually depicting economic decline or financial loss. This simplistic illustration can be used to represent business failure, market risk, or a negative trend in various financial and economic analyses. Arrow financial growth decrease illustrations Hand Drawn Graph Showing a Downturn Representing Economic Decline. A hand-drawn graph displays a significant downturn, visually depicting economic decline or financial loss. This simplistic illustration can be used to represent business failure, market risk, or a negative trend in various financial and economic analyses
Free with trial A hand holding a pen traces a red downward trending stock market chart, symbolizing a bear market or financial downturn. The background shows stock data. Arrow financial growth decrease illustrations Bear Market Analysis: Hand with Pen Tracing a Declining Stock Chart. A hand holding a pen traces a red downward trending stock market chart, symbolizing a bear market or financial downturn. The background shows stock data
Free with trial Circular arrows and down arrow with percent symbol indicating discount. Arrow financial growth decrease vectors Circular arrows and down arrow with percent symbol indicating discount
Free with trial Stacks of coins diminish, mirroring a falling stock market chart against a world map backdrop, symbolizing global economic decline and financial loss. Arrow financial growth decrease illustrations Global Economic Downturn: Coin Stacks Decline with Bearish Stock Chart. Stacks of coins diminish, mirroring a falling stock market chart against a world map backdrop, symbolizing global economic decline and financial loss
Free with trial A 3D bar chart with a red line graph indicating a significant decline, isolated on a white background. Arrow financial growth decrease illustrations Financial bar chart showing downward trend isolated on white background. A 3D bar chart with a red line graph indicating a significant decline, isolated on a white background
Free with trial Circular buttons labeled "BUY" and "SELL" sit on a surface with a glowing stock market chart in the background. The chart features fluctuating orange lines on a dark grid, illustrating price movements and market volatility. The buttons are shiny and metallic, with embossed text, suggesting a dynamic financial environment. The composition emphasizes themes of trading and investment in the stock market. Arrow financial growth decrease illustrations Buy and sell buttons with stock market chart in background, financial concept. Circular buttons labeled "BUY" and "SELL" sit on a surface with a glowing stock market chart in the background. The chart features fluctuating orange lines on a dark grid, illustrating price movements and market volatility. The buttons are shiny and metallic, with embossed text, suggesting a dynamic financial environment. The composition emphasizes themes of trading and investment in the stock market.
Free with trial Graph going Up and Down sign with green and red arrows vector set. Flat design vector set of a concept of sales bar chart symbol icon with arrow moving down and sales bar chart with arrow moving up. Arrow financial growth decrease vectors Graph going Up and Down sign with green and red arrows vector set. Vector set of a concept of sales bar chart symbol icon. Graph going Up and Down sign with green and red arrows vector set. Flat design vector set of a concept of sales bar chart symbol icon with arrow moving down and sales bar chart with arrow moving up.
Free with trial Up and Down sign with green and red arrows set vector illustration. Set of a Concept of sales bar chart symbol icon with arrow moving down and sales bar chart with arrow moving up. Arrow financial growth decrease vectors Up and Down sign with green and red arrows set vector illustration. Set of a Concept of sales bar chart symbol icon with arrows. Up and Down sign with green and red arrows set vector illustration. Set of a Concept of sales bar chart symbol icon with arrow moving down and sales bar chart with arrow moving up.
Free with trial Graph going Up and Down with red arrows vector. Blue chart bar vector illustration concept of sales bar chart symbol icon with arrow moving down and sales bar chart with arrow moving up. Arrow financial growth decrease vectors Graph going Up and Down with red arrows vector. Blue chart bar vector illustration concept of sales bar chart symbol icon
Free with trial Graph going Up and Down with green and red arrows vector. Blue chart bar vector illustration concept of sales bar chart symbol icon with arrow moving down and sales bar chart with arrow moving up. Arrow financial growth decrease vectors Graph going Up and Down with green and red arrows vector. Blue chart bar vector illustration concept of sales bar chart symbol. Graph going Up and Down with green and red arrows vector. Blue chart bar vector illustration concept of sales bar chart symbol icon with arrow moving down and sales bar chart with arrow moving up.
Free with trial Graph icon indicating growth and data analysis, perfect for business presentations and financial reports. visual representation of progress ,Generative ai. Arrow financial growth decrease illustrations Graph icon, a comprehensive symbol of data analysis, growth, and business trends for effective presentations. Graph icon indicating growth and data analysis, perfect for business presentations and financial reports. visual representation of progress ,Generative ai
Free with trial This illustration depicts upward and downward trending arrows on a grid, symbolizing market fluctuations, business trends, and financial performance analysis. Arrow financial growth decrease vectors Illustration of upward and downward trending arrows on a grid isolated on white background. This illustration depicts upward and downward trending arrows on a grid, symbolizing market fluctuations, business trends, and financial performance analysis
Free with trial Financial crisis business market. Currency risk. Red header with arrows and percent signs for global inflation concept. Arrow financial growth decrease illustrations Arrows and percents signs going up to illustrate global inflation over red background banner. Financial crisis business market. Currency risk. Red header with arrows and percent signs for global inflation concept.
Free with trial Red textured arrows depict market fluctuations and business trends against a textured background symbolizes economic ups and downs, financial analysis, and investment opportunities with market statistics. Arrow financial growth decrease illustrations Red arrows symbolizing fluctuations representing business trends on a textured background. red textured arrows depict market fluctuations and business trends against a textured background symbolizes economic ups and downs, financial analysis, and investment opportunities with market statistics
Free with trial Economic Loss icon Flat set in black and white color outline vector. Arrow financial growth decrease vectors Economic Loss Icon for Financial Downturns, Business Challenges, and Market Analysis Illustrations. Economic Loss icon Flat set in black and white color outline vector
Free with trial Graph going Up and Down sign with blue arrows vector. Flat design vector illustration concept of sales bar chart symbol icon with arrow moving down and sales bar chart with arrow moving up. Arrow financial growth decrease vectors Graph going Up and Down sign with blue arrows vector. Flat design vector illustration concept of sales bar chart symbol icon. Graph going Up and Down sign with blue arrows vector. Flat design vector illustration concept of sales bar chart symbol icon with arrow moving down and sales bar chart with arrow moving up.
Free with trial Business refers to the organized efforts and activities of individuals or groups to produce, buy, sell, and exchange goods or services for profit. Arrow financial growth decrease illustrations The Arrow down and coins for Business concept 3d rendering. Business refers to the organized efforts and activities of individuals or groups to produce, buy, sell, and exchange goods or services for profit
Free with trial Business refers to the organized efforts and activities of individuals or groups to produce, buy, sell, and exchange goods or services for profit. Arrow financial growth decrease illustrations The Arrow down and coins for Business concept 3d rendering. Business refers to the organized efforts and activities of individuals or groups to produce, buy, sell, and exchange goods or services for profit
Free with trial Business refers to the organized efforts and activities of individuals or groups to produce, buy, sell, and exchange goods or services for profit. Arrow financial growth decrease illustrations The Arrow down and coins for Business concept 3d rendering. Business refers to the organized efforts and activities of individuals or groups to produce, buy, sell, and exchange goods or services for profit
Free with trial Business refers to the organized efforts and activities of individuals or groups to produce, buy, sell, and exchange goods or services for profit. Arrow financial growth decrease illustrations The Arrow down and coins for Business concept 3d rendering. Business refers to the organized efforts and activities of individuals or groups to produce, buy, sell, and exchange goods or services for profit
Free with trial Business refers to the organized efforts and activities of individuals or groups to produce, buy, sell, and exchange goods or services for profit. Arrow financial growth decrease illustrations The Arrow down and coins for Business concept 3d rendering. Business refers to the organized efforts and activities of individuals or groups to produce, buy, sell, and exchange goods or services for profit
Free with trial Business refers to the organized efforts and activities of individuals or groups to produce, buy, sell, and exchange goods or services for profit. Arrow financial growth decrease illustrations The Arrow down and coins for Business concept 3d rendering. Business refers to the organized efforts and activities of individuals or groups to produce, buy, sell, and exchange goods or services for profit
Free with trial Business refers to the organized efforts and activities of individuals or groups to produce, buy, sell, and exchange goods or services for profit. Arrow financial growth decrease illustrations The Arrow down and coins for Business concept 3d rendering. Business refers to the organized efforts and activities of individuals or groups to produce, buy, sell, and exchange goods or services for profit
Free with trial Business refers to the organized efforts and activities of individuals or groups to produce, buy, sell, and exchange goods or services for profit. Arrow financial growth decrease illustrations The Arrow down and coins for Business concept 3d rendering. Business refers to the organized efforts and activities of individuals or groups to produce, buy, sell, and exchange goods or services for profit
Free with trial Stock market trading technical analysis bar chart fall. Business candlestick graph exchange down trend. Crisis economy and investment loss graph. Trader financial index crash concept. Money losing eps. Arrow financial growth decrease vectors Stock market trading technical analysis bar chart fall. Business candlestick graph exchange down trend. Crisis economy
Free with trial Modern timeline candles are moving down with no resistance. 12 month financial statistics graph with business calendar Fear of down markets and down trends. Arrow financial growth decrease vectors Modern timeline candles are moving down with no resistance
Free with trial A set of black and white icons representing stock market data analysis and financial growth. 94. Arrow financial growth decrease vectors Stock market data analysis charts and graphs business finance and investment vector icon set design 100. A set of black and white icons representing stock market. a set of black and white icons representing stock market data analysis and financial growth. 94