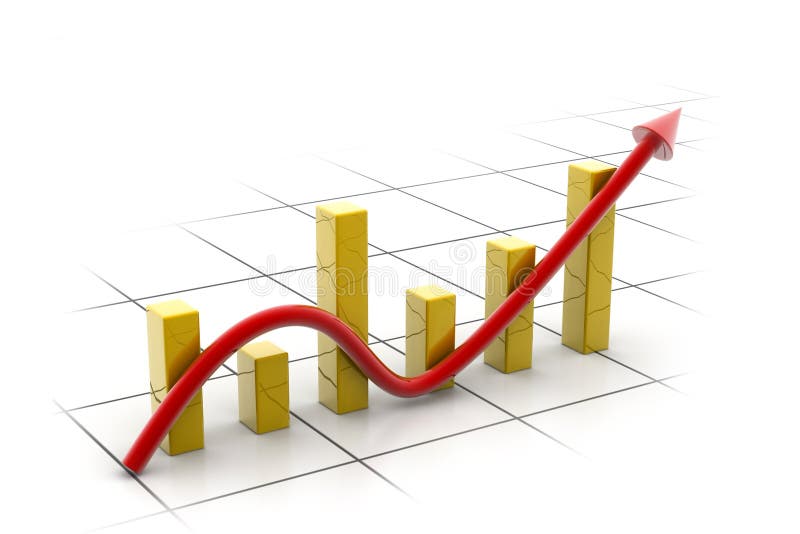
Free with trial Digital illustration of business graph with arrow showing growth and profit. Arrow financial growth decrease illustrations Business graph
Free with trial Cost reduction icon price lower arrow. Vector low cost money crisis line icon. Arrow financial growth decrease vectors Cost reduction icon price lower arrow. Vector low cost money crisis line icon
Free with trial Business chart of falls and growth. Pop art retro vector illustration kitsch vintage 50s 60s style. Arrow financial growth decrease vectors Business chart of falls and growth
Free with trial Two drop and growth technology icon with gear. outline simple trend stats logotype graphic stroke art web design isolated on white. concept of key performance indicator or operation strategy symbol. Arrow financial growth decrease vectors Two drop and growth technology icon with gear
Free with trial 3d Red arrow showing downward trend in stock market. Financial crisis concept with broken coins, investment risk, and money loss. Vector illustration. Arrow financial growth decrease vectors 3d Red arrow downward trend in stock market. 3d Red arrow showing downward trend in stock market. Financial crisis concept with broken coins, investment risk, and money loss. Vector illustration
Free with trial Cost reduction icon price lower arrow. Vector low cost money crisis line icon. Arrow financial growth decrease vectors Cost reduction icon price lower arrow. Vector low cost money crisis line icon
Free with trial Colorful infographic financial sketch icons set of business audit elements on dark background vector illustration. Arrow financial growth decrease vectors Colorful Infographic Financial Sketch Icons Set
Free with trial Digital illustration of business graph with arrow showing growth and profit. Arrow financial growth decrease illustrations Business graph
Free with trial Yellow 3D arrow isolated on white background. Arrow financial growth decrease illustrations Yellow 3D arrow
Free with trial Vector cartoon stick figure drawing conceptual illustration of man or businessman trying to hold declining economic or financial graph. Concept of recession or crisis. Arrow financial growth decrease vectors Vector Cartoon Illustration of Man, Businessman or Investor Trying to Hold Falling Financial or Economic Graph, Crisis. Vector cartoon stick figure drawing conceptual illustration of man or businessman trying to hold declining economic or financial graph. Concept of recession or crisis.
Free with trial Financial crisis scraps paper chart broken pencil isolated objects. Color vector illustration EPS10. Arrow financial growth decrease vectors Financial crisis scraps paper chart broken pencil
Free with trial Financial concept of a piggy bank riding a red profit arrow. Could refer to savings or investments in the stock market. Arrow financial growth decrease vectors Piggy Bank Graph Concept. Financial concept of a piggy bank riding a red profit arrow. Could refer to savings or investments in the stock market.
Free with trial Minimalist vector illustration showing a black diagram with a downward arrow symbolizing economic decline, financial loss, recession, or negative business performance. Clean and modern design isolated on a white background, ideal for business presentations, financial reports, infographics, websites, mobile apps, and marketing materials related to economics, finance, investment, and analytics. Arrow financial growth decrease vectors . Minimalist vector illustration showing a black diagram with a downward arrow symbolizing economic decline, financial loss, recession, or negative business performance. Clean and modern design isolated on a white background, ideal for business presentations, financial reports, infographics, websites, mobile apps, and marketing materials related to economics, finance, investment, and analytics.
Free with trial A professional vector set of business chart icons showing both growth and decline trends. Includes bar charts and line graphs with upward and downward arrows, representing profit, loss, performance rise, and financial downfall. Perfect for business presentations, reports, websites, infographics, and more. Fully editable EPS file for scalable design use. Arrow financial growth decrease vectors . A professional vector set of business chart icons showing both growth and decline trends. Includes bar charts and line graphs with upward and downward arrows, representing profit, loss, performance rise, and financial downfall. Perfect for business presentations, reports, websites, infographics, and more. Fully editable EPS file for scalable design use.
Free with trial Digital illustration of business arrow in colour background. Arrow financial growth decrease illustrations Business arrow
Free with trial Vector cartoon stick figure drawing conceptual illustration of man or businessman using shield to resist the declining economic or financial graph. Concept of recession or crisis. Arrow financial growth decrease vectors Vector Cartoon Illustration of Man, Businessman or Investor Using Shield to Resist the Falling Financial or Economic. Vector cartoon stick figure drawing conceptual illustration of man or businessman using shield to resist the declining economic or financial graph. Concept of recession or crisis.
Free with trial Economic and social recession concept. Set of financial crisis symbols. 3d mans with piggy bank on arrow, people falling from the red arrows. Isolated on white background. 3d render. Arrow financial growth decrease illustrations Economic and social recession concept
Free with trial Money icon with arrows, capital decrease and increase, dollar rate increase, investment concept – stock vector. Arrow financial growth decrease illustrations Money icon with arrows, capital decrease and increase, dollar rate increase, investment concept – vector
Free with trial Money Transfer Icons Set, Currency Exchange Logo, Crypto Financial Services. Vector illustration. Arrow financial growth decrease vectors Money Transfer Icons Set, Currency Exchange Logo, Crypto Financial Services. Vector
Free with trial Money Transfer Icons Set, Currency Exchange Logo, Crypto Financial Services. Vector illustration. Arrow financial growth decrease vectors Money Transfer Icons Set, Currency Exchange Logo, Crypto Financial Services. Vector
Free with trial An illustration of a businesswoman with a briefcase looking up in concern at a massive pink downward-pointing arrow featuring a white percentage (%) symbol. Arrow financial growth decrease vectors . An illustration of a businesswoman with a briefcase looking up in concern at a massive pink downward-pointing arrow featuring a white percentage (%) symbol
Free with trial Percentage arrow icon vector. Percent up and down icon vector. Arrow financial growth decrease vectors Up arrow percentage and down arrow percentage icon. Percentage arrow icon vector. Percent up and down icon vector.
Free with trial Arrow down: Arrow down is a symbol indicating decrease or downward movement. Arrow financial growth decrease vectors Arrow down
Free with trial A 3D illustration of a financial bar chart showing a drastic decline with a red arrow, symbolizing a stock market crash, recession, and economic loss. Arrow financial growth decrease illustrations Market Crash 3D Bar Chart with Downward Arrow. A 3D illustration of a financial bar chart showing a drastic decline with a red arrow, symbolizing a stock market crash, recession, and economic loss
Free with trial Vector cartoon stick figure drawing conceptual illustration of unhappy man or businessman holding falling financial chart or graph. Arrow financial growth decrease vectors Vector Cartoon Illustration of Unhappy Man or Businessman Holding Falling Financial Graph or Chart. Vector cartoon stick figure drawing conceptual illustration of unhappy man or businessman holding falling financial chart or graph.
Free with trial A 3D illustration depicting a businessman sitting on a crumbling rock, alongside a sharply falling red arrow, symbolizing market downturn and financial distress. The scene evokes feelings of anxiety and uncertainty related to economic instability and investment loss. Arrow financial growth decrease illustrations Market Crash Anxiety. A 3D illustration depicting a businessman sitting on a crumbling rock, alongside a sharply falling red arrow, symbolizing market downturn and financial distress. The scene evokes feelings of anxiety and uncertainty related to economic instability and investment loss.
Free with trial Increase and decrease related icons: thin vector icon set, black and white kit. Arrow financial growth decrease vectors Increase and decrease related icons
Free with trial Decrease and Growing graph Icon. Chart with bars declining Raster icon. Finance graph symbol. Raster on white background. Arrow financial growth decrease illustrations Decrease and Growing graph Icon. Chart with bars declining Raster icon. Finance graph symbol.
Free with trial Percentage with arrow up and down. Percentage arrow with percent sign. Design concept for banking, credit, interest rate, finance and money sphere. 3D Web Vector Illustrations. Arrow financial growth decrease vectors Percentage with arrow up and down. Percentage arrow with percent sign. Design concept for banking, credit, interest rate, finance
Free with trial A simple outline icon featuring a circular arrow enclosing two triangle symbols, one pointing upwards and one downwards. This graphic effectively represents concepts like data fluctuation, refresh cycles, continuous change, market trends, or system updates involving variations. Ideal for illustrating processes, analytics, financial data, or any dynamic system requiring monitoring of increases and decreases. Its clean, minimalist design ensures versatility for web, app, and print applications. Arrow financial growth decrease illustrations Refresh Cycle with Up Down Triangles Outline Icon. A simple outline icon featuring a circular arrow enclosing two triangle symbols, one pointing upwards and one downwards. This graphic effectively represents concepts like data fluctuation, refresh cycles, continuous change, market trends, or system updates involving variations. Ideal for illustrating processes, analytics, financial data, or any dynamic system requiring monitoring of increases and decreases. Its clean, minimalist design ensures versatility for web, app, and print applications.
Free with trial Vector cartoon stick figure drawing conceptual illustration of happy smiling man or businessman holding falling financial chart or graph. Arrow financial growth decrease vectors Vector Cartoon Illustration of Smiling Happy Man or Businessman Holding Falling Financial Graph or Chart. Vector cartoon stick figure drawing conceptual illustration of happy smiling man or businessman holding falling financial chart or graph.
Free with trial Depreciation down graph fail bankruptcy diagram financial business crisis economy vector. Arrow financial growth decrease illustrations Depreciation down graph fail bankruptcy diagram financial business crisis economy
Free with trial Business Loss and Negative Growth Concept. Futuristic Declining Bar Graph with Downward Arrow on Dark Blue Background, Business Loss and Negative Growth Concept. Arrow financial growth decrease vectors Business Loss and Negative Growth Concept. Futuristic Declining Bar Graph with Downward Arrow on Dark Blue Background, Business Loss and Negative Growth Concept
Free with trial Stock Market - Falling stock prices drop down from Global economic and financial crisis red color tone. Arrow financial growth decrease illustrations Stock Market - Falling stock prices drop down from Global economic and financial crisis. Stock Market - Falling stock prices drop down from Global economic and financial crisis red color tone
Free with trial Cost reduction icon price lower arrow. Vector low cost money crisis line icon. Arrow financial growth decrease vectors Cost reduction icon price lower arrow. Vector low cost money crisis line icon
Free with trial Isometric Business on falling down the chart. Fail, Risk, Problem. Decline red arrow with businessman isolated on white background. Arrow financial growth decrease vectors Isometric Business on falling down the chart. Fail, Risk, Problem. Decline red arrow with businessman isolated on white
Free with trial Cost reduction icon price lower arrow. Vector low cost money crisis line icon. Arrow financial growth decrease vectors Cost reduction icon price lower arrow. Vector low cost money crisis line icon
Free with trial A gold bar graph with an arrow pointing down at the end. Arrow financial growth decrease illustrations A gold bar graph with an arrow
Free with trial Downward arrows representing decline, calculator symbolizing calculations, and percentage sign for financial analysis. Ideal for business, finance, data analysis, interest rate, savings, growth. Arrow financial growth decrease vectors Decreasing Trends with Financial Calculation and Percentage Concept. Downward arrows representing decline, calculator symbolizing calculations, and percentage sign for financial analysis. Ideal for business, finance, data analysis, interest rate, savings, growth
Free with trial Colorful graph / diagram with arrow on white. Arrow financial growth decrease illustrations Colorful graph / diagram with arrow on white
Free with trial Businessman and stock market arrow presentation. Business profits presentation concept. Cheerful businessman with graph indicating increase. The concept of business success. Vector illustration. Arrow financial growth decrease vectors Businessman and stock market arrow presentation.Business profits
Free with trial A minimalist flat design vector illustration featuring red circle with downward arrow and green circle with upward arrow, symbolizing contrast. Arrow financial growth decrease vectors Increase and decrease arrows for data trends. A minimalist flat design vector illustration featuring red circle with downward arrow and green circle with upward arrow, symbolizing contrast
Free with trial Business arrow up success seamless pattern isolated on color background. Simple background. Arrow financial growth decrease vectors Business arrow up success seamless pattern isolated on color background
Free with trial Declining Bar Graph with Downward Arrow, Business Loss and Negative Growth Concept on White Background. Arrow financial growth decrease vectors Declining Bar Graph with Downward Arrow, Business Loss
Free with trial Money icon with arrows, capital decrease and increase, dollar rate increase, investment concept – stock vector. Arrow financial growth decrease illustrations Money icon with arrows, capital decrease and increase, dollar rate increase, investment concept – vector
Free with trial Simple black icons representing financial growth and decline, perfect for business analytics and reporting. This scalable vector graphic is versatile for web and print. Arrow financial growth decrease vectors Bar charts with arrows indicating growth or decline. Simple black icons representing financial growth and decline, perfect for business analytics and reporting. This scalable vector graphic is versatile for web and print
Free with trial Colored infographic financial elements collection of business audit management icons in sketch style isolated vector illustration. Arrow financial growth decrease vectors Colored Infographic Financial Elements Collection
Free with trial Black and white outline showing a gear, a chart with falling bars, and an arrow pointing down, symbolizing economic. Arrow financial growth decrease illustrations Economic Downturn Gear, Chart, Arrow Down, Black and White. Black and white outline showing a gear, a chart with falling bars, and an arrow pointing down, symbolizing economic.
Free with trial Two simple icons representing financial market performance, one showing a downward trend and the other an upward trend, both with dollar symbols. Arrow financial growth decrease vectors Financial graph icons showing market trends up and down. Two simple icons representing financial market performance, one showing a downward trend and the other an upward trend, both with dollar symbols
Free with trial A clean black and white set of nine vector icons showing growth, decline, stability, and financial trends for business presentations and reports. Arrow financial growth decrease vectors Economic trend icons set flat design vector illustration. A clean black and white set of nine vector icons showing growth, decline, stability, and financial trends for business presentations and reports.
Free with trial Cost reduction icon price lower arrow. Vector low cost money crisis line icon. Arrow financial growth decrease vectors Cost reduction icon price lower arrow. Vector low cost money crisis line icon
Free with trial 3D graph going up and down with red arrows, blue bar chart icon vector, sales chart with 3D arrow down and arrow up, financial analytics symbol, EPS 10. Arrow financial growth decrease vectors 3D graph going up and down with red arrows, blue bar chart icon vector, sales chart symbol. 3D graph going up and down with red arrows, blue bar chart icon vector, sales chart with 3D arrow down and arrow up, financial analytics symbol, EPS 10
Free with trial Candlestick chart icons on a digital trading screen showing market movements, price trends and investment data for finance, stock analysis, trading strategy and economic growth. Arrow financial growth decrease illustrations Candlestick chart displaying financial market data analysis. Candlestick chart icons on a digital trading screen showing market movements, price trends and investment data for finance, stock analysis, trading strategy and economic growth
Free with trial Business man crying and looking at down arrow feeling stressed about losing money or investment. Falling red graph is metaphor for financial crisis and decreasing income from investments in startup. Arrow financial growth decrease vectors Business man crying and looking at down arrow feeling stressed about losing money or investment
Free with trial A bar chart showing a steady decline with a red downward arrow, symbolizing financial loss, economic downturn, business decline, or negative performance trends. Arrow financial growth decrease illustrations Economic Downtrend Bar Chart for Business concept 3d Rendering. A bar chart showing a steady decline with a red downward arrow, symbolizing financial loss, economic downturn, business decline, or negative performance trends
Free with trial A bar chart showing a steady decline with a red downward arrow, symbolizing financial loss, economic downturn, business decline, or negative performance trends. Arrow financial growth decrease illustrations Economic Downtrend Bar Chart for Business concept 3d Rendering. A bar chart showing a steady decline with a red downward arrow, symbolizing financial loss, economic downturn, business decline, or negative performance trends
Free with trial A bar chart showing a steady decline with a red downward arrow, symbolizing financial loss, economic downturn, business decline, or negative performance trends. Arrow financial growth decrease illustrations Economic Downtrend Bar Chart for Business concept 3d Rendering. A bar chart showing a steady decline with a red downward arrow, symbolizing financial loss, economic downturn, business decline, or negative performance trends
Free with trial A bar chart showing a steady decline with a red downward arrow, symbolizing financial loss, economic downturn, business decline, or negative performance trends. Arrow financial growth decrease illustrations Economic Downtrend Bar Chart for Business concept 3d Rendering. A bar chart showing a steady decline with a red downward arrow, symbolizing financial loss, economic downturn, business decline, or negative performance trends
Free with trial A professional businessman analyzes private equity portfolio management data on a large screen, evaluating ebitda growth, revenue increase, and cost optimization charts while taking notes. Arrow financial growth decrease vectors Man Analyzing Financial Charts for Private Equity Portfolio. A professional businessman analyzes private equity portfolio management data on a large screen, evaluating ebitda growth, revenue increase, and cost optimization charts while taking notes
Free with trial A simplified flat style icon displays a declining bar graph with arrow. Focuses on business and financial themes. Arrow financial growth decrease vectors Flat icon illustration showing bar chart trending downwards. A simplified flat style icon displays a declining bar graph with arrow. Focuses on business and financial themes.
Free with trial Abstract business background with a green graph and arrow on a wooden table. Arrow financial growth decrease vectors Abstract green graph with arrow on wooden table. Abstract business background with a green graph and arrow on a wooden table
Free with trial Money line icons. Settings gear, Message, Inflation icons. Finance, revenue reduction and financial benefit set. Economy, money savings and increase profit line icons. Vector. Arrow financial growth decrease vectors Money line icons. Finance, revenue reduction and financial benefit. App line icons. Vector. Money line icons. Settings gear, Message, Inflation icons. Finance, revenue reduction and financial benefit set. Economy, money savings and increase profit line icons. Vector
Free with trial 3D decreasing red arrow on the chart. Arrow financial growth decrease illustrations Decreasing red arrow on the chart
Free with trial Cost reduction text with downward arrow and bar chart on neutral background. Business finance concept for expense control, budget management, savings strategy, and profit optimization. Arrow financial growth decrease illustrations Cost Reduction Concept with Downward Arrow and Bar Chart 3d render. Cost reduction text with downward arrow and bar chart on neutral background. Business finance concept for expense control, budget management, savings strategy, and profit optimization
Free with trial Cost reduction text with downward arrow and bar chart on neutral background. Business finance concept for expense control, budget management, savings strategy, and profit optimization. Arrow financial growth decrease illustrations Cost Reduction Concept with Downward Arrow and Bar Chart 3d render. Cost reduction text with downward arrow and bar chart on neutral background. Business finance concept for expense control, budget management, savings strategy, and profit optimization
Free with trial Cost reduction text with downward arrow and bar chart on neutral background. Business finance concept for expense control, budget management, savings strategy, and profit optimization. Arrow financial growth decrease illustrations Cost Reduction Concept with Downward Arrow and Bar Chart 3d render. Cost reduction text with downward arrow and bar chart on neutral background. Business finance concept for expense control, budget management, savings strategy, and profit optimization
Free with trial Cost reduction text with downward arrow and bar chart on neutral background. Business finance concept for expense control, budget management, savings strategy, and profit optimization. Arrow financial growth decrease illustrations Cost Reduction Concept with Downward Arrow and Bar Chart 3d render. Cost reduction text with downward arrow and bar chart on neutral background. Business finance concept for expense control, budget management, savings strategy, and profit optimization
Free with trial Cost reduction text with downward arrow and bar chart on neutral background. Business finance concept for expense control, budget management, savings strategy, and profit optimization. Arrow financial growth decrease illustrations Cost Reduction Concept with Downward Arrow and Bar Chart 3d render. Cost reduction text with downward arrow and bar chart on neutral background. Business finance concept for expense control, budget management, savings strategy, and profit optimization
Free with trial Cost reduction text with downward arrow and bar chart on neutral background. Business finance concept for expense control, budget management, savings strategy, and profit optimization. Arrow financial growth decrease illustrations Cost Reduction Concept with Downward Arrow and Bar Chart 3d render. Cost reduction text with downward arrow and bar chart on neutral background. Business finance concept for expense control, budget management, savings strategy, and profit optimization
Free with trial Cost reduction text with downward arrow and bar chart on neutral background. Business finance concept for expense control, budget management, savings strategy, and profit optimization. Arrow financial growth decrease illustrations Cost Reduction Concept with Downward Arrow and Bar Chart 3d render. Cost reduction text with downward arrow and bar chart on neutral background. Business finance concept for expense control, budget management, savings strategy, and profit optimization
Free with trial Cost reduction text with downward arrow and bar chart on neutral background. Business finance concept for expense control, budget management, savings strategy, and profit optimization. Arrow financial growth decrease illustrations Cost Reduction Concept with Downward Arrow and Bar Chart 3d render. Cost reduction text with downward arrow and bar chart on neutral background. Business finance concept for expense control, budget management, savings strategy, and profit optimization
Free with trial Cost reduction text with downward arrow and bar chart on neutral background. Business finance concept for expense control, budget management, savings strategy, and profit optimization. Arrow financial growth decrease illustrations Cost Reduction Concept with Downward Arrow and Bar Chart 3d render. Cost reduction text with downward arrow and bar chart on neutral background. Business finance concept for expense control, budget management, savings strategy, and profit optimization
Free with trial A bar chart showing a steady decline with a red downward arrow, symbolizing financial loss, economic downturn, business decline, or negative performance trends. Arrow financial growth decrease illustrations Economic Downtrend Bar Chart for Business concept 3d Rendering. A bar chart showing a steady decline with a red downward arrow, symbolizing financial loss, economic downturn, business decline, or negative performance trends
Free with trial A bar chart showing a steady decline with a red downward arrow, symbolizing financial loss, economic downturn, business decline, or negative performance trends. Arrow financial growth decrease illustrations Economic Downtrend Bar Chart for Business concept 3d Rendering. A bar chart showing a steady decline with a red downward arrow, symbolizing financial loss, economic downturn, business decline, or negative performance trends
Free with trial Flat style icon depicting money with up and down arrows indicating financial fluctuation and market trends visualized. Arrow financial growth decrease vectors Money and Arrows Icon Representing Financial Fluctuation Concept. Flat style icon depicting money with up and down arrows indicating financial fluctuation and market trends visualized.
Free with trial Flat 3d isometric falling red arrow piercing through oil barrel. Oil price crisis concept. Arrow financial growth decrease vectors Isometric falling red arrow piercing through oil barrel
Free with trial A series of glowing blue arrows curve upwards against a dark background, symbolizing growth and success. The arrows decrease in size from left to right, creating a sense of movement and progress. The largest arrow is at the top, indicating a peak or goal. The blue gradient enhances the sense of dynamism and forward momentum, typical in business and financial contexts. Arrow financial growth decrease illustrations Abstract Upward Trend Arrow Symbolizing Growth and Success. A series of glowing blue arrows curve upwards against a dark background, symbolizing growth and success. The arrows decrease in size from left to right, creating a sense of movement and progress. The largest arrow is at the top, indicating a peak or goal. The blue gradient enhances the sense of dynamism and forward momentum, typical in business and financial contexts.
Free with trial Increasing and decreasing graph set. Red and blue arrows depict growth and recession business. Flat vector chart concept illustration as an element for web, publish infographic and social networks. Arrow financial growth decrease vectors Growth and Recession Business Concept. Increasing and decreasing graph set. Red and blue arrows depict growth and recession business. Flat vector chart concept illustration as an element for web, publish infographic and social networks.
Free with trial The graph displays two lines, one green and one red. The green line is ascending, indicating growth or progress, while the red line is descending, suggesting a decline or decrease. Arrow financial growth decrease illustrations A graph with a green line and a red line. The graph displays two lines, one green and one red. The green line is ascending, indicating growth or progress, while the red line is descending, suggesting a decline or decrease
Free with trial A simple and clean line art icon of a graph, isolated on a white background. This vector illustration features a line chart with axes, showing a fluctuating trend with distinct data points. The minimalist design makes it perfect for various applications related to business, finance, and data analysis. Ideal for use in presentations, infographics, websites, mobile apps, and user interfaces to represent concepts like statistics, growth, market trends, performance reports, and financial analytics. A versatile symbol for progress and data visualization. Arrow financial growth decrease illustrations Analytics Line Graph Vector Icon. A simple and clean line art icon of a graph, isolated on a white background. This vector illustration features a line chart with axes, showing a fluctuating trend with distinct data points. The minimalist design makes it perfect for various applications related to business, finance, and data analysis. Ideal for use in presentations, infographics, websites, mobile apps, and user interfaces to represent concepts like statistics, growth, market trends, performance reports, and financial analytics. A versatile symbol for progress and data visualization.