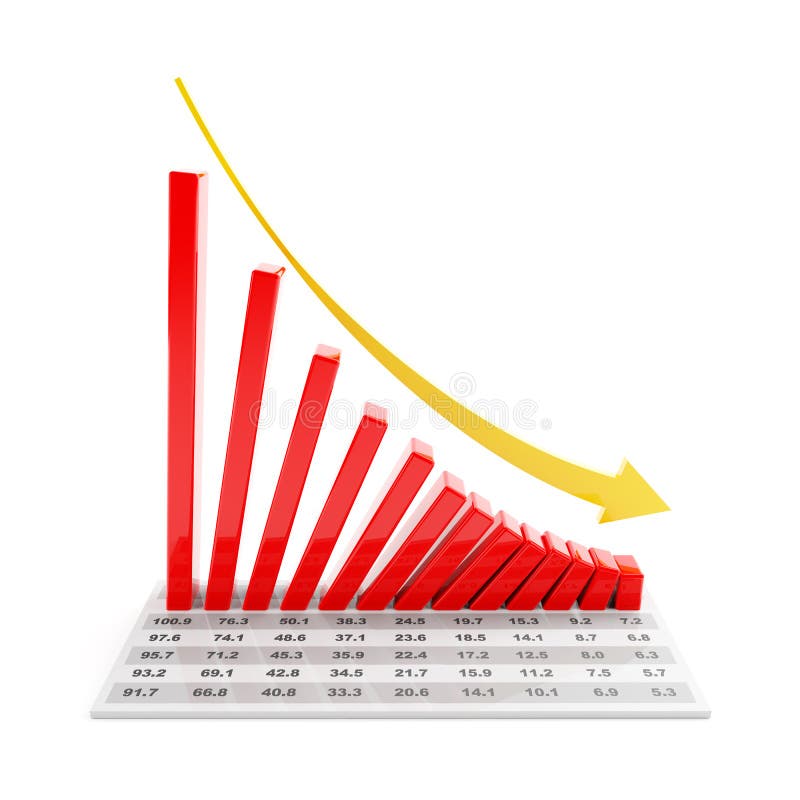
Free with trial 3D render of falling bar chart with red arrow showing the decline. Arrow showing decrease illustrations Declining bar chart with arrow. 3D render of falling bar chart with red arrow showing the decline
Free with trial Business graphs showing progress and success, with business people silhouettes - additional ai and eps format available on request. Arrow showing decrease illustrations Graphs for business use. Business graphs showing progress and success, with business people silhouettes - additional ai and eps format available on request
Free with trial Graph showing decrease in profits or earnings in 3D - vector. Arrow showing decrease vectors Decreasing bar graph. Graph showing decrease in profits or earnings in 3D - vector
Free with trial Business bar chart with arrow pointing down. Arrow showing decrease illustrations Business chart showing decrease. Business bar chart with arrow pointing down
Free with trial A graph showing a negative decrease. Arrow showing decrease illustrations Graph negatively decreasing. A graph showing a negative decrease
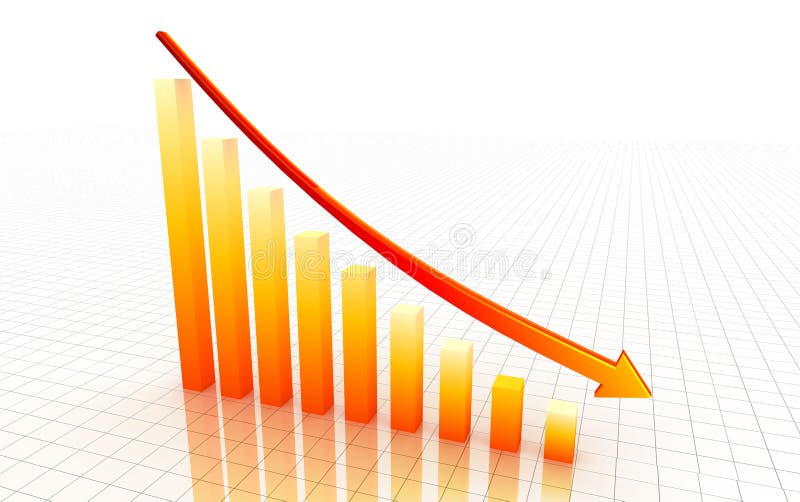
Free with trial Stapel Chart showing decrease. Orange arrow. Arrow showing decrease illustrations Cost Reduction. Stapel Chart showing decrease. Orange arrow
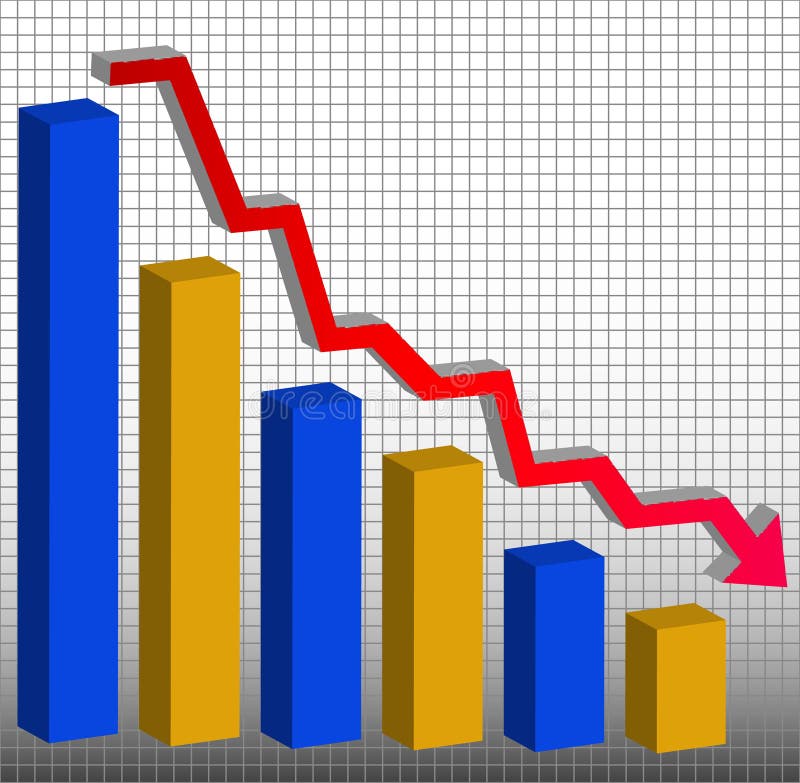
Free with trial A colorful bar chart showing a decrease or reduction by a red line and arrow above the bars. Arrow showing decrease illustrations Colorful bar chart
Free with trial 3d graph showing decrease in benefits or earnings on white background. Arrow showing decrease illustrations 3d decrease graph. 3d graph showing decrease in benefits or earnings on white background
Free with trial 3d graph showing decrease in benefits or earnings on white background. Arrow showing decrease illustrations 3d decrease graph. 3d graph showing decrease in benefits or earnings on white background
Free with trial An arrow graph trend shaped 100 dollar bank note showing an economic downward trend on an isolated background. Arrow showing decrease illustrations Dollar Bank Note Downward Trend Arrow. An arrow graph trend shaped 100 dollar bank note showing an economic downward trend on an isolated background
Free with trial A graph showing a positive decrease. Arrow showing decrease illustrations Graph postively decreasing. A graph showing a positive decrease
Free with trial Graph showing decrease in profits or earnings in 3D on white background. Arrow showing decrease illustrations Decrease
Free with trial 3d rendering of two white and orange arrows showing different directions. Business concept. Arrow showing decrease illustrations Up and down arrows. 3d rendering of two white and orange arrows showing different directions. Business concept.
Free with trial Economy crisis / 3d graph showing fall in profits or earnings / illustration. Arrow showing decrease vectors Economy crisis
Free with trial Graph showing decrease in profits or earnings in 3D. Arrow showing decrease illustrations Column graph 3d. Graph showing decrease in profits or earnings in 3D
Free with trial Magnifying glass showing falling bar graph on the screen of a computer. Arrow showing decrease vectors Bar Graph
Free with trial Business graphs showing progress and success, with business people silhouettes - additional ai and eps format available on request. Arrow showing decrease illustrations Graphs for business use. Business graphs showing progress and success, with business people silhouettes - additional ai and eps format available on request
Free with trial Downward Trend Business Concept on White Background. Arrow showing decrease illustrations Downward Trend Business Concept Background. Downward Trend Business Concept on White Background
Free with trial Green up and red down 3d arrow graph showing rising and descending trend, boosting of business result, decrease and growing investment profit symbol - vector. Arrow showing decrease vectors Green up and red down 3d arrow graph showing rising and descending trend, boosting of business result, decrease and growing
Free with trial Falling red arrow down design. Web icon. Chart showing reduction of parameters. Arrow showing decrease vectors Decrease arrow down. Falling red arrow down design. Web icon. Chart showing reduction of parameters
Free with trial American USA flag with red arrow graph going down showing economy recession and shares fall. Isolated vector illustration. Arrow showing decrease vectors American USA flag with red arrow graph going down showing economy recession and shares fall.
Free with trial 3d arrow showing decrease in benefits or earnings on white background. Arrow showing decrease illustrations 3d arrow
Free with trial Stat bars and falling arrow showing a downward trend. 3D illustration. Arrow showing decrease illustrations Stat bars and falling arrow showing a downward trend. 3D illustration
Free with trial Flat vector icon concept of house arrow showing down on red background. Arrow showing decrease vectors Vector icon concept of house arrow showing down on red background
Free with trial Easy to edit vector illustration of loss arrow hitting businessman showing financial crisis. Arrow showing decrease vectors Loss arrow hitting Businessman
Free with trial A Graph arrow showing decrease in value. Arrow showing decrease illustrations Graph Down Arrow. A Graph arrow showing decrease in value
Free with trial 3d graph showing decrease in benefits or earnings on white background. Arrow showing decrease illustrations 3d decrease graph. 3d graph showing decrease in benefits or earnings on white background
Free with trial 3d graph showing decrease in benefits or earnings on white background. Arrow showing decrease illustrations 3d decrease graph. 3d graph showing decrease in benefits or earnings on white background
Free with trial Easy to edit vector illustration of businessman holding loss arrow showing financial crisis. Arrow showing decrease vectors Depressed Businessman holding loss arrow. Easy to edit vector illustration of businessman holding loss arrow showing financial crisis
Free with trial 3d graph showing decrease in benefits or earnings on white background. Arrow showing decrease illustrations 3d decrease graph. 3d graph showing decrease in benefits or earnings on white background
Free with trial 3d graph showing decrease in benefits or earnings on white background. Arrow showing decrease illustrations Green 3d decrease graph. 3d graph showing decrease in benefits or earnings on white background
Free with trial An arrow graph trend shaped 100 australian dollar bank note showing an economic downward trend on an isolated background. Arrow showing decrease illustrations Australian Dollar Bank Note Downward Trend Arrow. An arrow graph trend shaped 100 australian dollar bank note showing an economic downward trend on an isolated background
Free with trial Graph showing decrease in profits or earnings in 3D on white background. Arrow showing decrease illustrations Graph showing decrease in profits or earnings
Free with trial 3d graph showing decrease in benefits or earnings on white background. Arrow showing decrease illustrations 3d decrease graph. 3d graph showing decrease in benefits or earnings on white background
Free with trial Red arrow showing downward trend on pile of Euro bank notes, isolated on black background. Arrow showing decrease illustrations Downward trend arrow on Euros. Red arrow showing downward trend on pile of Euro bank notes, isolated on black background.
Free with trial Economic crisis down graph color line icon of businessman silhouette showing chart with falling arrow. Vector finance recession, economic downturn and business decrease, money loss, and bankruptcy. Arrow showing decrease illustrations Economic crisis downward graph color line icon. Economic crisis down graph color line icon of businessman silhouette showing chart with falling arrow. Vector finance recession, economic downturn and business decrease, money loss, and bankruptcy
Free with trial Oil crisis because outbreak of pandemic coronavirus concept. Design with Rig, Winch, Oil Tank and red down arrow with COVID-19 showing a decline in oil prices. World economic recession. Flat vector illustration. Arrow showing decrease vectors Oil crisis because outbreak of pandemic coronavirus concept. Design with Rig, Winch, Oil Tank and red down arrow with COVID-19
Free with trial Businessman looking at chart showing economic recession. business concept. Arrow showing decrease vectors Businessman looking at chart showing economic recession
Free with trial Red Stock Market and Economic graph showing a down trend and recession concept, Generative ai. Arrow showing decrease illustrations Red Stock Market and Economic graph showing a down trend and recession concept
Free with trial Graph showing decrease in profits or earnings in 3D on white background. Arrow showing decrease illustrations Decrease
Free with trial Arrow over world map showing the future. Arrow showing decrease illustrations Arrows. Arrow over world map showing the future
Free with trial Digital illustration of business graph with arrow showing growth and profit. Arrow showing decrease illustrations Business graph
Free with trial Arrow over world map showing the future. Arrow showing decrease illustrations Arrows. Arrow over world map showing the future
Free with trial Arrow over world map showing stagnated future. Arrow showing decrease illustrations Stagnation. Arrow over world map showing stagnated future
Free with trial Financial 3D graph showing decrease in profits. Arrow showing decrease illustrations Financial 3D graph
Free with trial Blue arrow showing way to Success. Arrow showing decrease illustrations The way to Success. Blue arrow showing way to Success
Free with trial The red 3d diagram showing losses. Arrow showing decrease illustrations The red 3d diagram showing losses
Free with trial Digital illustration of business graph with arrow showing growth and profit. Arrow showing decrease illustrations Business graph
Free with trial Digital illustration of business graph with arrow showing growth and profit. Arrow showing decrease illustrations Business graph
Free with trial Digital illustration of business graph with arrow showing growth and profit. Arrow showing decrease illustrations Business graph
Free with trial Bar graph with data showing falling trend, 3d render. Arrow showing decrease illustrations Bar graph showing falling trend, 3d render. Bar graph with data showing falling trend, 3d render
Free with trial Digital illustration of business graph with arrow showing growth and profit. Arrow showing decrease illustrations Business graph
Free with trial Financial 3D graph showing decrease in profits. Arrow showing decrease illustrations Financial 3D graph
Free with trial Businessmen Show Finance Crisis Negative Graph Red Arrow Down, Business Hands Point Finger on Desk Flat Vector Illustration. Arrow showing decrease vectors Businessmen Show Finance Crisis Negative Graph Red
Free with trial Financial crisis. Depressed woman watching marker fall. Company bankruptcy or budget recession concept. Chart with falling arrow showing economy collapse vector. Employee losing money. Arrow showing decrease vectors Financial crisis. Depressed woman watching marker fall. Company bankruptcy or budget recession concept
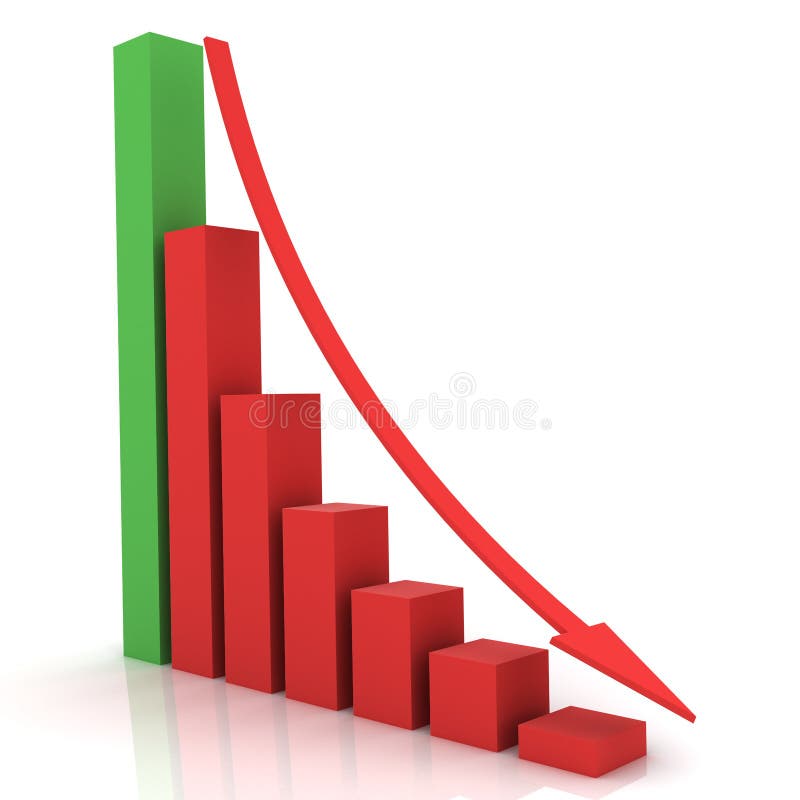
Free with trial A graph showing negative growth with a big green arrow crashing through a floor isolated on a white background. Arrow showing decrease illustrations Sales Through The Floor Graph. A graph showing negative growth with a big green arrow crashing through a floor isolated on a white background
Free with trial Dollar With Arrow Down Showing Recession And Economic Downturn. Arrow showing decrease illustrations Dollar With Arrow Down Showing Recession And Economic Downturn
Free with trial Decreasing red arrows showing the deterioration of the economy or the fall of stocks on the stock exchange in Russia. Arrow showing decrease illustrations Decreasing red arrows showing the deterioration of the economy in Russia. Decreasing red arrows showing the deterioration of the economy or the fall of stocks on the stock exchange in Russia.
Free with trial Dropping arrows showing decreasing trend in economy in global crisis or downtrend of stocks on the stock exchange in USA. Arrow showing decrease illustrations Dropping arrows showing decreasing trend in economy or downtrend on the stock exchange in USA. Dropping arrows showing decreasing trend in economy in global crisis or downtrend of stocks on the stock exchange in USA.
Free with trial Dropping arrows showing decreasing trend in economy in global crisis or downtrend of stocks on the stock exchange in Spain. March 2022, San Francisco, USA. Arrow showing decrease illustrations Dropping arrows showing decreasing trend in economy or downtrend on the stock exchange in Spain. Dropping arrows showing decreasing trend in economy in global crisis or downtrend of stocks on the stock exchange in Spain. March 2022, San Francisco, USA
Free with trial 3D arrows in shiny bright colors, great for visual user interface elements, presentations, web design, business concepts, economy situation. Arrow showing decrease illustrations 3D arrows
Free with trial Graph showing decrease in profits or earnings in 3D. Arrow showing decrease illustrations Column graph 3d. Graph showing decrease in profits or earnings in 3D
Free with trial Business graphs showing progress and success, with business people silhouettes - additional ai and eps format available on request. Arrow showing decrease illustrations Graphs for business use. Business graphs showing progress and success, with business people silhouettes - additional ai and eps format available on request
Free with trial Graph showing decrease in profits or earnings in 3D. Arrow showing decrease illustrations Column graph 3d. Graph showing decrease in profits or earnings in 3D
Free with trial Graph showing decrease in profits or earnings in 3D on white background. Arrow showing decrease illustrations DECREASING BAR GRAPH in 3d. Graph showing decrease in profits or earnings in 3D on white background
Free with trial Cute bird businessman showing different graph stats from success to failure. Arrow showing decrease vectors Bird Business Concept. Cute bird businessman showing different graph stats from success to failure
Free with trial Think different, stand out from crowd,business concepts. illustration. Arrow showing decrease vectors Think different
Free with trial Graph showing decrease in profits or earnings in 3D. Arrow showing decrease illustrations Column graph 3d. Graph showing decrease in profits or earnings in 3D
Free with trial Business graph showing decreasing profit for dollar. Arrow showing decrease illustrations Business graph
Free with trial A 3d illustration showing arrows indicating the increasing or decreasing value of a Euro, isolated on a white background. Arrow showing decrease vectors Euro Value Indicators. A 3d illustration showing arrows indicating the increasing or decreasing value of a Euro, isolated on a white background.
Free with trial A Colourful 3d Rendered Concept Illustration showing the housing market decline on a Blackboard. Arrow showing decrease illustrations Blackboard Housing Market Decline. A Colourful 3d Rendered Concept Illustration showing the housing market decline on a Blackboard
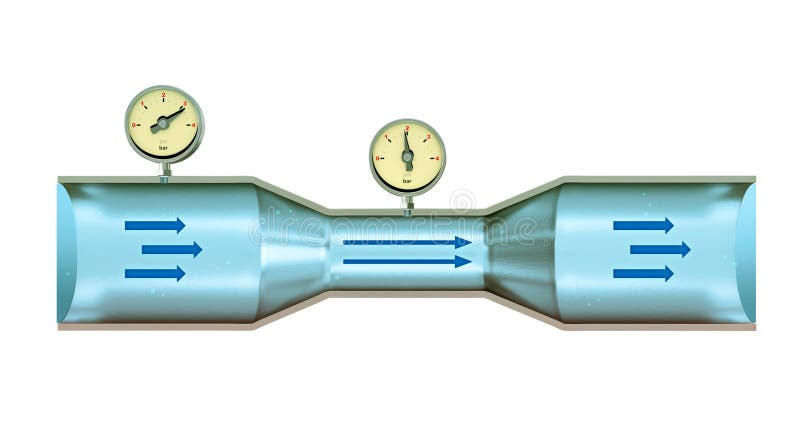
Free with trial Fluid dynamics diagram showing a cross-section of a Venturi tube with varying diameter and internal pressure. Digital illustration. Arrow showing decrease illustrations Venturi effect tube. Fluid dynamics diagram showing a cross-section of a Venturi tube with varying diameter and internal pressure. Digital illustration
Free with trial A chart painted with light showing an increase. Arrow showing decrease illustrations Chart with increases. A chart painted with light showing an increase.
Free with trial Liberty torch has been created as vector. Arrow showing decrease vectors Liberty torch
Free with trial Red chart Graph showing bear market with green Stop Loss line. Cut losses. Isolated on white. 3D render. Clipping path included. Arrow showing decrease illustrations Stop-loss order chart illustration. Red chart Graph showing bear market with green Stop Loss line. Cut losses. Isolated on white. 3D render. Clipping path included.
Free with trial Arrow pointing down, straight downward direction. Indicator, decrease pointer, showing reduction. Decline falling symbol. Navigation element. Flat vector illustration isolated on white background. Arrow showing decrease vectors Arrow pointing down, straight downward direction. Indicator, decrease pointer, showing reduction. Decline falling symbol
Free with trial Icon showing a laptop with a downward zigzag arrow on the screen, symbolizing a decline or decrease. Black outline design with a shadow extending to the left on a white background. Minimalistic and modern style. Arrow showing decrease vectors Icon showing a laptop with a downward zigzag arrow on the screen, symbolizing a decline or decrease
Free with trial Neon graph with a blue zigzag line sharply descending from left to right, depicting a decline. The horizontal and vertical axes are in bright green, forming a right angle. The arrow points downward at the graph's end, emphasizing the decrease. The setup is on a black background, making the neon colors vivid and clear. Arrow showing decrease illustrations Neon graph arrow going down showing decrease. Neon graph with a blue zigzag line sharply descending from left to right, depicting a decline. The horizontal and vertical axes are in bright green, forming a right angle. The arrow points downward at the graph's end, emphasizing the decrease. The setup is on a black background, making the neon colors vivid and clear.
Free with trial Declining Bar Graph with Downward Arrow Showing Loss or Decrease. Arrow showing decrease vectors Declining Bar Graph with Downward Arrow Showing Loss or Decrease
Free with trial The image depicts a series of vertical bars in teal color, showing a gradual decrease in height from left to right. A large red downward-pointing arrow overlays the bars, emphasizing the trend of decline in the data represented. This visual is commonly used to illustrate decreasing performance, sales, or other metrics over time. Arrow showing decrease illustrations Declining bar chart with a downward arrow indicating a decrease in values. The image depicts a series of vertical bars in teal color, showing a gradual decrease. The image depicts a series of vertical bars in teal color, showing a gradual decrease in height from left to right. A large red downward-pointing arrow overlays the bars, emphasizing the trend of decline in the data represented. This visual is commonly used to illustrate decreasing performance, sales, or other metrics over time