Free with trial A three-dimensional bar graph composed of translucent blue bars illustrates a significant downward trend. The bars decrease in height from left to right, and a large, transparent blue arrow points downwards, reinforcing the concept of decline. The graph is set against a gradient blue background, creating a sense of depth and focus on the data visualization. Arrow showing decrease illustrations A3D Rendered Blue Bar Graph Showing a Downward Trend with a Falling Arrow chart data. A three-dimensional bar graph composed of translucent blue bars illustrates a significant downward trend. The bars decrease in height from left to right, and a large, transparent blue arrow points downwards, reinforcing the concept of decline. The graph is set against a gradient blue background, creating a sense of depth and focus on the data visualization
Free with trial Green line graph on a pink background with a downward arrow. Business trend showing decline and fall. Financial analysis and performance concept. Arrow showing decrease illustrations Green line graph on a pink background with a downward arrow. Business trend showing decline and fall
Free with trial Signs showing black arrow pointing down on descending steps icon keywords: arrow, down, descending, steps. Arrow showing decrease illustrations Black arrow pointing down on descending steps icon Keywords: arrow, down, descending, steps
Free with trial A conceptual image depicting low dopamine levels. Wooden letter blocks spell DOPAMINE, accompanied by a sad face and a downward arrow, illustrating a decrease in this crucial neurotransmitter. (AI-Generated Content). Arrow showing decrease illustrations Dopamine word blocks showing low levels and sad mood health concept. A conceptual image depicting low dopamine levels. Wooden letter blocks spell DOPAMINE, accompanied by a sad face and a downward arrow, illustrating a decrease in this crucial neurotransmitter. (AI-Generated Content)
Free with trial Black and white icon of a bar graph with a diagonal arrow indicating a sharp decline. Arrow showing decrease illustrations Falling bar graph with diagonal arrow showing sharp decline bar chart. Black and white icon of a bar graph with a diagonal arrow indicating a sharp decline
Free with trial Burning red arrow falling over digital world map showing global economic crisis, financial recession, and market collapse visualization. Arrow showing decrease illustrations Burning red arrow falling over digital world map showing global economic crisis, financial recession
Free with trial A black line graph icon showing a downward trend with an arrow pointing down on a white background. Arrow showing decrease illustrations Downward Trend Graph Icon with Arrow on White Background chart decline. A black line graph icon showing a downward trend with an arrow pointing down on a white background
Free with trial Black icon illustrating a downward sloping graph with an arrow indicating decline on a white background. Arrow showing decrease illustrations Black icon showing a downward sloping graph with an arrow chart decline. Black icon illustrating a downward sloping graph with an arrow indicating decline on a white background
Free with trial A colorful bar chart illustrates a downward trend, with a prominent red arrow indicating a significant decrease in data. Arrow showing decrease illustrations Bar chart showing declining trend with red arrow. A colorful bar chart illustrates a downward trend, with a prominent red arrow indicating a significant decrease in data
Free with trial Downward glowing arrow over planet earth. Concept showing global economic crisis or financial downturn. Digital data visualization for business analysis. Arrow showing decrease illustrations Downward glowing arrow over planet earth. Concept showing global economic crisis or financial downturn
Free with trial Green up and red down 3d arrow graph showing rising, descending trend, business result, profit or loss symbol symbol. Business arrow, goals concept. 3d world money symbols. Financial growth vector isolated. Arrow showing decrease vectors Green up and red down 3d arrow graph showing rising, descending trend, business result, profit. world money symbols. Green up and red down 3d arrow graph showing rising, descending trend, business result, profit or loss symbol symbol. Business arrow, goals concept. 3d world money symbols. Financial growth vector isolated
Free with trial Green up and red down 3d arrow graph showing rising, descending trend, business result, profit or loss symbol symbol. Business arrow, goals concept. 3d world money symbols. Financial growth vector isolated. Arrow showing decrease vectors Green up and red down 3d arrow graph showing rising, descending trend, business result, profit. world money symbols. Green up and red down 3d arrow graph showing rising, descending trend, business result, profit or loss symbol symbol. Business arrow, goals concept. 3d world money symbols. Financial growth vector isolated
Free with trial Green up and red down 3d arrow graph showing rising, descending trend, business result, profit or loss symbol symbol. Business arrow, goals concept. 3d world money symbols. Financial growth vector isolated. Arrow showing decrease vectors Green up and red down 3d arrow graph showing rising, descending trend, business result, profit. world money symbols. Green up and red down 3d arrow graph showing rising, descending trend, business result, profit or loss symbol symbol. Business arrow, goals concept. 3d world money symbols. Financial growth vector isolated
Free with trial A close-up of a stock market graph displayed on a screen, illustrating a substantial decrease in value, highlighted by a prominent red arrow pointing downwards, indicating a sharp decline in the market. Arrow showing decrease illustrations Stock market graph showing a significant downward trend with a large red arrow indicating decline. A close-up of a stock market graph displayed on a screen, illustrating a substantial decrease in value, highlighted by a prominent red arrow pointing downwards, indicating a sharp decline in the market
Free with trial Arrow Crashing Showing Difficult Situation And Problem. Arrow showing decrease illustrations Arrow Crashing Indicates Tight Spot And Decrease. Arrow Crashing Showing Difficult Situation And Problem
Free with trial A modern vector illustration of a line graph showing a clear decline, emphasized by a red downtrend arrow. Ideal for financial reports, business presentations, or data visualization projects illustrating negative trends or decreases. This graphic effectively communicates a downward movement in statistics, vector design Generative AI. Arrow showing decrease vectors Declining Line Graph with Red Downtrend Arrow, vector design Generative AI. A modern vector illustration of a line graph showing a clear decline, emphasized by a red downtrend arrow. Ideal for financial reports, business presentations, or data visualization projects illustrating negative trends or decreases. This graphic effectively communicates a downward movement in statistics, vector design Generative AI
Free with trial A stark red arrow zigzags downwards, symbolizing a significant financial or economic downturn and a sharp decrease. Arrow showing decrease illustrations Red arrow chart showing sharp decline and downturn. A stark red arrow zigzags downwards, symbolizing a significant financial or economic downturn and a sharp decrease
Free with trial Green arrow showing a downward trend in a dark hallway. Concept of business decline or falling performance in an organization or education. Arrow showing decrease illustrations Green arrow showing a downward trend in a dark hallway. Concept of business decline or falling performance
Free with trial Financial crisis. Disappointed person showing empty pockets. Market fall, cart showing arrow going down. Economy collapse concept. Employee without money, poverty vector illustration. Arrow showing decrease illustrations Financial crisis. Disappointed person showing empty pockets. Market fall, cart showing arrow going down. Economy
Free with trial Downward showing black downward pointing arrow at an angle on a white background keywords: arrow, down. Arrow showing decrease illustrations Black downward pointing arrow at an angle on a white background Keywords: arrow, down, downward. Downward showing black downward pointing arrow at an angle on a white background keywords: arrow, down
Free with trial Economy downturn concept showing declining bar graph with red arrow, background,. Arrow showing decrease illustrations Economy downturn concept showing declining bar graph with red arrow, background
Free with trial Yellow arrow diagram showing a downward trend over an empty, gloomy playground with swings and a slide, conceptualizing economic recession or decline in youth activity. Arrow showing decrease illustrations Yellow arrow diagram showing a downward trend over an empty, gloomy playground with swings and a slide, conceptualizing economic
Free with trial Black and white graph showing a fluctuating trend line with an upward and a downward arrow. Arrow showing decrease illustrations Black and white graph showing fluctuating trend with up and down arrows chart data. Black and white graph showing a fluctuating trend line with an upward and a downward arrow
Free with trial A black icon showing two bars of different heights with a downward arrow pointing to the smaller bar. Arrow showing decrease illustrations Black icon of two bars with a downward arrow pointing to the smaller bar chart. A black icon showing two bars of different heights with a downward arrow pointing to the smaller bar
Free with trial Bar chart with six vertical blue bars of descending height, indicating a negative trend. A jagged red arrow slants downward from left to right across the bars, emphasizing the decrease. No specific location is provided. Arrow showing decrease vectors Financial bar chart showing downward trend with red arrow. Bar chart with six vertical blue bars of descending height, indicating a negative trend. A jagged red arrow slants downward from left to right across the bars, emphasizing the decrease. No specific location is provided.
Free with trial Orange bar chart with downward arrow showing decline in industrial production. Manufacturing business downturn with economic crisis concept. Arrow showing decrease illustrations Orange bar chart with downward arrow showing decline in industrial production
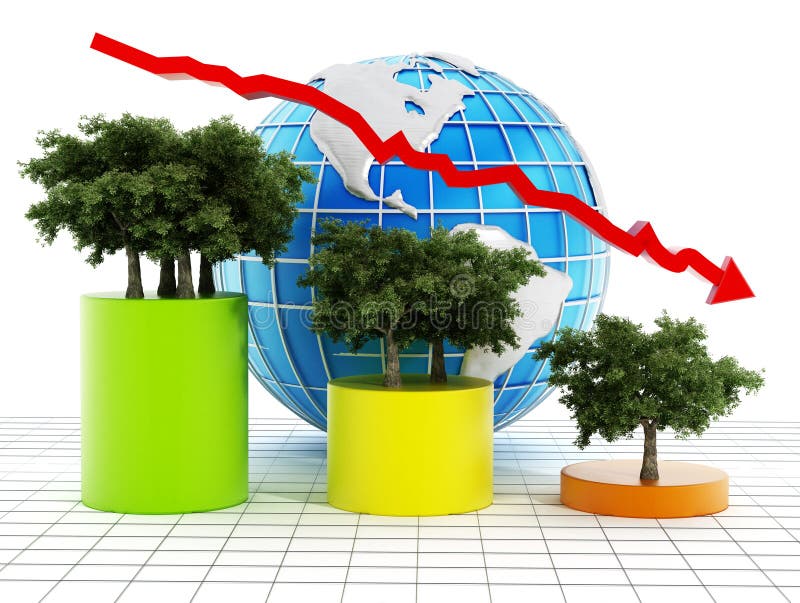
Free with trial Graphic with showing the decrease of tree population on earth. Arrow showing decrease illustrations Graphic showing the decrease of tree population on earth.
Free with trial A black graph showing an upward trend with a curved arrow indicating a reversal on a white background. Arrow showing decrease illustrations Upward trending graph with a curved arrow indicating a reversal on white background. A black graph showing an upward trend with a curved arrow indicating a reversal on a white background
Free with trial A black line graph depicting a downward trend with an arrow on a white background Clear details and vibrant co. Arrow showing decrease illustrations Black line graph showing a downward trend with an arrow chart decline. A black line graph depicting a downward trend with an arrow on a white background Clear details and vibrant co
Free with trial Blue arrow pointing downward on financial graph. Business chart showing descending trend. Digital stock market data visualization for decline analysis. Arrow showing decrease illustrations Blue arrow pointing downward on financial graph. Business chart showing descending trend
Free with trial Green up and red down 3d arrow graph showing rising, descending trend, business result, profit or loss symbol symbol. Business arrow, goals concept. 3d world money symbols. Financial growth. Arrow showing decrease illustrations Green up and red down 3d arrow graph showing rising, descending trend, business result, 3d world money symbols. Financial growth. Green up and red down 3d arrow graph showing rising, descending trend, business result, profit or loss symbol symbol. Business arrow, goals concept. 3d world money symbols. Financial growth
Free with trial Green up and red down 3d arrow graph showing rising, descending trend, business result, profit or loss symbol symbol. Business arrow, goals concept. 3d world money symbols. Financial growth. Arrow showing decrease illustrations Green up and red down 3d arrow graph showing rising, descending trend, business result, 3d world money symbols. Financial growth. Green up and red down 3d arrow graph showing rising, descending trend, business result, profit or loss symbol symbol. Business arrow, goals concept. 3d world money symbols. Financial growth
Free with trial Green up and red down 3d arrow graph showing rising, descending trend, business result, profit or loss symbol symbol. Business arrow, goals concept. 3d world money symbols. Financial growth. Arrow showing decrease illustrations Green up and red down 3d arrow graph showing rising, descending trend, business result, 3d world money symbols. Financial growth. Green up and red down 3d arrow graph showing rising, descending trend, business result, profit or loss symbol symbol. Business arrow, goals concept. 3d world money symbols. Financial growth
Free with trial Red 3d down arrow showing a financial decrease or discount, next to a silver percentage sign on a blue background. Arrow showing decrease illustrations Red arrow pointing down with percentage symbol. Red 3d down arrow showing a financial decrease or discount, next to a silver percentage sign on a blue background
Free with trial Green up and red down 3d arrow graph showing rising, descending trend, business result, profit or loss symbol symbol. Business arrow, goals concept. 3d world money symbols. Financial growth. Arrow showing decrease illustrations Green up and red down 3d arrow graph showing rising, descending trend, business result, 3d world money symbols. Financial growth. Green up and red down 3d arrow graph showing rising, descending trend, business result, profit or loss symbol symbol. Business arrow, goals concept. 3d world money symbols. Financial growth
Free with trial A black icon showing a bar graph with a downward trending arrow indicating a decline. Arrow showing decrease illustrations Black bar graph with downward trending arrow icon on white background chart decline. A black icon showing a bar graph with a downward trending arrow indicating a decline
Free with trial Fall down chart, financial crisis. Decreasing arrow showing bankruptcy. Bad economic statistics with income loss. Money or price reduction report symbols, recession concept isolated vector set. Arrow showing decrease vectors Fall down chart, financial crisis. Decreasing arrow showing bankruptcy. Bad economic statistics with income loss
Free with trial A versatile collection of colorful down arrow icons, presented in a modern flat design style. This set features a variety of arrow shapes and styles in vibrant shades of blue, green, yellow, and red, all pointing downwards on a light background. These clean, vector graphic elements are perfect for user interface (UI) design, web buttons, download symbols, infographics showing a decrease or negative trend, and navigation indicators in apps or presentations. An essential toolkit for any graphic designer's collection. Arrow showing decrease vectors Colorful Flat Design Down Arrow Icon Set. A versatile collection of colorful down arrow icons, presented in a modern flat design style. This set features a variety of arrow shapes and styles in vibrant shades of blue, green, yellow, and red, all pointing downwards on a light background. These clean, vector graphic elements are perfect for user interface (UI) design, web buttons, download symbols, infographics showing a decrease or negative trend, and navigation indicators in apps or presentations. An essential toolkit for any graphic designer's collection.
Free with trial A bright yellow arrow curves downwards indicating a downward trend, decrease, or decline. Ideal for presentations on finance, market analysis, or performance changes. Arrow showing decrease illustrations Yellow arrow pointing downward showing a decline or falling trend. A bright yellow arrow curves downwards indicating a downward trend, decrease, or decline. Ideal for presentations on finance, market analysis, or performance changes
Free with trial A focused hand uses red chalk drawing downward arrow on blackboard showing negative business concept and pessimistic financial decline. Arrow showing decrease illustrations Focused hand uses red chalk drawing downward arrow on blackboard showing negative business concept and pessimistic financial
Free with trial Doodle style business chart showing decline with a downwards arrow. Arrow showing decrease vectors Doodle style business chart showing decline with a downwards arrow
Free with trial A 3D rendered blue arrow symbol, depicted as a zig-zag line with an arrowhead pointing downwards, signifies a negative trend or decline. The object is isolated on a clean white background, making it suitable for representing financial data, economic downturns, or performance metrics. Arrow showing decrease illustrations 3D Blue Arrow Graph Showing Downward Trend on White Background decrease. A 3D rendered blue arrow symbol, depicted as a zig-zag line with an arrowhead pointing downwards, signifies a negative trend or decline. The object is isolated on a clean white background, making it suitable for representing financial data, economic downturns, or performance metrics
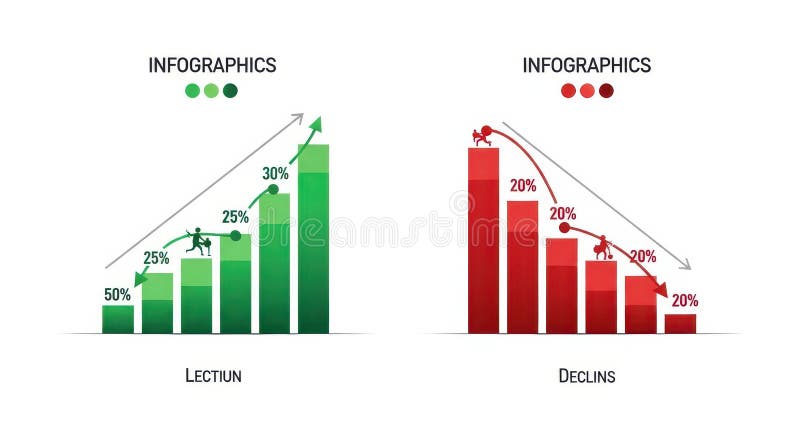
Free with trial The image displays two infographics side by side. the left infographic, titled "lection," depicts a green bar graph showing growth, starting at 50% and increasing to 30% with a figure climbing the bars. an upward-pointing arrow indicates positive growth. the right infographic, titled "declins," shows a red bar graph illustrating decline, starting at 20% and decreasing to 20% with a figure falling down the bars. a downward-pointing arrow indicates negative growth. Arrow showing decrease illustrations Infographics showing growth and decline charts. the image displays two infographics side by side. the left infographic, titled "lection," depicts a green bar graph showing growth, starting at 50% and increasing to 30% with a figure climbing the bars. an upward-pointing arrow indicates positive growth. the right infographic, titled "declins," shows a red bar graph illustrating decline, starting at 20% and decreasing to 20% with a figure falling down the bars. a downward-pointing arrow indicates negative growth.
Free with trial Blue flat visualization showing bar chart and downward arrow over data grid with world map overlay. Analytics, finance, data analysis, digital, infographic, corporate, trend. Arrow showing decrease illustrations Blue flat visualization showing bar chart and downward arrow over data grid with world map overlay
Free with trial Financial crisis. Poor depressed woman standing near falling arrow and stack of banknotes showing market fall. Company bankruptcy, worker losing money, empty pockets. Crash of economy vector. Arrow showing decrease vectors Financial crisis. Poor depressed woman standing near falling arrow and stack of banknotes showing market fall. Company
Free with trial A flat icon of a bar chart with a downward arrow and a dollar symbol, representing financial loss, market decline, decreased revenue, negative performance, economic downturns, and investment risks in business environments. Arrow showing decrease vectors Declining financial chart icon with downward arrow showing loss decrease and negative dollar trend. A flat icon of a bar chart with a downward arrow and a dollar symbol, representing financial loss, market decline, decreased revenue, negative performance, economic downturns, and investment risks in business environments.
Free with trial A black bar chart showing a downward trend with an arrow on a white background. Clear details and vibrant colo. Arrow showing decrease illustrations Black downward trending bar chart with arrow on white background graph. A black bar chart showing a downward trend with an arrow on a white background. Clear details and vibrant colo
Free with trial Red 3D zigzag arrow is showing downward trend on white background, subtle shadowing, copy space. Progress, decline, analytics, chart, visualization, presentation, digital. Arrow showing decrease illustrations Red 3D zigzag arrow is showing downward trend on white background, subtle shadowing, copy space
Free with trial A neon glowing graph with blue bars and pink zigzag arrow showing fluctuating growth on black background. Generative AI. Arrow showing decrease illustrations Neon glowing graph with blue bars and pink zigzag arrow showing fluctuating growth on black background
Free with trial This striking graphic illustrates a significant economic downturn or market crash with a bold red arrow plunging downwards. Rendered by Ai, the image uses simple colors to maximize impact setting the alarming decline against subtle background charts. It effectively communicates concepts of loss decrease and a strong negative trend in business metrics. Arrow showing decrease illustrations Red arrow showing sharp financial market decline. This striking graphic illustrates a significant economic downturn or market crash with a bold red arrow plunging downwards. Rendered by Ai, the image uses simple colors to maximize impact setting the alarming decline against subtle background charts. It effectively communicates concepts of loss decrease and a strong negative trend in business metrics
Free with trial Business decline, performance decrease, market loss or economic failure. Data download. Black cube is showing an arrow symbol on a dark background with reflection. 3d render. Arrow showing decrease illustrations Black cube showing download symbol with yellow glowing light. Business decline, performance decrease, market loss or economic failure. Data download. Black cube is showing an arrow symbol on a dark background with reflection. 3d render
Free with trial The image depicts a bar chart with a downward trend. The bars, colored in blue, gradually decrease in height, indicating a decline. A large red arrow, pointing downwards, further emphasizes the downward trend. The chart is displayed on an easel, suggesting a presentation or analysis context. Arrow showing decrease illustrations Chart showing decline. The image depicts a bar chart with a downward trend. The bars, colored in blue, gradually decrease in height, indicating a decline. A large red arrow, pointing downwards, further emphasizes the downward trend. The chart is displayed on an easel, suggesting a presentation or analysis context
Free with trial Percentage with up and down arrows line icon. Percent symbol showing increase and decrease. Financial analytics sign for banking, credit, interest rates, statistics, and economic trends. Arrow showing decrease vectors Percentage with up and down arrows line icon. Percent symbol showing increase and decrease. Financial analytics sign for banking
Free with trial Simple black and white vector illustration showing bar charts indicating increase and decrease, perfect for financial or data concepts. Arrow showing decrease vectors Bar chart icon showing increase and decrease data. Simple black and white vector illustration showing bar charts indicating increase and decrease, perfect for financial or data concepts
Free with trial The image features two arrows, one green pointing upwards and one red pointing downwards. The green arrow on the left signifies an upward direction, often indicating increase or improvement. The red arrow on the right signifies a downward direction, typically representing decrease or decline. These arrows are commonly used in various contexts to indicate movement or status changes. Arrow showing decrease illustrations Arrows showing up and down. The image features two arrows, one green pointing upwards and one red pointing downwards. The green arrow on the left signifies an upward direction, often indicating increase or improvement. The red arrow on the right signifies a downward direction, typically representing decrease or decline. These arrows are commonly used in various contexts to indicate movement or status changes
Free with trial The image depicts a bar graph with a downward trend. The graph has blue bars representing data values that decrease from left to right. A large red arrow further emphasizes the downward trend, indicating a significant decline in the data over time. The graph is displayed on an easel with wooden legs. Arrow showing decrease illustrations Graph showing decline in data. The image depicts a bar graph with a downward trend. The graph has blue bars representing data values that decrease from left to right. A large red arrow further emphasizes the downward trend, indicating a significant decline in the data over time. The graph is displayed on an easel with wooden legs
Free with trial Bar chart icon with downward arrow showing declining business performance, financial loss, recession, negative trend, market crash analytics and falling sales report. Arrow showing decrease vectors Bar chart icon with downward arrow showing declining business performance, financial
Free with trial Gear mechanism showing a large downward arrow surrounded by smaller blue figures, illustrating a concept of decline, decrease, or negative trend within a system or process. Arrow showing decrease vectors Economic downfall concept with downward arrow in gear. Gear mechanism showing a large downward arrow surrounded by smaller blue figures, illustrating a concept of decline, decrease, or negative trend within a system or process
Free with trial Modern 3D style arrow icon showing upward and downward directions in bold red color. Arrow showing decrease illustrations Red upward and downward arrow icon. Modern 3D style arrow icon showing upward and downward directions in bold red color
Free with trial Arrow Falling On Monitors Showing Monetary Crisis Or Bankruptcy Risk. Arrow showing decrease illustrations Arrow Falling On Monitors Showing Monetary Crisis
Free with trial A minimalist black line graph icon on a clean white background, clearly illustrating a downward trend. The zigzagging line culminates in a sharp arrow pointing downwards, symbolizing decline, decrease, or negative performance. This versatile vector illustration is ideal for representing financial losses, economic downturns, sales drops, market crashes, or any data indicating a negative trajectory. Perfect for business reports, presentations, websites, apps, and infographics requiring a clear visual indicator of reduction or poor results. Arrow showing decrease vectors Downward Trend Graph with Arrow Icon. A minimalist black line graph icon on a clean white background, clearly illustrating a downward trend. The zigzagging line culminates in a sharp arrow pointing downwards, symbolizing decline, decrease, or negative performance. This versatile vector illustration is ideal for representing financial losses, economic downturns, sales drops, market crashes, or any data indicating a negative trajectory. Perfect for business reports, presentations, websites, apps, and infographics requiring a clear visual indicator of reduction or poor results.
Free with trial Bar chart showing stock market increase and decrease. Arrow showing decrease vectors Bar chart showing stock market increase and decrease.
Free with trial A bar chart displayed on an easel, illustrating a negative trend. The bars, a mix of blue and grey, show a progressive decrease in value. A prominent red arrow curves downwards across the chart, signifying a decline or loss. The presentation suggests a financial report or business analysis with unfavorable results. Arrow showing decrease illustrations Bar chart showing a downward trend with a red arrow indicating decline. A bar chart displayed on an easel, illustrating a negative trend. The bars, a mix of blue and grey, show a progressive decrease in value. A prominent red arrow curves downwards across the chart, signifying a decline or loss. The presentation suggests a financial report or business analysis with unfavorable results
Free with trial Arrow Falling On Smartphone Showing Collapsed Finances Or Monetary Risk. Arrow showing decrease illustrations Arrow Falling On Smartphone Showing Collapsed Finances
Free with trial Business chart showing decline, red arrow down indicates financial loss, crisis, or failure. Arrow showing decrease illustrations Business graph with red arrow pointing down showing financial decline. Business chart showing decline, red arrow down indicates financial loss, crisis, or failure
Free with trial The image features a calendar with the word 'tax' prominently displayed. An arrow points downward from the calendar, leading to a stack of coins that are diminishing in number, symbolizing a reduction or decrease in tax-related funds or payments. Arrow showing decrease illustrations Calendar icon showing a decrease in tax money represented by coins. The image features a calendar with the word 'tax' prominently displayed. An arrow points downward from the calendar, leading to a stack of coins that are diminishing in number, symbolizing a reduction or decrease in tax-related funds or payments
Free with trial Falling Graphs with Red Arrow Showing Decline, Economic Recession Concept, illustration. Arrow showing decrease illustrations Falling Graphs with Red Arrow Showing Decline, Economic Recession Concept
Free with trial A 3D bar chart with purple translucent bars illustrates a declining trend, with a purple arrow pointing downwards. Arrow showing decrease illustrations 3D Bar Chart Showing Downward Trend with Arrow. A 3D bar chart with purple translucent bars illustrates a declining trend, with a purple arrow pointing downwards
Free with trial Man pictogram morphing into a downward arrow on white background, illustrating decline, decrease, falling trend or negative direction for finance, economy, data, business and social metrics. Arrow showing decrease illustrations Man icon showing data decrease or downward direction. Man pictogram morphing into a downward arrow on white background, illustrating decline, decrease, falling trend or negative direction for finance, economy, data, business and social metrics
Free with trial Businessman showing quality with up arrow and cost with down arrow for business project management strategy. Effective business, Cost and quality control. Efficiency business goals. Arrow showing decrease illustrations Businessman showing quality with up arrow and cost with down arrow for business project management strategy. Effective business
Free with trial The image depicts a dollar sign in the center with a red downward arrow on the left and a green upward arrow on the right. This visual metaphor represents financial trends, specifically a decrease and an increase in monetary value or economic indicators. Arrow showing decrease illustrations Financial trend illustration showing increase and decrease with dollar sign. The image depicts a dollar sign in the center with a red downward arrow on the left and a green upward arrow on the right. This visual metaphor represents financial trends, specifically a decrease and an increase in monetary value or economic indicators
Free with trial An image showing two arrows, one red pointing up with a percentage symbol and a white upward arrow inside, and one green pointing down with a percentage symbol and a white downward arrow inside, likely used to represent increase and decrease in percentages. Arrow showing decrease illustrations Up and down percentage arrows for increase and decrease. An image showing two arrows, one red pointing up with a percentage symbol and a white upward arrow inside, and one green pointing down with a percentage symbol and a white downward arrow inside, likely used to represent increase and decrease in percentages
Free with trial This minimalist graphic illustration features a stylized thermometer centered on a plain background. A bold red arrow curves downward next to the instrument, clearly symbolizing a decrease in temperature or a cooling process. The clean lines and simple color palette make this an effective visual representation for weather reports, climate control systems, or scientific data visualization. Arrow showing decrease vectors A flat vector icon showing a thermometer with a downward arrow indicating cooling. This minimalist graphic illustration features a stylized thermometer centered. This minimalist graphic illustration features a stylized thermometer centered on a plain background. A bold red arrow curves downward next to the instrument, clearly symbolizing a decrease in temperature or a cooling process. The clean lines and simple color palette make this an effective visual representation for weather reports, climate control systems, or scientific data visualization
Free with trial Bankruptcy showing red 3d percentage symbol with downward arrow indicating decrease. Arrow showing decrease illustrations Red 3D Percentage Symbol with Downward Arrow Indicating Decrease
Free with trial Bright vector icon illustrating financial decline with a downward arrow and decreasing bar chart representing loss. Arrow showing decrease illustrations Downward arrow icon showing financial loss with bar chart. Bright vector icon illustrating financial decline with a downward arrow and decreasing bar chart representing loss
Free with trial A 3D rendered image of a red arrow graph showing a downward trend, situated in a room with grey tiled walls and floor, illuminated by overhead lighting. Arrow showing decrease illustrations A 3d red arrow graph trending downwards in a grey tiled room. A 3D rendered image of a red arrow graph showing a downward trend, situated in a room with grey tiled walls and floor, illuminated by overhead lighting
Free with trial The image depicts a downward trend arrow on a grid background, with the arrow starting from the top left and pointing towards the bottom right, indicating a decrease or decline in data. Arrow showing decrease illustrations A graphic showing a downward trend arrow on a grid background. The image depicts a downward trend arrow on a grid background, with the arrow starting from the top left and pointing towards the bottom right, indicating a decrease or decline in data
Free with trial A 3D rendered bar chart illustrating a significant downward trend. Three blue, rounded bars are displayed on a clean white background with subtle grid lines. A prominent, bold red arrow sharply descends across the bars, clearly indicating a decline, decrease, or negative progression. This graphic is ideal for representing financial losses, market downturns, business challenges, economic recession, or any statistical data showing a negative trend. It conveys concepts of risk, failure, and reduction in a clear, impactful visual manner for presentations, reports, and analytical content. Arrow showing decrease vectors Downward Trend Bar Chart with Red Arrow. A 3D rendered bar chart illustrating a significant downward trend. Three blue, rounded bars are displayed on a clean white background with subtle grid lines. A prominent, bold red arrow sharply descends across the bars, clearly indicating a decline, decrease, or negative progression. This graphic is ideal for representing financial losses, market downturns, business challenges, economic recession, or any statistical data showing a negative trend. It conveys concepts of risk, failure, and reduction in a clear, impactful visual manner for presentations, reports, and analytical content.
Free with trial A black downward trending arrow graph showing decline on a white background. Clear details and vibrant colors. Arrow showing decrease illustrations Black downward trending arrow graph on white background chart. A black downward trending arrow graph showing decline on a white background. Clear details and vibrant colors
Free with trial The image depicts a bar chart showing a significant decline in values across five categories, accompanied by a bold downward red arrow emphasizing the sharp decrease. The bars progressively shorten from left to right, indicating a continuous drop in whatever metric is being measured. Arrow showing decrease illustrations Declining trend illustrated with bar chart and downward arrow. The image depicts a bar chart showing a significant decline in values across five categories, accompanied by a bold downward red arrow emphasizing the sharp decrease. The bars progressively shorten from left to right, indicating a continuous drop in whatever metric is being measured