Free with trial Blue showing 3d blue downward arrow icon on a white background. Arrow showing decrease illustrations 3D Blue Downward Arrow Icon on a White Background Keywords: arrow, down, downward, direction, move, navigation, download, reduce. Blue showing 3d blue downward arrow icon on a white background
Free with trial Heartbeat line morphs into falling red arrow on dark grid, showing sudden economic flatline. Vector illustration. Concept of downturn, crisis mode, emergency slowdown, collapse, instability. Arrow showing decrease vectors Heartbeat line morphs into falling red arrow on dark grid, showing sudden economic flatline. Vector illustration.
Free with trial Generative ai, The image is of a red arrow pointing down, superimposed on a blue and red bar graph, symbolizing a downward trend, potentially indicating a financial or economic decline. Arrow showing decrease illustrations A large red arrow points downwards over a gridded financial chart showing a sharp decline in value, with the bars of the chart. generative ai, The image is of a red arrow pointing down, superimposed on a blue and red bar graph, symbolizing a downward trend, potentially indicating a financial or economic decline
Free with trial Set of linear graphs with red and blue lines showing different trends and dynamics vector illustration. Change in time of election results or income. For business analytics, financial reports. Arrow showing decrease vectors Set of linear graphs with red and blue lines showing different trends and dynamics vector illustration. Change in time of election
Free with trial Business financial decline chart showing significant loss. Hand draws a downward orange arrow on a dark blue chalkboard with ample copy space. Ideal for economic analysis, corporate presentations, and marketing materials. Arrow showing decrease illustrations Business Financial Decline Chart. Hand drawing bar graph with downward orange arrow on blue chalkboard background, copy space. Business financial decline chart showing significant loss. Hand draws a downward orange arrow on a dark blue chalkboard with ample copy space. Ideal for economic analysis, corporate presentations, and marketing materials.
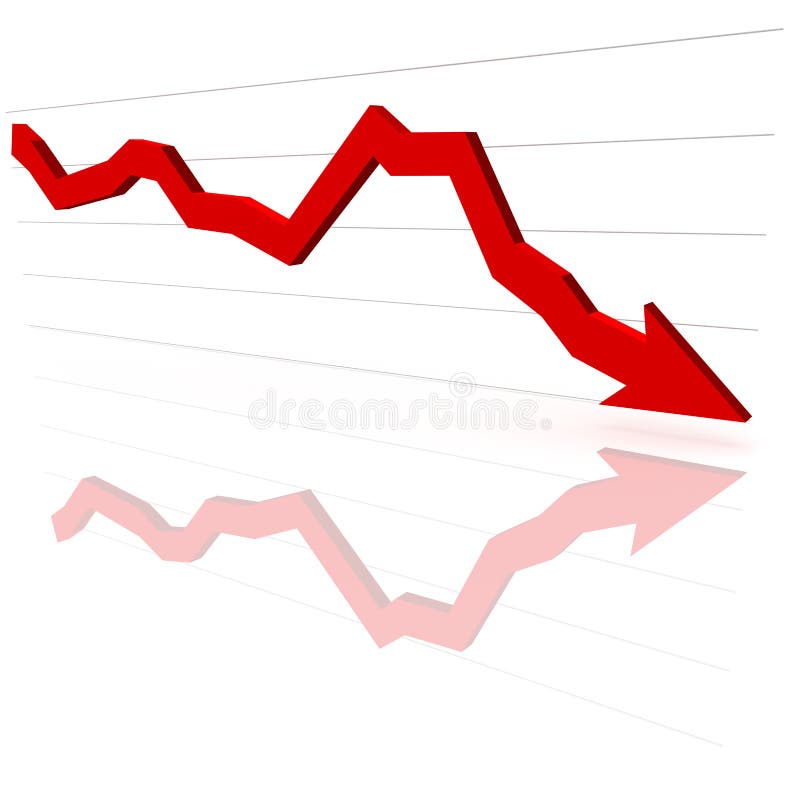
Free with trial A glowing red zigzag arrow points downward, representing a decline on a digital financial chart. The surface is gridded and dark, highlighting the red of the arrow. The arrow has a neon-like appearance and reflects off the glossy surface, signaling a decrease in value. The surrounding chart includes descending graphical elements indicating fluctuating data, conveying a downturn in financial performance or market trends. Arrow showing decrease illustrations A large red arrow points downwards over a gridded financial chart showing a sharp decline in value. A glowing red zigzag arrow points downward, representing a decline on a digital financial chart. The surface is gridded and dark, highlighting the red of the arrow. The arrow has a neon-like appearance and reflects off the glossy surface, signaling a decrease in value. The surrounding chart includes descending graphical elements indicating fluctuating data, conveying a downturn in financial performance or market trends.
Free with trial A glowing red zigzag arrow points downward, representing a decline on a digital financial chart. The surface is gridded and dark, highlighting the red of the arrow. The arrow has a neon-like appearance and reflects off the glossy surface, signaling a decrease in value. The surrounding chart includes descending graphical elements indicating fluctuating data, conveying a downturn in financial performance or market trends. Arrow showing decrease illustrations A large red arrow points downwards over a gridded financial chart showing a sharp decline in value. A glowing red zigzag arrow points downward, representing a decline on a digital financial chart. The surface is gridded and dark, highlighting the red of the arrow. The arrow has a neon-like appearance and reflects off the glossy surface, signaling a decrease in value. The surrounding chart includes descending graphical elements indicating fluctuating data, conveying a downturn in financial performance or market trends.
Free with trial A glowing red zigzag arrow points downward, representing a decline on a digital financial chart. The surface is gridded and dark, highlighting the red of the arrow. The arrow has a neon-like appearance and reflects off the glossy surface, signaling a decrease in value. The surrounding chart includes descending graphical elements indicating fluctuating data, conveying a downturn in financial performance or market trends. Arrow showing decrease illustrations A large red arrow points downwards over a gridded financial chart showing a sharp decline in value. A glowing red zigzag arrow points downward, representing a decline on a digital financial chart. The surface is gridded and dark, highlighting the red of the arrow. The arrow has a neon-like appearance and reflects off the glossy surface, signaling a decrease in value. The surrounding chart includes descending graphical elements indicating fluctuating data, conveying a downturn in financial performance or market trends.
Free with trial A glowing red zigzag arrow points downward, representing a decline on a digital financial chart. The surface is gridded and dark, highlighting the red of the arrow. The arrow has a neon-like appearance and reflects off the glossy surface, signaling a decrease in value. The surrounding chart includes descending graphical elements indicating fluctuating data, conveying a downturn in financial performance or market trends. Arrow showing decrease illustrations A large red arrow points downwards over a gridded financial chart showing a sharp decline in value. A glowing red zigzag arrow points downward, representing a decline on a digital financial chart. The surface is gridded and dark, highlighting the red of the arrow. The arrow has a neon-like appearance and reflects off the glossy surface, signaling a decrease in value. The surrounding chart includes descending graphical elements indicating fluctuating data, conveying a downturn in financial performance or market trends.
Free with trial A glowing red zigzag arrow points downward, representing a decline on a digital financial chart. The surface is gridded and dark, highlighting the red of the arrow. The arrow has a neon-like appearance and reflects off the glossy surface, signaling a decrease in value. The surrounding chart includes descending graphical elements indicating fluctuating data, conveying a downturn in financial performance or market trends. Arrow showing decrease illustrations A large red arrow points downwards over a gridded financial chart showing a sharp decline in value. A glowing red zigzag arrow points downward, representing a decline on a digital financial chart. The surface is gridded and dark, highlighting the red of the arrow. The arrow has a neon-like appearance and reflects off the glossy surface, signaling a decrease in value. The surrounding chart includes descending graphical elements indicating fluctuating data, conveying a downturn in financial performance or market trends.
Free with trial Coronavirus economic crisis isometric vector illustration. Business column chart with red arrow and falling column showing recession and crisis of economy and banking indicators because of covid. Arrow showing decrease vectors Coronavirus economic crisis isometric vector illustration - business column chart with red arrow and falling column. Coronavirus economic crisis isometric vector illustration. Business column chart with red arrow and falling column showing recession and crisis of economy and banking indicators because of covid.
Free with trial Coronavirus economic and financial crisis isometric vector illustration. Decrease of golden coin heaps with red decline arrow surrounded by covid viruses showing global crisis of economy. Arrow showing decrease vectors Coronavirus economic and financial crisis isometric vector illustration.
Free with trial Graph showing decrease in profits or earnings in 3D on white background. Arrow showing decrease illustrations Decrease
Free with trial Arrow over world map showing the future. Arrow showing decrease illustrations Arrows. Arrow over world map showing the future
Free with trial Digital illustration of business graph with arrow showing growth and profit. Arrow showing decrease illustrations Business graph
Free with trial Financial 3D graph showing decrease in profits. Arrow showing decrease illustrations Financial 3D graph
Free with trial The red 3d diagram showing losses. Arrow showing decrease illustrations The red 3d diagram showing losses
Free with trial Digital illustration of business graph with arrow showing growth and profit. Arrow showing decrease illustrations Business graph
Free with trial Digital illustration of business graph with arrow showing growth and profit. Arrow showing decrease illustrations Business graph
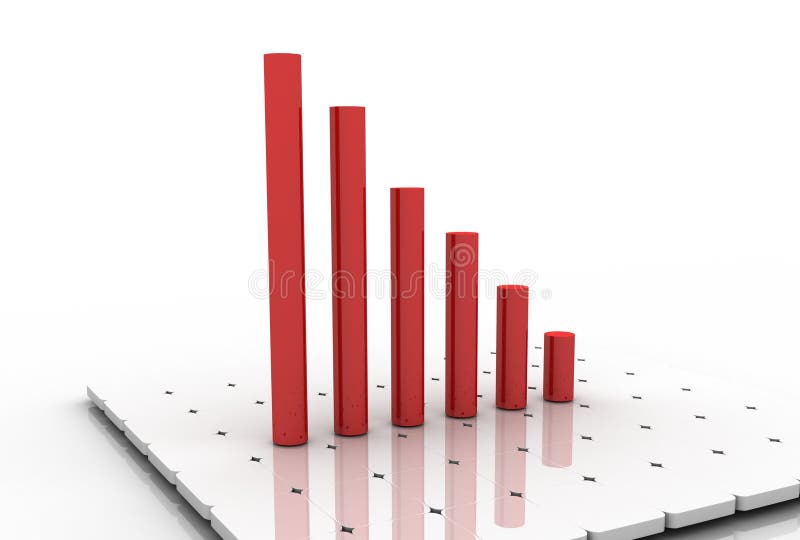
Free with trial Bar graph with data showing falling trend, 3d render. Arrow showing decrease illustrations Bar graph showing falling trend, 3d render. Bar graph with data showing falling trend, 3d render
Free with trial Digital illustration of business graph with arrow showing growth and profit. Arrow showing decrease illustrations Business graph
Free with trial Financial 3D graph showing decrease in profits. Arrow showing decrease illustrations Financial 3D graph
Free with trial Minimalist vector illustration showing a black diagram with a downward arrow symbolizing economic decline, financial loss, recession, or negative business performance. Clean and modern design isolated on a white background, ideal for business presentations, financial reports, infographics, websites, mobile apps, and marketing materials related to economics, finance, investment, and analytics. Arrow showing decrease vectors . Minimalist vector illustration showing a black diagram with a downward arrow symbolizing economic decline, financial loss, recession, or negative business performance. Clean and modern design isolated on a white background, ideal for business presentations, financial reports, infographics, websites, mobile apps, and marketing materials related to economics, finance, investment, and analytics.
Free with trial Businessman with thumb down over graph showing crisis, geometric pattern. Arrow showing decrease illustrations Falling down of economic activity, geometric pattern. Businessman with thumb down over graph showing crisis, geometric pattern
Free with trial Financial Crisis, Dollar Fall Down. USD Inflation. Falling Currency Symbol With Neon Arrows Showing Economic Decline And Market Drop In Futuristic Style. Dynamic Finance Concept. Vector Illustration. Arrow showing decrease vectors Financial Crisis, Dollar Fall Down. USD Inflation. Falling Currency Symbol With Neon Arrows Showing Economic Decline And
Free with trial A simple illustration of a bar chart with a downward arrow showing decline, loss, negative growth, or decreasing business and financial performance. Arrow showing decrease vectors Financial Loss Graph Symbol. A simple illustration of a bar chart with a downward arrow showing decline, loss, negative growth, or decreasing business and. A simple illustration of a bar chart with a downward arrow showing decline, loss, negative growth, or decreasing business and financial performance
Free with trial Financial Crisis, Dollar Fall Down. USD Inflation. Falling Currency Symbol With Neon Arrows Showing Economic Decline And Market Drop In Futuristic Style. Dynamic Finance Concept. Vector Illustration. Arrow showing decrease vectors Financial Crisis, Dollar Fall Down. USD Inflation. Falling Currency Symbol With Neon Arrows Showing Economic Decline And
Free with trial Dual financial chart with green upward and red downward bars and coin accents, ideal for finance articles, market reports, stock visuals, and economic presentations. Arrow showing decrease vectors Stock market bar chart showing rising green bars and falling red bars with coins. Dual financial chart with green upward and red downward bars and coin accents, ideal for finance articles, market reports, stock visuals, and economic presentations
Free with trial A simple illustration of a bar chart with a downward arrow showing decline, loss, negative growth, or decreasing business and financial performance. Arrow showing decrease vectors Downward Trend Analytics Icon. A simple illustration of a bar chart with a downward arrow showing decline, loss, negative growth, or decreasing business and financial performance
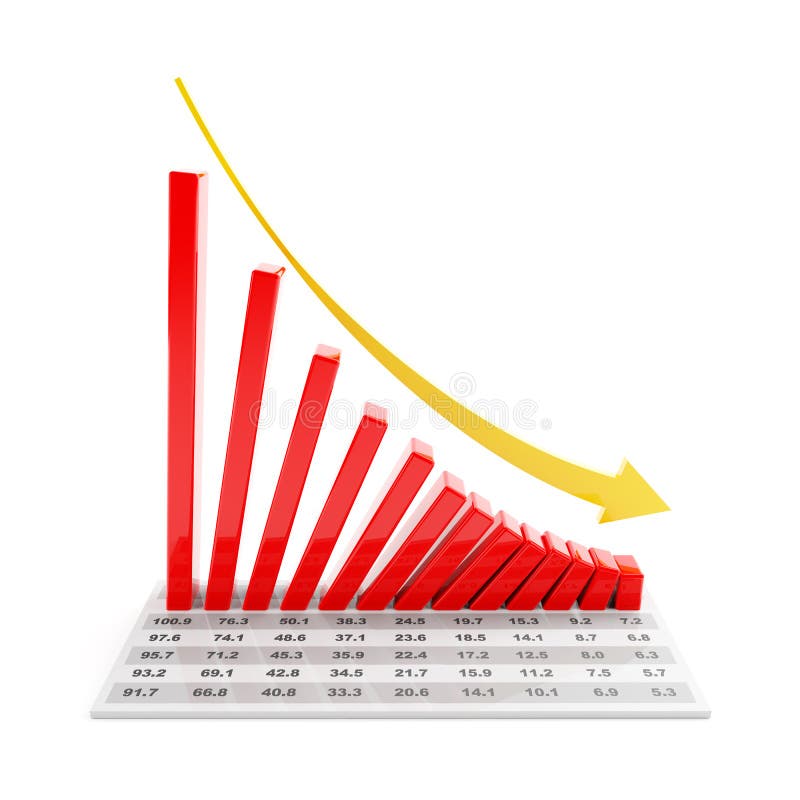
Free with trial A 3D illustration of a financial bar chart showing a drastic decline with a red arrow, symbolizing a stock market crash, recession, and economic loss. Arrow showing decrease illustrations Market Crash 3D Bar Chart with Downward Arrow. A 3D illustration of a financial bar chart showing a drastic decline with a red arrow, symbolizing a stock market crash, recession, and economic loss
Free with trial A simple illustration of a bar chart with a downward arrow showing decline, loss, negative growth, or decreasing business and financial performance. Arrow showing decrease vectors Business Decline Chart Illustration. A simple illustration of a bar chart with a downward arrow showing decline, loss, negative growth, or decreasing business and financial performance
Free with trial Bar graph with data showing falling trend, 3d render. Arrow showing decrease illustrations Bar graph showing falling trend, 3d render. Bar graph with data showing falling trend, 3d render
Free with trial Zigzag Downward Arrow Showing Falling Trend, Business Loss and Market Decline Concept on White Background. Arrow showing decrease vectors Market Decline Concept on White Background
Free with trial A clean, flat design set of icons showing upward and downward arrows and a bar graph, perfect for illustrating financial trends, data, or concepts. Arrow showing decrease vectors Green up arrow, red down arrow, and bar chart. A clean, flat design set of icons showing upward and downward arrows and a bar graph, perfect for illustrating financial trends, data, or concepts
Free with trial An illustration showing a declining blue bar graph with a sad person icon next to a downward arrow in flat style. Arrow showing decrease vectors Declining bar graph with a sad person illustration. An illustration showing a declining blue bar graph with a sad person icon next to a downward arrow in flat style.
Free with trial A contrasting vector graphic set showing rising green bars with an upward arrow and falling red bars with a downward arrow, representing financial growth and decline. Arrow showing decrease vectors Business bar charts indicating growth and decline. A contrasting vector graphic set showing rising green bars with an upward arrow and falling red bars with a downward arrow, representing financial growth and decline
Free with trial Simple flat design vector icons depicting stacks of coins with arrows showing increase and decrease trends for financial concepts. Arrow showing decrease vectors Coin stacks with arrows indicating financial change. Simple flat design vector icons depicting stacks of coins with arrows showing increase and decrease trends for financial concepts
Free with trial Two simple icons representing financial market performance, one showing a downward trend and the other an upward trend, both with dollar symbols. Arrow showing decrease vectors Financial graph icons showing market trends up and down. Two simple icons representing financial market performance, one showing a downward trend and the other an upward trend, both with dollar symbols
Free with trial Simple graphic depicting coin stacks increasing and decreasing with arrows, symbolizing financial growth and decline. Flat design vector. Arrow showing decrease vectors Stacks of coins showing financial increase and decrease. Simple graphic depicting coin stacks increasing and decreasing with arrows, symbolizing financial growth and decline. Flat design vector
Free with trial Flat design illustration showing downward trend with graph, coins and descending arrow. Demonstrates financial loss and market decline. Arrow showing decrease vectors Declining financial graph with downward trend and currency. Flat design illustration showing downward trend with graph, coins and descending arrow. Demonstrates financial loss and market decline.
Free with trial A bar chart showing a steady decline with a red downward arrow, symbolizing financial loss, economic downturn, business decline, or negative performance trends. Arrow showing decrease illustrations Economic Downtrend Bar Chart for Business concept 3d Rendering. A bar chart showing a steady decline with a red downward arrow, symbolizing financial loss, economic downturn, business decline, or negative performance trends
Free with trial A bar chart showing a steady decline with a red downward arrow, symbolizing financial loss, economic downturn, business decline, or negative performance trends. Arrow showing decrease illustrations Economic Downtrend Bar Chart for Business concept 3d Rendering. A bar chart showing a steady decline with a red downward arrow, symbolizing financial loss, economic downturn, business decline, or negative performance trends
Free with trial A bar chart showing a steady decline with a red downward arrow, symbolizing financial loss, economic downturn, business decline, or negative performance trends. Arrow showing decrease illustrations Economic Downtrend Bar Chart for Business concept 3d Rendering. A bar chart showing a steady decline with a red downward arrow, symbolizing financial loss, economic downturn, business decline, or negative performance trends
Free with trial A bar chart showing a steady decline with a red downward arrow, symbolizing financial loss, economic downturn, business decline, or negative performance trends. Arrow showing decrease illustrations Economic Downtrend Bar Chart for Business concept 3d Rendering. A bar chart showing a steady decline with a red downward arrow, symbolizing financial loss, economic downturn, business decline, or negative performance trends
Free with trial Flat style image displaying a decreasing blue bar chart with a percentage icon, isolated on black. Arrow showing decrease vectors Blue bar chart showing decrease with percentage symbol icon. Flat style image displaying a decreasing blue bar chart with a percentage icon, isolated on black.
Free with trial A simplified flat style icon displays a declining bar graph with arrow. Focuses on business and financial themes. Arrow showing decrease vectors Flat icon illustration showing bar chart trending downwards. A simplified flat style icon displays a declining bar graph with arrow. Focuses on business and financial themes.
Free with trial Digital financial crisis visual with downward arrow impacting a stock chart on a phone. Arrow showing decrease illustrations Digital Arrow Down on Smartphone Screen Showing Falling Stock Market Chart. Digital financial crisis visual with downward arrow impacting a stock chart on a phone
Free with trial Financial crisis. Depressed woman watching marker fall. Company bankruptcy or budget recession concept. Chart with falling arrow showing economy collapse vector. Employee losing money. Arrow showing decrease vectors Financial crisis. Depressed woman watching marker fall. Company bankruptcy or budget recession concept
Free with trial The illustration of the panda near the statistic diagram for presenting the decrease. Arrow showing decrease vectors The panda near the statistic diagram for presenting the decrease
Free with trial A bar chart showing a steady decline with a red downward arrow, symbolizing financial loss, economic downturn, business decline, or negative performance trends. Arrow showing decrease illustrations Economic Downtrend Bar Chart for Business concept 3d Rendering. A bar chart showing a steady decline with a red downward arrow, symbolizing financial loss, economic downturn, business decline, or negative performance trends
Free with trial A bar chart showing a steady decline with a red downward arrow, symbolizing financial loss, economic downturn, business decline, or negative performance trends. Arrow showing decrease illustrations Economic Downtrend Bar Chart for Business concept 3d Rendering. A bar chart showing a steady decline with a red downward arrow, symbolizing financial loss, economic downturn, business decline, or negative performance trends
Free with trial Stylized vector icon depicting a stock market downturn with an arrow pointing down and coin illustration. Flat graphic style. Arrow showing decrease vectors Stock market decline icon showing financial graph downturn trend. Stylized vector icon depicting a stock market downturn with an arrow pointing down and coin illustration. Flat graphic style.
Free with trial A graph showing negative growth with a big green arrow crashing through a floor isolated on a white background. Arrow showing decrease illustrations Sales Through The Floor Graph. A graph showing negative growth with a big green arrow crashing through a floor isolated on a white background
Free with trial A bar graph with a downward trend highlighted in neon colors, illustrating a decrease in values over time. Arrow showing decrease illustrations Graph showing a downward trend over time. A bar graph with a downward trend highlighted in neon colors, illustrating a decrease in values over time
Free with trial 3d render of stand holding tablet showing bright red descending graph, isolated on a transparent background. Arrow showing decrease vectors 3d render of stand holding tablet showing bright red descending graph
Free with trial A 3D bar graph showing a downward trend with a red arrow indicating a decline. Arrow showing decrease illustrations Decreasing bar graph with downward trend. A 3D bar graph showing a downward trend with a red arrow indicating a decline
Free with trial A detailed financial chart showing a downward trend in stock prices, represented by red candlesticks and a downward arrow. Arrow showing decrease illustrations Downward stock market trend with red candlesticks. A detailed financial chart showing a downward trend in stock prices, represented by red candlesticks and a downward arrow
Free with trial Metal barrels of oil with green and red arrows. Showing rise and fall of gasoline prices. Fuel costs. Stock market investment. Economy growth or crisis recession. Diesel gallon trade. Vector concept. Arrow showing decrease vectors Metal barrels of oil with green and red arrows. Showing rise and fall of gasoline prices. Stock market investment. Economy growth. Metal barrels of oil with green and red arrows. Showing rise and fall of gasoline prices. Fuel costs. Stock market investment. Economy growth or crisis recession. Diesel gallon trade. Vector concept
Free with trial Hand drawn 3d isometric illustration showing a blue Indian rupee currency coin next to a yellow decreasing bar chart and a downward pointing arrow on an alpha transparent background, depicting financial decline and economic recession. Arrow showing decrease vectors 3D isometric doodle of Indian rupee coin with negative growth bar chart alpha transparent. Hand drawn 3d isometric illustration showing a blue Indian rupee currency coin next to a yellow decreasing bar chart and a downward pointing arrow on an alpha transparent background, depicting financial decline and economic recession.
Free with trial Downward arrow alongside a money bag and binary code speech bubble showing cost reduction concepts. Ideal for finance, technology, coding, efficiency, investment, savings, simple flat metaphor. Arrow showing decrease illustrations Decreasing Costs with Digital Transformation and Binary Communication. Downward arrow alongside a money bag and binary code speech bubble showing cost reduction concepts. Ideal for finance, technology, coding, efficiency, investment, savings, simple flat metaphor
Free with trial A 3D rendering of a bar chart featuring three colorful columns: blue, orange, and green, increasing in height from left to right. Two prominent red downward arrows are positioned above the tallest green bar, clearly indicating a decline, decrease, or negative trend. The minimalist design on a clean white background makes it ideal for illustrating business performance, financial reports, economic downturns, sales drops, or any data visualization requiring a clear representation of a negative change or warning. Perfect for presentations, infographics, and analytical content. Arrow showing decrease vectors 3D Bar Chart with Red Downward Arrows Showing Decline. A 3D rendering of a bar chart featuring three colorful columns: blue, orange, and green, increasing in height from left to right. Two prominent red downward arrows are positioned above the tallest green bar, clearly indicating a decline, decrease, or negative trend. The minimalist design on a clean white background makes it ideal for illustrating business performance, financial reports, economic downturns, sales drops, or any data visualization requiring a clear representation of a negative change or warning. Perfect for presentations, infographics, and analytical content.
Free with trial 3D descending sort icon in ocean blue gradient color showing downward order or filter arrangement. Represents data sorting or list sequence. Arrow showing decrease illustrations 3D Ocean Blue Descending Sort Icon on white Background. 3D descending sort icon in ocean blue gradient color showing downward order or filter arrangement. Represents data sorting or list sequence
Free with trial A 3D illustration of a financial chart showing a dramatic downward trend. A large red arrow points sharply down over a series of declining blue bar graphs, symbolizing a stock market crash, economic recession, or business failure. The background features complex data and grids, representing financial analysis and market data. This image is perfect for concepts related to economic crisis, investment loss, financial risk, bankruptcy, and negative business reports. Arrow showing decrease illustrations Stock Market Crash Financial Graph. A 3D illustration of a financial chart showing a dramatic downward trend. A large red arrow points sharply down over a series of declining blue bar graphs, symbolizing a stock market crash, economic recession, or business failure. The background features complex data and grids, representing financial analysis and market data. This image is perfect for concepts related to economic crisis, investment loss, financial risk, bankruptcy, and negative business reports.
Free with trial Conceptual line art depicting a decrease in gold prices. Arrow showing decrease illustrations Gold Price Drop Magnifying Glass Showing Decreasing Value. Conceptual line art depicting a decrease in gold prices.
Free with trial A red and yellow financial chart depicts a steep downward trend. Red candlestick bars form the base, with yellow lines showing price fluctuations. A large yellow arrow clearly indicates a sharp decline, suggesting a significant market drop. Arrow showing decrease illustrations Red and Yellow Stock Market Chart with Steep Downward Trend. A red and yellow financial chart depicts a steep downward trend. Red candlestick bars form the base, with yellow lines showing price fluctuations. A large yellow arrow clearly indicates a sharp decline, suggesting a significant market drop
Free with trial The image shows a close-up of several wooden blocks arranged in a row. Each block displays a percentage symbol or an arrow indicating a downward trend, suggesting a visual representation of decreasing interest rates or economic downturn. The focus is on the concept of declining percentages. Arrow showing decrease illustrations Wooden blocks showing percentage drop. The image shows a close-up of several wooden blocks arranged in a row. Each block displays a percentage symbol or an arrow indicating a downward trend, suggesting a visual representation of decreasing interest rates or economic downturn. The focus is on the concept of declining percentages
Free with trial Two blue bar graphs are depicted against a white background. The left graph bars increasing in height with an upward curving arrow, indicating growth. The right graph bars decreasing in height. Arrow showing decrease vectors Blue bar graphs showing upward and downward trends with arrows. Two blue bar graphs are depicted against a white background. The left graph bars increasing in height with an upward curving arrow, indicating growth. The right graph bars decreasing in height
Free with trial A drawing of an Indian rupee coin falling through a spiral arrow and breaking into smaller blank coins over a black background showing economic recession alpha transparent. Arrow showing decrease vectors Indian rupee falling into a downward spiral representing inflation and devaluation alpha transparent. A drawing of an Indian rupee coin falling through a spiral arrow and breaking into smaller blank coins over a black background showing economic recession alpha transparent.
Free with trial A businessman presenting a concept of cost increase versus quality decrease with the help of visual arrows This is a good representation of business strategy financial challenges economic downturn and the need for effective resource management It shows a common corporate problem and a call for efficient solutions Focus is on the hand and arrows. Arrow showing decrease illustrations Business Strategy Showing Increased Cost and Decreased Quality Represented by Hand and Arrows. A businessman presenting a concept of cost increase versus quality decrease with the help of visual arrows This is a good representation of business strategy financial challenges economic downturn and the need for effective resource management It shows a common corporate problem and a call for efficient solutions Focus is on the hand and arrows
Free with trial This image displays four icons representing changes in percentage, with two showing an upward green arrow for positive changes and two showing a downward red arrow for negative changes. Arrow showing decrease illustrations Set of four icons indicating positive and negative percentages. This image displays four icons representing changes in percentage, with two showing an upward green arrow for positive changes and two showing a downward red arrow for negative changes
Free with trial Businessman with downward graph indicating financial decline, recession, and negative growth. Ideal for economic analysis, loss reporting, and business downturn visuals. Arrow showing decrease vectors Business decline graph with downward arrow showing financial loss recession and negative growth concept. Businessman with downward graph indicating financial decline, recession, and negative growth. Ideal for economic analysis, loss reporting, and business downturn visuals
Free with trial A conceptual vector illustration depicting a severe economic downturn. The image features a grey bar chart with progressively shorter bars, symbolizing declining profits or performance. A bold red arrow points sharply downwards, representing a crash or significant loss, alongside a blue line graph also showing a negative trend. This graphic is ideal for illustrating concepts such as financial crisis, recession, stock market crash, business failure, bankruptcy, and negative growth. Perfect for financial reports, business presentations, news articles, and economic analysis infographics. Arrow showing decrease illustrations Economic Downturn and Financial Crisis Graph. A conceptual vector illustration depicting a severe economic downturn. The image features a grey bar chart with progressively shorter bars, symbolizing declining profits or performance. A bold red arrow points sharply downwards, representing a crash or significant loss, alongside a blue line graph also showing a negative trend. This graphic is ideal for illustrating concepts such as financial crisis, recession, stock market crash, business failure, bankruptcy, and negative growth. Perfect for financial reports, business presentations, news articles, and economic analysis infographics.
Free with trial This image depicts a bar graph on an easel showing a clear downward trend. The bars are blue, and a large red arrow points downward, indicating a decline. Arrow showing decrease illustrations Decline in data represented by a descending bar graph on an easel. This image depicts a bar graph on an easel showing a clear downward trend. The bars are blue, and a large red arrow points downward, indicating a decline
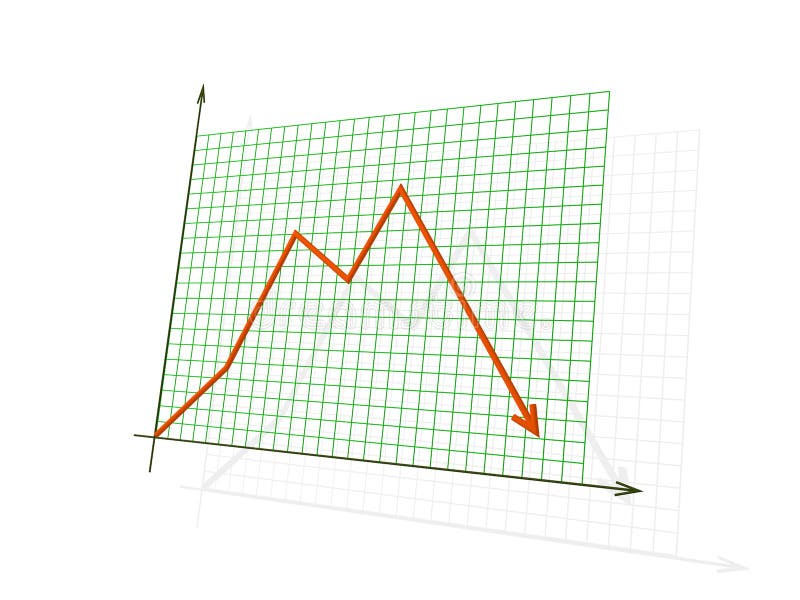
Free with trial Black line graph showing upward and downward trends with arrows on a white background. Arrow showing decrease illustrations Black line graph with upward and downward trends and arrows chart data. Black line graph showing upward and downward trends with arrows on a white background
Free with trial Two distinct bar charts are depicted against a white background. The left chart a downward trend with bars in blue, yellow, and purple, accompanied by a yellow coin with a dollar sign and an arrow pointing down towards it from a small graph indicating a rising trend. The right chart an upward trend with bars in red, green, and blue, and a green coin with a dollar sign connected to a circle with a. Arrow showing decrease illustrations Bar charts showing financial growth and decline with dollar symbols. Two distinct bar charts are depicted against a white background. The left chart a downward trend with bars in blue, yellow, and purple, accompanied by a yellow coin with a dollar sign and an arrow pointing down towards it from a small graph indicating a rising trend. The right chart an upward trend with bars in red, green, and blue, and a green coin with a dollar sign connected to a circle with a
Free with trial An illustration of a simple line graph showing a decline or decrease, accompanied by an exclamation mark inside a triangle, indicating a warning, danger or risk. Suitable for topics like financial loss, market crash, or economic downturn. Arrow showing decrease vectors Simple Line Decline Graph with Exclamation Mark Attention Icon Design. An illustration of a simple line graph showing a decline or decrease, accompanied by an exclamation mark inside a triangle, indicating a warning, danger or risk. Suitable for topics like financial loss, market crash, or economic downturn.
Free with trial Vector illustration showing oil price decrease with dollar sign drop barrel fuel pump and declining graph representing economic impact and market trends in black and white style calm. Generative AI. Arrow showing decrease vectors Oil price drop concept with dollar sign barrel pump and graph vector illustration. Vector illustration showing oil price decrease with dollar sign drop barrel fuel pump and declining graph representing economic impact and market trends in black and white style calm. Generative AI
Free with trial Description: showing 3d blue circle with white downward arrow icon on white background. Arrow showing decrease illustrations 3D Blue Circle with White Downward Arrow Icon on White Background
Free with trial This vector illustration features a set of two minimalist graphs depicting a significant decline. Each graph includes a downward-sloping line chart with an accompanying filled area, clearly indicating a negative trend. One version is presented in black on a white background, while the other is white on a black background, offering versatile usage. This icon is ideal for illustrating concepts of business loss, economic recession, market downturns, financial crisis, poor performance, or any data showing a decrease. Perfect for presentations, reports, infographics, and web design. Arrow showing decrease vectors Declining Business Graph Icon Set - Negative Trend Chart. This vector illustration features a set of two minimalist graphs depicting a significant decline. Each graph includes a downward-sloping line chart with an accompanying filled area, clearly indicating a negative trend. One version is presented in black on a white background, while the other is white on a black background, offering versatile usage. This icon is ideal for illustrating concepts of business loss, economic recession, market downturns, financial crisis, poor performance, or any data showing a decrease. Perfect for presentations, reports, infographics, and web design.
Free with trial Up and down sign with green and black arrows in flat style showing movement direction and sales change. Vector illustration of a sales bar chart icon used as an elevator symbol or universal pictogram. Arrow showing decrease vectors Up and down sign with green and black arrows in flat style showing movement direction