Free with trial Candlestick Chart vector Professional Financial Trading concept seamless pattern. Chart financial growth decrease vectors Candlestick Chart vector Professional Financial Trading seamless pattern
Free with trial Happy and sad businessman from rising and falling chart. Business success and failure infographic. Man sitting at computer table. Office manager. Startup project growth. Stock exchange. Vector concept. Chart financial growth decrease vectors Happy and sad businessman from rising and falling chart. Business success and failure infographic. Man sitting at computer table
Free with trial A detailed financial chart showing business data analysis and market trend with upward arrow sign. Chart financial growth decrease illustrations Financial chart business data analysis and market trend view isolated on transparent background. a detailed financial chart showing business data analysis and market trend with upward arrow sign
Free with trial A stock chart shows a red arrow trending upwards with a sharp decline represented by a red bar, juxtaposed with green bars, illustrating market fluctuations for financial analysis. Chart financial growth decrease illustrations Stock Chart with Red Arrow and Green Bars. A stock chart shows a red arrow trending upwards with a sharp decline represented by a red bar, juxtaposed with green bars, illustrating market fluctuations for financial analysis
Free with trial This minimalist vector illustration features two identical line graphs, presented in contrasting black and white themes. The left graph displays a black line on a white background, while the right shows a white line on a black background. Both graphs depict a clear downward trend with jagged fluctuations, symbolizing decline, loss, or negative growth over time. This versatile icon set is ideal for illustrating concepts such as economic downturns, financial losses, market crashes, business failures, or any data showing a significant decrease. Perfect for presentations, reports, infographics, and web design. Chart financial growth decrease vectors Declining Line Graph Icon Set - Black and White. This minimalist vector illustration features two identical line graphs, presented in contrasting black and white themes. The left graph displays a black line on a white background, while the right shows a white line on a black background. Both graphs depict a clear downward trend with jagged fluctuations, symbolizing decline, loss, or negative growth over time. This versatile icon set is ideal for illustrating concepts such as economic downturns, financial losses, market crashes, business failures, or any data showing a significant decrease. Perfect for presentations, reports, infographics, and web design.
Free with trial Stacks of gold coins, financial growth, investment generative ai image. Chart financial growth decrease illustrations Stacks of gold coins, financial growth, investment
Free with trial 3D colorful pie chart and bar graph on a stack of documents illustrating business data and financial analysis. Perfect for presentations or reports. Chart financial growth decrease illustrations Colorful 3D Pie Chart and Bar Graph on Documents. 3D colorful pie chart and bar graph on a stack of documents illustrating business data and financial analysis. Perfect for presentations or reports.
Free with trial Business growth presentation with charts and graphs showing progress, statistics, and performance. The image showcases key financial indicators in a clear, concise format. Chart financial growth decrease vectors Financial Data Analysis Report on Screen Display. Business growth presentation with charts and graphs showing progress, statistics, and performance. The image showcases key financial indicators in a clear, concise format.
Free with trial A downward trending graph overlays a stack of coins spilling from an overflowing wallet, symbolizing decreasing financial growth, economic downturn, and financial crisis. Represents investment loss, debt, budget concerns, and market recession. Ideal for illustrating financial instability and economic hardship, generated by AI. Chart financial growth decrease illustrations Decreasing financial growth stacked coins wallet. A downward trending graph overlays a stack of coins spilling from an overflowing wallet, symbolizing decreasing financial growth, economic downturn, and financial crisis. Represents investment loss, debt, budget concerns, and market recession. Ideal for illustrating financial instability and economic hardship, generated by AI.
Free with trial A 3D rendered image of a bar graph disintegrating into dust, symbolizing economic decline or market crash. This powerful visual metaphor, generated by AI, highlights the fragility of growth and the potential for sudden collapse. Chart financial growth decrease illustrations Collapsing Growth Chart. A 3D rendered image of a bar graph disintegrating into dust, symbolizing economic decline or market crash. This powerful visual metaphor, generated by AI, highlights the fragility of growth and the potential for sudden collapse.
Free with trial Cheerful cartoon businessman reviewing positive financial data upward trending graph. Chart financial growth decrease illustrations Happy Businessman Analyzing Financial Growth Charts. Cheerful cartoon businessman reviewing positive financial data upward trending graph.
Free with trial A 3D rendered icon featuring a golden bar graph with a downward trend line and a red arrow indicating a decrease. The graph is set on a black circular background with a prominent gold rim. This symbol represents financial decline, loss, or negative performance. Chart financial growth decrease illustrations Golden Graph with Downward Trend Arrow on Black Circle with Gold Rim chart falling. A 3D rendered icon featuring a golden bar graph with a downward trend line. A 3D rendered icon featuring a golden bar graph with a downward trend line and a red arrow indicating a decrease. The graph is set on a black circular background with a prominent gold rim. This symbol represents financial decline, loss, or negative performance
Free with trial Red metallic bars show a downward trend against a colorful bokeh background. Perfect for illustrating financial reports or presentations. Chart financial growth decrease illustrations Decreasing Bar Graph Chart Showing Financial Decline. Red metallic bars show a downward trend against a colorful bokeh background. Perfect for illustrating financial reports or presentations
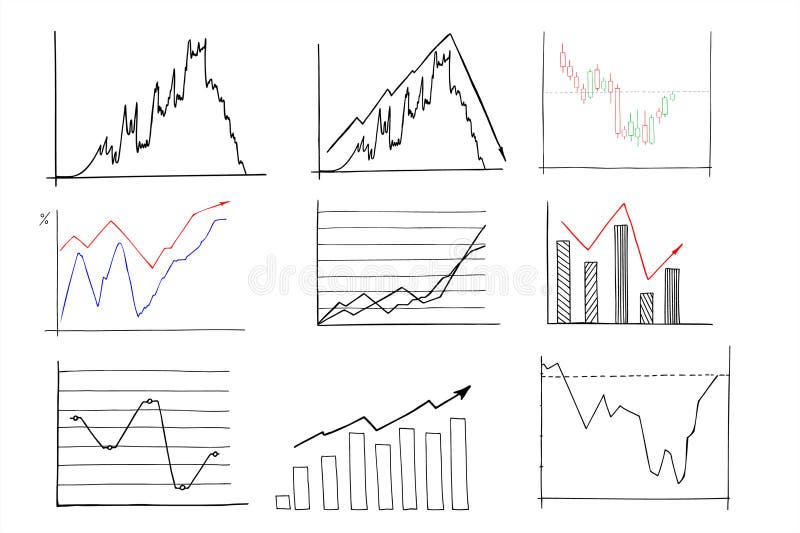
Free with trial A collection of eight black and white, hand-drawn or doodle style icons. Each square icon features a different line graph, representing data, analytics, statistics, or financial trends. Chart financial growth decrease illustrations Set of hand drawn financial chart line graph icons isolated on white. A collection of eight black and white, hand-drawn or doodle style icons. Each square icon features a different line graph, representing data, analytics, statistics, or financial trends
Free with trial A collection of eight black and white, hand-drawn or doodle style icons. Each square icon features a different line graph, representing data, analytics, statistics, or financial trends. Chart financial growth decrease illustrations Set of hand drawn financial chart line graph icons isolated on white. A collection of eight black and white, hand-drawn or doodle style icons. Each square icon features a different line graph, representing data, analytics, statistics, or financial trends
Free with trial This dynamic graphic depicts a sharp downward trend, visualized by a bold red arrow dramatically descending across a grey, jagged line graph. The graph itself shows significant fluctuations, but the overarching movement is a steep decline, symbolizing losses, negative growth, or a crisis. The clean white background isolates the data representation, making it ideal for conveying financial downturns, market crashes, or any situation involving a significant decrease. Chart financial growth decrease illustrations Sharp Decline: Red Arrow Graph Illustrating Downward Trend. This dynamic graphic depicts a sharp downward trend, visualized by a bold red arrow dramatically descending across a grey, jagged line graph. The graph itself shows significant fluctuations, but the overarching movement is a steep decline, symbolizing losses, negative growth, or a crisis. The clean white background isolates the data representation, making it ideal for conveying financial downturns, market crashes, or any situation involving a significant decrease.
Free with trial A 3D render of a bar chart displaying a significant downward trend. Blue bars of varying heights represent data points, intersected by a sharp orange line that clearly illustrates a decline over time. The dark, reflective surface below the chart suggests a digital display or a futuristic interface. This image is ideal for representing financial losses, market crashes, performance decline, or negative trends in various industries. Chart financial growth decrease illustrations Downtrending Bar Chart with Orange Line on Dark Background. A 3D render of a bar chart displaying a significant downward trend. Blue bars of varying heights represent data points, intersected by a sharp orange line that clearly illustrates a decline over time. The dark, reflective surface below the chart suggests a digital display or a futuristic interface. This image is ideal for representing financial losses, market crashes, performance decline, or negative trends in various industries.
Free with trial A downward trending graph chart isolated on a white background, perfect for financial analysis. Chart financial growth decrease illustrations Downward graph chart. A downward trending graph chart isolated on a white background, perfect for financial analysis
Free with trial Dynamic visualization of financial market data showcasing trends and statistics. Ideal for essays, reports, and presentations on economic analysis and investment strategies. Chart financial growth decrease illustrations Financial Market Analysis with Data Chart Display and Trends. Dynamic visualization of financial market data showcasing trends and statistics. Ideal for essays, reports, and presentations on economic analysis and investment strategies
Free with trial An abstract and futuristic digital visualization of financial data, featuring glowing blue bar charts and candlestick patterns reflecting on a sleek, dark surface. The dynamic composition, set against a deep blue background with subtle grid lines, evokes concepts of technology, business growth, and market analysis. Ideal for illustrating topics related to stock market trends, investment strategies, economic reports, big data analytics, and the future of finance in a modern, high-tech context. Chart financial growth decrease illustrations Futuristic Digital Finance Chart with Glowing Blue Data Bars. An abstract and futuristic digital visualization of financial data, featuring glowing blue bar charts and candlestick patterns reflecting on a sleek, dark surface. The dynamic composition, set against a deep blue background with subtle grid lines, evokes concepts of technology, business growth, and market analysis. Ideal for illustrating topics related to stock market trends, investment strategies, economic reports, big data analytics, and the future of finance in a modern, high-tech context.
Free with trial This dynamic 3D render visualizes financial growth and market trends. A series of green bars represents increasing values, overlaid by a prominent green arrow pointing upwards, symbolizing success and positive performance. Contrasting this, a red arrow also indicates a trend, though its path suggests volatility or a different metric. Below, a complex network graph with interconnected nodes and lines adds a layer of data analysis and interconnectedness, suitable for concepts like investment, analytics, and economic forecasting. Chart financial growth decrease illustrations Upward Trend: Green and Red Arrows Over Bar Chart and Network Graph. This dynamic 3D render visualizes financial growth and market trends. A series of green bars represents increasing values, overlaid by a prominent green arrow pointing upwards, symbolizing success and positive performance. Contrasting this, a red arrow also indicates a trend, though its path suggests volatility or a different metric. Below, a complex network graph with interconnected nodes and lines adds a layer of data analysis and interconnectedness, suitable for concepts like investment, analytics, and economic forecasting.
Free with trial A simple line style icon of a bar chart representing growth, data, or statistics. This graphic element is perfect for use in presentations, infographics, web design, and user interfaces. Chart financial growth decrease vectors Simple Line Style Bar Chart Graphic Outline Display Graph Icon. A simple line style icon of a bar chart representing growth, data, or statistics. This graphic element is perfect for use in presentations, infographics, web design, and user interfaces.
Free with trial A clean and modern set of financial icons, perfect for illustrating business concepts. The image features icons representing profit growth, expense management, tax documents, and investment summaries. The illustrations use a simple, flat design with a limited color palette, making them versatile for various applications. Ideal for presentations, websites, infographics, and financial reports. The set highlights key financial aspects in an easily understandable visual format. Chart financial growth decrease illustrations Financial Icons Set: Profit, Expenses, Tax, and Investment Analysis. A clean and modern set of financial icons, perfect for illustrating business concepts. The image features icons representing profit growth, expense management, tax documents, and investment summaries. The illustrations use a simple, flat design with a limited color palette, making them versatile for various applications. Ideal for presentations, websites, infographics, and financial reports. The set highlights key financial aspects in an easily understandable visual format.
Free with trial 3D percent icons with red and green arrows symbolizing price growth and fall. Modern vector concept for business, finance, sale, and economy illustration, up and down financial rate design. Chart financial growth decrease vectors 3D percent icons with red and green arrows symbolizing price growth and fall. Modern vector concept for business
Free with trial Financial concept image featuring a blue bar chart with a red downward arrow, illustrating decline, recession, or loss over time. Ideal for presentations, reports, infographics, economic forecasts, and business documentation. Clean, clear, and professional visual, created ai. Chart financial growth decrease illustrations Business bar chart showing financial decline with downward arrow. Financial concept image featuring a blue bar chart with a red downward arrow, illustrating decline, recession, or loss over time. Ideal for presentations, reports, infographics, economic forecasts, and business documentation. Clean, clear, and professional visual, created ai.
Free with trial Pie chart segments, sad face with declining graph, and a grid globe with bars suggest economic downturn. Ideal for finance, global crisis, analytics, investment, statistics, risk and simple flat. Chart financial growth decrease vectors Financial Decline Concept with Pie Chart, Downward Graph, and Global Representation. Pie chart segments, sad face with declining graph, and a grid globe with bars suggest economic downturn. Ideal for finance, global crisis, analytics, investment, statistics, risk and simple flat
Free with trial This image features a vibrant 3D representation of a bar chart, composed of translucent, glowing blocks in shades of pink, yellow, and cyan. The bars are arranged in varying heights, suggesting growth or data representation. The background is a dark green digital grid with subtle light effects and floating particles, creating a futuristic and technological atmosphere. This visual is ideal for concepts related to finance, data analysis, technology, growth, and digital trends. Chart financial growth decrease illustrations Abstract 3D Bar Chart with Neon Glow on Green Digital Background. This image features a vibrant 3D representation of a bar chart, composed of translucent, glowing blocks in shades of pink, yellow, and cyan. The bars are arranged in varying heights, suggesting growth or data representation. The background is a dark green digital grid with subtle light effects and floating particles, creating a futuristic and technological atmosphere. This visual is ideal for concepts related to finance, data analysis, technology, growth, and digital trends.
Free with trial Businessman pointing at cost reduction graph with glowing arrow showing decreasing expenses financial savings business efficiency investment growth and corporate budget strategy concept. Chart financial growth decrease illustrations Businessman pointing at cost reduction graph with glowing arrow showing decreasing expenses financial savings business efficiency
Free with trial This cheerful 3D rendered illustration depicts a friendly cartoon businessman confidently presenting positive business growth charts and data, showcasing key performance indicators and financial success. The image is ideal for business, finance, and marketing concepts. Chart financial growth decrease illustrations Charming 3D Cartoon Businessman Presenting Growth Charts and Data. This cheerful 3D rendered illustration depicts a friendly cartoon businessman confidently presenting positive business growth charts and data, showcasing key performance indicators and financial success. The image is ideal for business, finance, and marketing concepts.
Free with trial A hand holding a pen traces a red downward trending stock market chart, symbolizing a bear market or financial downturn. The background shows stock data. Chart financial growth decrease illustrations Bear Market Analysis: Hand with Pen Tracing a Declining Stock Chart. A hand holding a pen traces a red downward trending stock market chart, symbolizing a bear market or financial downturn. The background shows stock data
Free with trial A glowing green bar chart with a data line and grid on a black background, representing financial performance. Chart financial growth decrease illustrations Glowing Green Bar Chart with Data Line on photo Black graph finance. A glowing green bar chart with a data line and grid on a black background, representing financial performance
Free with trial 3D low price icons with red up and down arrows showing rate drop and market decline. Abstract financial vector about price decrease, percent change, and economic fall in modern business design. Chart financial growth decrease vectors 3D low price icons with red up and down arrows showing rate drop and market decline. Abstract financial vector about
Free with trial Bar chart with upward trend, sad face, and analytics dashboard highlights challenges in progress or data performance. Ideal for financial difficulty, business risk, loss assessment, data analysis. Chart financial growth decrease vectors Rising Bar Graph with Sad Face Symbolizing Negative Growth or Challenges in Analytics. Bar chart with upward trend, sad face, and analytics dashboard highlights challenges in progress or data performance. Ideal for financial difficulty, business risk, loss assessment, data analysis
Free with trial A minimalist graphic depicting a bar chart with falling bars and a downward-pointing arrow, symbolizing a negative trend, economic downturn, or performance decline. Clean and clear representation of loss. Chart financial growth decrease illustrations Simple downward trend bar chart icon indicating decline or decrease. A minimalist graphic depicting a bar chart with falling bars and a downward-pointing arrow, symbolizing a negative trend, economic downturn, or performance decline. Clean and clear representation of loss
Free with trial A collection of simple finance graphic element icons, depicting trends, charts, and money. These icons can be used to visualize various financial concepts, such as growth, decline, and investment. Chart financial growth decrease vectors Simple Style Finance Graphic Element Icons with Trend, Chart and Money. A collection of simple finance graphic element icons, depicting trends, charts, and money. These icons can be used to visualize various financial concepts, such as growth, decline, and investment.
Free with trial This image captures a sprawling urban cityscape at dusk, featuring numerous illuminated skyscrapers. A prominent red arrow graphic overlays the scene, indicating a sharp downward trend or decline. The setting sun casts a warm glow on the sky, contrasting with the cool tones of the city lights and buildings. This visual metaphor is ideal for representing financial market crashes, economic recession, business failure, or any concept of negative growth in a metropolitan context. Chart financial growth decrease illustrations Cityscape Downturn: Financial Decline Overlay on Urban Skyline at Dusk. This image captures a sprawling urban cityscape at dusk, featuring numerous illuminated skyscrapers. A prominent red arrow graphic overlays the scene, indicating a sharp downward trend or decline. The setting sun casts a warm glow on the sky, contrasting with the cool tones of the city lights and buildings. This visual metaphor is ideal for representing financial market crashes, economic recession, business failure, or any concept of negative growth in a metropolitan context.
Free with trial This image shows a calculator next to colorful 3D bar charts and pie charts illustrating business growth and financial success. The vibrant colors and upward-trending graph create a visually appealing representation of positive financial results. Chart financial growth decrease illustrations Colorful Calculator and 3D Charts Showing Business Growth. This image shows a calculator next to colorful 3D bar charts and pie charts illustrating business growth and financial success. The vibrant colors and upward-trending graph create a visually appealing representation of positive financial results.
Free with trial Dollar coin next to declining bar graph and directional arrow illustrating financial downturn. Ideal for finance, economics, investment, stock market, loss, budget analysis, simple flat metaphor. Chart financial growth decrease illustrations Dollar Sign Coin and Declining Bar Chart with Arrow Indicating Financial Downward Trend. Dollar coin next to declining bar graph and directional arrow illustrating financial downturn. Ideal for finance, economics, investment, stock market, loss, budget analysis, simple flat metaphor
Free with trial Interest growth icon Black line art vector in black and white outline set collection sign. Chart financial growth decrease vectors Financial Icon Illustrating Growth, Investment Success, and Economic Prosperity. Interest growth icon Black line art vector in black and white outline set collection sign
Free with trial Detailed 3D rendering of colorful bar charts, pie charts, line graphs, and calculator showcasing financial data analysis and business growth. Chart financial growth decrease illustrations Colorful 3D Business Charts, Graphs, and Calculator for Financial Success. Detailed 3D rendering of colorful bar charts, pie charts, line graphs, and calculator showcasing financial data analysis and business growth.
Free with trial A 3D bar chart with a red line graph indicating a significant decline, isolated on a white background. Chart financial growth decrease illustrations Financial bar chart showing downward trend isolated on white background. A 3D bar chart with a red line graph indicating a significant decline, isolated on a white background
Free with trial A close-up view of a financial bar and line graph with a pen resting on it, indicating analysis and financial data. Chart financial growth decrease illustrations Close-up of a financial graph with bars and line chart and a pen business data. A close-up view of a financial bar and line graph with a pen resting on it, indicating analysis and financial data
Free with trial Modern rendered line graph with yellow marker points rising and falling vertically, forming a white trend line that fluctuates across the screen. The graph represents business data such as growth, decrease, profit, and market performance. Set against a blurred office background, the image has a clean, digital aesthetic ideal for financial presentations, company reports, startup pitches, and data analysis. This visual is suitable for showcasing trading performance, corporate strategy, and economic trends. Chart financial growth decrease illustrations Business Trend Line Graph Showing Growth and Market Fluctuations. Modern rendered line graph with yellow marker points rising and falling vertically, forming a white trend line that fluctuates across the screen. The graph represents business data such as growth, decrease, profit, and market performance. Set against a blurred office background, the image has a clean, digital aesthetic ideal for financial presentations, company reports, startup pitches, and data analysis. This visual is suitable for showcasing trading performance, corporate strategy, and economic trends.
Free with trial Financial downturn concept. A business professional climbs tall blue bars, carrying a briefcase and analyze declining bar graph and chart using magnifying glass. Chart financial growth decrease vectors Financial downturn concept, businessman analyze declining bar graph and chart. Financial downturn concept. A business professional climbs tall blue bars, carrying a briefcase and analyze declining bar graph and chart using magnifying glass
Free with trial Colorful isometric bar chart showing business data and growth with bars of different height, colored blue, yellow and green. Isolated on a transparent background, perfect for business presentations or infographics. Chart financial growth decrease vectors Colorful business chart illustration on transparent background AI Generated. Colorful isometric bar chart showing business data and growth with bars of different height, colored blue, yellow and green. Isolated on a transparent background, perfect for business presentations or infographics.
Free with trial Stock market chart displaying investment trends with red and blue candlesticks on a dark background. The chart features a timeline labeled by months at the top and numbers at the bottom, illustrating dynamic financial data. Candlesticks show market fluctuations, with red indicating a decrease and blue an increase in value. A faint blue line overlays the candles, representing the moving average. The scene is likely within a financial or trading setting, emphasizing the analysis of market activity. Chart financial growth decrease illustrations Dynamic stock market chart with vibrant red and blue candles showing investment trends and financial data. Stock market chart displaying investment trends with red and blue candlesticks on a dark background. The chart features a timeline labeled by months at the top and numbers at the bottom, illustrating dynamic financial data. Candlesticks show market fluctuations, with red indicating a decrease and blue an increase in value. A faint blue line overlays the candles, representing the moving average. The scene is likely within a financial or trading setting, emphasizing the analysis of market activity.
Free with trial Candlestick chart with buy and sell signals over digital world map and city skyline on dark background, symbolizing global market and forex trading. Chart financial growth decrease illustrations Global financial chart with buy and sell indicators over world map and cityscape background, illustrating stock market and forex. Candlestick chart with buy and sell signals over digital world map and city skyline on dark background, symbolizing global market and forex trading
Free with trial This 3D render shows a calculator with a colorful bar chart made of cubes illustrating growth and success in business and finance. Perfect for presentations and infographics. Chart financial growth decrease illustrations Colorful 3D Calculator with Growing Bar Chart Cubes for Business and Finance. This 3D render shows a calculator with a colorful bar chart made of cubes illustrating growth and success in business and finance. Perfect for presentations and infographics.
Free with trial Circular buttons labeled "BUY" and "SELL" sit on a surface with a glowing stock market chart in the background. The chart features fluctuating orange lines on a dark grid, illustrating price movements and market volatility. The buttons are shiny and metallic, with embossed text, suggesting a dynamic financial environment. The composition emphasizes themes of trading and investment in the stock market. Chart financial growth decrease illustrations Buy and sell buttons with stock market chart in background, financial concept. Circular buttons labeled "BUY" and "SELL" sit on a surface with a glowing stock market chart in the background. The chart features fluctuating orange lines on a dark grid, illustrating price movements and market volatility. The buttons are shiny and metallic, with embossed text, suggesting a dynamic financial environment. The composition emphasizes themes of trading and investment in the stock market.
Free with trial This illustration depicts a piggy bank beside a bar chart showing a sharp decline symbolizing decreasing savings and potential economic hardship The design uses simple clean graphics to effectively communicate a message of financial downturn Ideal for articles about recession financial planning or investment risks. Chart financial growth decrease illustrations Declining Savings Piggy Bank and Bar Chart Showing Economic Downturn AI generated. This illustration depicts a piggy bank beside a bar chart showing a sharp decline symbolizing decreasing savings and potential economic hardship The design uses simple clean graphics to effectively communicate a message of financial downturn Ideal for articles about recession financial planning or investment risks
Free with trial A minimalist 3D bar chart rendered in white against a bright white background. The chart displays four bars of decreasing height, visually representing a sharp downward trend. A prominent white arrow, also pointing downwards, overlays the bars, emphasizing the decline. The composition is clean and abstract, suitable for representing financial or economic downturns. Chart financial growth decrease illustrations White 3D Bar Chart Showing a Sharp Downward Trend with Arrow on White Background graph. A minimalist 3D bar chart rendered in white against a bright white background. The chart displays four bars of decreasing height, visually representing a sharp downward trend. A prominent white arrow, also pointing downwards, overlays the bars, emphasizing the decline. The composition is clean and abstract, suitable for representing financial or economic downturns
Free with trial A collection of financial icons in vector format. The transparent background is valuable for designers. Chart financial growth decrease vectors Financial Increase and Decrease Icons Vector Illustration on transparent background. A collection of financial icons in vector format. The transparent background is valuable for designers
Free with trial A minimalist 3D white bar chart displays a clear downward trend. Four bars of decreasing height are shown, with a sharp white arrow pointing downwards from the top of the second bar, indicating a significant decline. The chart is presented in isolation against a clean white background, emphasizing the concept of financial or economic downturn. Chart financial growth decrease illustrations 3D White Bar Chart with a Downward Trending Arrow Symbolizing Decline graph decrease. A minimalist 3D white bar chart displays a clear downward trend. Four bars of decreasing height are shown, with a sharp white arrow pointing downwards from the top of the second bar, indicating a significant decline. The chart is presented in isolation against a clean white background, emphasizing the concept of financial or economic downturn
Free with trial A 3D pie chart with three colored segments (pink, blue, and teal) is shown against a solid purple background. A yellow circle with a white upward arrow is positioned to the left of the chart, and a pink circle with a white downward arrow is to the right. Chart financial growth decrease illustrations 3D Pie Chart With Up and Down Arrows Indicating Growth and Decline on a Purple Background. A 3D pie chart with three colored segments (pink, blue, and teal) is shown against a solid purple background. A yellow circle with a white upward arrow is positioned to the left of the chart, and a pink circle with a white downward arrow is to the right
Free with trial A financial candlestick chart illustrates a positive market trend, with green and red candles indicating price movements and a smooth green line representing a moving average. Chart financial growth decrease illustrations Financial stock market candlestick chart showing upward trend with moving average line. A financial candlestick chart illustrates a positive market trend, with green and red candles indicating price movements and a smooth green line representing a moving average
Free with trial This vibrant image showcases a collection of colorful 3D charts and graphs, including bar graphs, pie charts, and a line graph, all illustrating positive growth. A calculator and pencil are included, emphasizing the analytical and planning aspects of business success. Perfect for illustrating finan. Chart financial growth decrease illustrations Colorful 3D Financial Charts and Graphs with Calculator for Business Growth Presentation. This vibrant image showcases a collection of colorful 3D charts and graphs, including bar graphs, pie charts, and a line graph, all illustrating positive growth. A calculator and pencil are included, emphasizing the analytical and planning aspects of business success. Perfect for illustrating finan
Free with trial Wooden blocks display sad and happy faces topped with increasing stacks of coins illustrating financial growth and investment success representing a visual metaphor for economic progress and the jour. Chart financial growth decrease illustrations Wooden blocks with sad and happy faces showing financial growth with stacked coins. Wooden blocks display sad and happy faces topped with increasing stacks of coins illustrating financial growth and investment success representing a visual metaphor for economic progress and the jour
Free with trial Futuristic financial data visualization with graphs and charts showing growth and market trends. Chart financial growth decrease illustrations Futuristic financial data visualization with graphs and charts showing growth and market trends
Free with trial A 3D bar chart illustrating a declining trend, perfect for business, finance, and data visualization presentations. Chart financial growth decrease illustrations Colorful 3D bar graph showing a downward trend in business growth and financial data analysis. A 3D bar chart illustrating a declining trend, perfect for business, finance, and data visualization presentations
Free with trial Three-dimensional rectangular bars stand side-by-side on a white background. The bars are of different heights, with the shortest on the left, a medium-height bar in the middle, and the tallest bar on the right. The bars are colored blue, pink, and orange, respectively. This arrangement visually represents a bar chart or graph, suggesting concepts of growth, data comparison, or progress. Chart financial growth decrease illustrations Three 3D Rendered Rectangular Bars of Varying Heights and Colors on a White Background bar chart. Three-dimensional rectangular bars stand side-by-side on a white background. The bars are of different heights, with the shortest on the left, a medium-height bar in the middle, and the tallest bar on the right. The bars are colored blue, pink, and orange, respectively. This arrangement visually represents a bar chart or graph, suggesting concepts of growth, data comparison, or progress
Free with trial Stock market trading technical analysis bar chart fall. Business candlestick graph exchange down trend. Crisis economy and investment loss graph. Trader financial index crash concept. Money losing eps. Chart financial growth decrease vectors Stock market trading technical analysis bar chart fall. Business candlestick graph exchange down trend. Crisis economy
Free with trial Concept of growing percentage up. Arrow up and rising graph as concept of interest rate growth, price increase, trader profit, financial success and business goal. Infographic design element. Chart financial growth decrease vectors Concept of growing percentage up. Arrow up and rising graph as concept of interest rate growth, price increase, trader profit
Free with trial Business Analytics And Data Visualization Line Icon Set. Financial Growth, Market Trends, And Performance Analysis Outline Symbol Collection. Editable Stroke. Isolated Vector Illustration. Chart financial growth decrease vectors Business Analytics And Data Visualization Line Icon Set. Financial Growth, Market Trends, And Performance Analysis
Free with trial Reduction chart icon Black line art vector in black and white outline set collection sign. Chart financial growth decrease vectors Decline Chart Icon Illustrating Decrease in Performance, Economic Downturn, and Analytical Data. Reduction chart icon Black line art vector in black and white outline set collection sign
Free with trial A visual representation of india's economic downturn, showing a declining graph and financial crisis. it highlights the business decline and recession impacting the nation's economy and market trends. Chart financial growth decrease illustrations Understanding india economic recession and financial crisis with falling graph and business decline chart. a visual representation of india's economic downturn, showing a declining graph and financial crisis. it highlights the business decline and recession impacting the nation's economy and market trends.
Free with trial Profit growing and decrease sumbol. Statistic up and down arrows. Business growths chart. Green and red arrow - stock vector. Chart financial growth decrease illustrations Profit growing and decrease sumbol. Statistic up and down arrows. Business growths chart. Green and red arrow - stock vector
Free with trial This image features six black bar chart icons with red and green arrows showing increase, decrease, and uncertainty trends. It is a clear, simple vector for business or data visuals, informative and clean. Generative AI. Chart financial growth decrease vectors Set of six vector bar chart icons with arrows indicating trends and question mark in black and colored design elements. This image features six black bar chart icons with red and green arrows showing increase, decrease, and uncertainty trends. It is a clear, simple vector for business or data visuals, informative and clean. Generative AI
Free with trial The graphic illustrates stable bank withdrawals alongside a growing financial trend with upward movement, Bank withdrawals are currently stable and not showing any significant increase or decrease. Chart financial growth decrease vectors The graphic illustrates stable bank withdrawals alongside a growing financial trend with upward movement, Bank withdrawals are
Free with trial An upward trending stock market graph shows business finance investment growth and success. The red arrow indicates positive data analysis and economic trending up. A strong future ahead!. Chart financial growth decrease illustrations Stock market growth chart business finance investment graph arrow up trending data analysis success economy. An upward trending stock market graph shows business finance investment growth and success. The red arrow indicates positive data analysis and economic trending up. A strong future ahead!
Free with trial A compilation of minimalist line art icons visually representing various financial concepts, including upward and downward market trends, investment growth, and economic indicators. Chart financial growth decrease vectors Collection of line art icons representing financial growth and market trends, isolated on transparent background. A compilation of minimalist line art icons visually representing various financial concepts, including upward and downward market trends, investment growth, and economic indicators
Free with trial Businessman runs and holds coins on a red arrow graph decrease on a stack of coins to coin slot. Business Down, wealth create, financial, investment goal, corporate develop, economic, profit and loss. Chart financial growth decrease vectors Businessman runs and holds coins on a red arrow graph decrease on a stack of coins to coin slot. Business Down, wealth create
Free with trial Witness the dynamic energy of the modern financial world in this captivating image. A digital display showcases a thriving stock market, complete with upward trends in financial charts and a stack of coins symbolizing wealth accumulation. The computer screen, the central focus, displays a complex array of financial graphs, highlighting market fluctuations and growth indicators. This visual. Chart financial growth decrease illustrations Stock Market Growth A Thriving Investment Landscape Visualized on a Computer Screen with Stacked Coins Charts and. Witness the dynamic energy of the modern financial world in this captivating image. A digital display showcases a thriving stock market, complete with upward trends in financial charts and a stack of coins symbolizing wealth accumulation. The computer screen, the central focus, displays a complex array of financial graphs, highlighting market fluctuations and growth indicators. This visual
Free with trial Set Digital speed meter Location Delivery tracking Graph chart diagram Hierarchy organogram Infographic element and Financial growth decrease icon. Vector. Chart financial growth decrease illustrations Set Digital speed meter, Location, Delivery tracking, Graph, chart, diagram, Hierarchy organogram, Infographic element. Set Digital speed meter Location Delivery tracking Graph chart diagram Hierarchy organogram Infographic element and Financial growth decrease icon. Vector.
Free with trial Two hands cradle glowing symbols. On the left, a percentage sign emanates warmth and light, while the right hand holds an upward-trending graph, symbolizing growth. Tiny, shimmering particles float between them, suggesting the exchange of financial concepts. Created ai. Chart financial growth decrease illustrations Boost your business success with strategic financial growth and rising interest rates now with this dynamic composition. Two hands cradle glowing symbols. On the left, a percentage sign emanates warmth and light, while the right hand holds an upward-trending graph, symbolizing growth. Tiny, shimmering particles float between them, suggesting the exchange of financial concepts. Created ai
Free with trial Set line Website with stocks market Search engine Browser setting Financial growth increase window Photo retouching and mail and icon. Vector. Chart financial growth decrease vectors Set line Website with stocks market, Search engine, Browser setting, Financial growth increase, window, Photo retouching. Set line Website with stocks market Search engine Browser setting Financial growth increase window Photo retouching and mail and icon. Vector.
Free with trial Vibrant red line indicates financial market decline on digital display. Chart shows stock market loss, economy decay, investment risk. Red graph pattern represents trading volatility. Chart financial growth decrease illustrations Vibrant red line indicates financial market decline on digital display. Chart shows stock market loss, economy decay, investment
Free with trial Close-up graphic of financial market graph with dynamic lines. Represents investment volatility, uncertainty, stock price fluctuations. Concept of business success, growth failure in. Chart financial growth decrease illustrations Close-up graphic of financial market graph with dynamic lines. Represents investment volatility, uncertainty, stock price
Free with trial A businessman holds a coin, runs to stack of money bar chart with green graph up. Extend investment in Bull Economy, economic success, financial management, capital market performance, and profit. Chart financial growth decrease vectors A businessman holds a coin, runs to stack of money bar chart with green graph up. Extend investment in Bull Economy, economic
Free with trial Chart line set. Graph, finance report, income growth, economy statistic, diagram, infographic, mind map, data visualization vector illustration. Outline signs of analytic. Editable Stroke. Chart financial growth decrease vectors Analytical graphic chart with trend lines, columns set hand drawn ink sketch. Change in time of election results or income, plans. Chart line set. Graph, finance report, income growth, economy statistic, diagram, infographic, mind map, data visualization vector illustration. Outline signs of analytic. Editable Stroke
Free with trial Piles of gold coins stacked, growing, illustrating finance economy, investment, saving concept. Business success, growth, wealth inflation rising. Economic prosperity, financial. Chart financial growth decrease illustrations Piles of gold coins stacked, growing, illustrating finance, economy, investment, saving concept. Business success, growth, wealth. Piles of gold coins stacked, growing, illustrating finance economy, investment, saving concept. Business success, growth, wealth inflation rising. Economic prosperity, financial.