Free with trial Stylized digital illustration showing a virtual coin with a declining market chart in the background. this image symbolizes financial risks, price fluctuations, and market volatility in the electronic currency sector. Chart financial growth decrease vectors Digital illustration of a virtual currency coin with a falling market graph representing financial price volatility. stylized digital illustration showing a virtual coin with a declining market chart in the background. this image symbolizes financial risks, price fluctuations, and market volatility in the electronic currency sector
Free with trial A 3D bar chart displays a downward trend, with bars decreasing in height from left to right. A red arrow follows the trend, pointing downwards. The chart is placed on a reflective glass table, casting a clear reflection. Sunlight casts diagonal shadows on a plain white wall in the background. The overall composition suggests a financial or business decline. Chart financial growth decrease illustrations Downward Trend Bar Chart with Red Arrow on Glass Table graph data. A 3D bar chart displays a downward trend, with bars decreasing in height from left to right. A red arrow follows the trend, pointing downwards. The chart is placed on a reflective glass table, casting a clear reflection. Sunlight casts diagonal shadows on a plain white wall in the background. The overall composition suggests a financial or business decline
Free with trial A collection of simple, business and growth icons, perfect for financial reports, websites, or presentations on market trends and data. The set features a clean, minimal, thin line style. Chart financial growth decrease vectors Simple business and growth icons set, thin line style, minimal vector illustration perfect for financial reports, websites, or pre. A collection of simple, business and growth icons, perfect for financial reports, websites, or presentations on market trends and data. The set features a clean, minimal, thin line style.
Free with trial Ai-Generated. a collection of twentyone minimalistic graph chart icons these icons illustrate different types of data trends suitable for representing business information, statistical analysis, and financial reports each icon features a unique line graph, bar chart, or diagram style. Chart financial growth decrease vectors Collection of minimalistic graph chart icons presenting different types of business data trends. Ai-Generated. a collection of twentyone minimalistic graph chart icons these icons illustrate different types of data trends suitable for representing business information, statistical analysis, and financial reports each icon features a unique line graph, bar chart, or diagram style
Free with trial Line Graph Trend Analysis Line And Solid Icon Set. Data Visualization, Business Growth, Statistical Analysis Symbol Collection. Financial And Market Insights. Isolated Vector Illustration. Chart financial growth decrease vectors Line Graph Trend Analysis Line And Solid Icon Set. Data Visualization, Business Growth, Statistical Analysis Symbol
Free with trial Stacks of coins diminish, mirroring a falling stock market chart against a world map backdrop, symbolizing global economic decline and financial loss. Chart financial growth decrease illustrations Global Economic Downturn: Coin Stacks Decline with Bearish Stock Chart. Stacks of coins diminish, mirroring a falling stock market chart against a world map backdrop, symbolizing global economic decline and financial loss
Free with trial A flat design illustration featuring a golden euro coin prominently displayed against a white background. Two gray arrows flank the coin: one pointing upwards, symbolizing growth or increase, and another pointing downwards, representing decline or decrease. This graphic effectively visualizes concepts related to currency fluctuations, financial markets, and economic trends of the Euro. Chart financial growth decrease vectors Euro Coin with Up and Down Arrows. A flat design illustration featuring a golden euro coin prominently displayed against a white background. Two gray arrows flank the coin: one pointing upwards, symbolizing growth or increase, and another pointing downwards, representing decline or decrease. This graphic effectively visualizes concepts related to currency fluctuations, financial markets, and economic trends of the Euro.
Free with trial Set of 16 black and white graph icons in a 4x4 grid. Each icon depicts variations of bar charts with upward and downward arrows, suggesting growth or decline. Some include additional elements like magnifying glasses, checkmarks, and data points connected by lines. Icons vary slightly in design, representing different data trends with simple, bold lines on a white background, ideal for business and statistical representation. Chart financial growth decrease vectors Graph icon set. Increase and decrease graph icon. Growth icon. Graph chart icons. Icon set. 16 icons. Set of 16 black and white graph icons in a 4x4 grid. Each icon depicts variations of bar charts with upward and downward arrows, suggesting growth or decline. Some include additional elements like magnifying glasses, checkmarks, and data points connected by lines. Icons vary slightly in design, representing different data trends with simple, bold lines on a white background, ideal for business and statistical representation.
Free with trial Illustration depicting india's economy facing a downturn, with a graph showing a downward trend. This image represents a financial crisis, stock market crash, or economic recession in india. 200. Chart financial growth decrease illustrations India economy crisis financial market stock market crash recession economic downturn graph chart down 100. illustration depicting india's economy facing a downturn, with a graph showing a downward trend. This image represents a financial crisis, stock market crash, or economic recession in india. 200
Free with trial A vibrant red arrow curves and points downwards against a clean white background. This 3D rendered illustration conveys the concept of decline, decrease, or downward trend. Its clean design makes it suitable for a variety of applications, including business presentations, financial reports, and data visualizations. The image is versatile and can be used to represent negative growth, falling prices, or other downward movements. Chart financial growth decrease illustrations Red Arrow Pointing Down - Decline Concept. A vibrant red arrow curves and points downwards against a clean white background. This 3D rendered illustration conveys the concept of decline, decrease, or downward trend. Its clean design makes it suitable for a variety of applications, including business presentations, financial reports, and data visualizations. The image is versatile and can be used to represent negative growth, falling prices, or other downward movements.
Free with trial This minimalist graphic illustration features a bold red line chart indicating a significant decline. The visual composition uses clean lines and a flat design aesthetic to represent negative growth or financial loss. The stark contrast between the vibrant red color and the neutral background emphasizes the downward trajectory of the data points. Chart financial growth decrease vectors A red line graph showing a downward trend on a plain white background. This minimalist graphic illustration features a bold red line chart indicating a significant decline. The visual composition uses clean lines and a flat design aesthetic to represent negative growth or financial loss. The stark contrast between the vibrant red color and the neutral background emphasizes the downward trajectory of the data points
Free with trial Hand holding holographic financial graph. Chart financial growth decrease illustrations Hand Holding Evolving Green Financial Data Graph and Cityscape - Investment Growth Concept. Hand holding holographic financial graph
Free with trial Conceptual illustration representing cryptocurrency market trends with a bar graph showing financial growth alongside shadows of investment risk and volatility. Chart financial growth decrease vectors Stylized illustration showing cryptocurrency growth with bar graphs and shadows representing investment risks and market trends. conceptual illustration representing cryptocurrency market trends with a bar graph showing financial growth alongside shadows of investment risk and volatility
Free with trial A visual representation of the indian economy facing a crisis, showing a downward trend on a graph against the backdrop of india's map, symbolizing financial recession and market decline. Chart financial growth decrease illustrations India economy crisis financial recession india map chart graph business market investment stock market down trend. a visual representation of the indian economy facing a crisis, showing a downward trend on a graph against the backdrop of india's map, symbolizing financial recession and market decline.
Free with trial A downward trending graph chart isolated on a white background, perfect for financial analysis. Chart financial growth decrease illustrations Downward graph chart. A downward trending graph chart isolated on a white background, perfect for financial analysis
Free with trial This image presents a clean, minimalist graphic illustrating economic trends. It features two distinct charts: a line graph on the left showing fluctuating data points over time, and a bar chart on the right comparing values across categories. The charts use a simple black and white color scheme with grayscale elements, making them versatile for various business and financial contexts. Labels like 'ECONOMIC', 'PARCTIRUM', and 'PLACTIRUM' suggest analysis of economic performance and market data. The overall design emphasizes clarity and data visualization. Chart financial growth decrease vectors Economic Growth Trends: Line and Bar Charts. This image presents a clean, minimalist graphic illustrating economic trends. It features two distinct charts: a line graph on the left showing fluctuating data points over time, and a bar chart on the right comparing values across categories. The charts use a simple black and white color scheme with grayscale elements, making them versatile for various business and financial contexts. Labels like 'ECONOMIC', 'PARCTIRUM', and 'PLACTIRUM' suggest analysis of economic performance and market data. The overall design emphasizes clarity and data visualization.
Free with trial The a 3D rendering of a blue arrow rising diagonally from the lower left to the upper right, positioned above a series of white cubes arranged in ascending order. The cubes decrease in size as they move toward the arrow's base, creating a sense of progression and growth. The background is a solid light blue color, providing contrast to the white cubes and the blue arrow. The overall style is clean. Chart financial growth decrease illustrations 3 d blue arrow rising over white ascending cubes, growth chart concept. The a 3D rendering of a blue arrow rising diagonally from the lower left to the upper right, positioned above a series of white cubes arranged in ascending order. The cubes decrease in size as they move toward the arrow's base, creating a sense of progression and growth. The background is a solid light blue color, providing contrast to the white cubes and the blue arrow. The overall style is clean
Free with trial Various colored cylinder objects of different heights arranged against striped background resembling falling chart Ideal for presenting business data or financial analysis. Chart financial growth decrease illustrations Analyzing Colorful Cylinders Arranged Like a Falling Bar Chart on Blue Background. Various colored cylinder objects of different heights arranged against striped background resembling falling chart Ideal for presenting business data or financial analysis
Free with trial A hand-drawn illustration featuring a large percentage symbol at the center, surrounded by various financial and business-related doodles. Icons include bar charts, pie charts, stacks of coins, a calculator, dollar signs, and numerous arrows indicating direction, flow, or change. The style is simple, black and white line art, suitable for representing concepts like finance, economics, growth, discounts, and business analysis. Chart financial growth decrease illustrations Doodle Financial Icons and Percentage Symbol. A hand-drawn illustration featuring a large percentage symbol at the center, surrounded by various financial and business-related doodles. Icons include bar charts, pie charts, stacks of coins, a calculator, dollar signs, and numerous arrows indicating direction, flow, or change. The style is simple, black and white line art, suitable for representing concepts like finance, economics, growth, discounts, and business analysis.
Free with trial Detailed stock chart displays fluctuating trends represented in pink and teal lines showcasing market volatility, and is suitable for financial analysis. Chart financial growth decrease illustrations Analyzing Stock Market Chart with Fluctuating Trends in Pink and Teal. Detailed stock chart displays fluctuating trends represented in pink and teal lines showcasing market volatility, and is suitable for financial analysis
Free with trial A minimalist black icon depicting a business data chart. It features a bar graph with multiple vertical bars, overlaid by two distinct line graphs. One line graph shows an upward trend with data points, symbolizing growth and success, while the other illustrates a downward trend, representing decline or loss. This versatile vector illustration is ideal for conveying concepts related to financial analysis, market trends, business performance, statistics, and economic fluctuations. Perfect for web interfaces, presentations, reports, and infographics. Chart financial growth decrease vectors Business Data Analysis Chart Icon with Trends. A minimalist black icon depicting a business data chart. It features a bar graph with multiple vertical bars, overlaid by two distinct line graphs. One line graph shows an upward trend with data points, symbolizing growth and success, while the other illustrates a downward trend, representing decline or loss. This versatile vector illustration is ideal for conveying concepts related to financial analysis, market trends, business performance, statistics, and economic fluctuations. Perfect for web interfaces, presentations, reports, and infographics.
Free with trial A simple flat icon vector illustration of two hands adjusting a simple chart with a downturn arrow, symbolizing risk mitigation in a business setting. The simple chart with a downturn arrow is orange with dark gray elements, indicating loss control. White background. Minimalist style with sharp edges and no shadows. Orange and Gray color palette. Vector graphics with rounded corners. High. Chart financial growth decrease illustrations Hands Protect Financial Growth Chart Decline, Business Crisis Management. A simple flat icon vector illustration of two hands adjusting a simple chart with a downturn arrow, symbolizing risk mitigation in a business setting. The simple chart with a downturn arrow is orange with dark gray elements, indicating loss control. White background. Minimalist style with sharp edges and no shadows. Orange and Gray color palette. Vector graphics with rounded corners. High
Free with trial This vibrant image features a white cube with a prominent black percentage symbol, seemingly floating above a row of five identical white cubes, each displaying a clear black downward arrow. Set against a bright yellow background, the composition powerfully symbolizes a concept of reduction, decline, or decrease. It's ideal for illustrating topics such as falling interest rates, economic downturns, sales reductions, discounts, negative trends, or any financial or business concept involving a downward movement in percentages. The clean, minimalist design offers versatility for various editorial and commercial uses. Chart financial growth decrease illustrations Percentage Decrease Concept with Downward Arrows. This vibrant image features a white cube with a prominent black percentage symbol, seemingly floating above a row of five identical white cubes, each displaying a clear black downward arrow. Set against a bright yellow background, the composition powerfully symbolizes a concept of reduction, decline, or decrease. It's ideal for illustrating topics such as falling interest rates, economic downturns, sales reductions, discounts, negative trends, or any financial or business concept involving a downward movement in percentages. The clean, minimalist design offers versatility for various editorial and commercial uses.
Free with trial A 3D isometric bar chart with a gradient color scheme from blue to red and orange, depicting a downward trend. The bars are arranged in descending order of height, set against a clean white background. This visual represents data analysis, financial decline, or a negative trend. Chart financial growth decrease illustrations Isometric Gradient Bar Chart Showing Decline on White Background graph data. A 3D isometric bar chart with a gradient color scheme from blue to red and orange, depicting a downward trend. The bars are arranged in descending order of height, set against a clean white background. This visual represents data analysis, financial decline, or a negative trend
Free with trial A collection of colorful 3D financial graphics on a white background. This includes a rising candlestick chart with red and green bars, a segmented pie chart with four colors, and a circular segmented chart with five colors. Chart financial growth decrease illustrations Colorful 3D Financial Charts and Graphs on White Background finance business. A collection of colorful 3D financial graphics on a white background. This includes a rising candlestick chart with red and green bars, a segmented pie chart with four colors, and a circular segmented chart with five colors
Free with trial Abstract 3D render of a colorful descending bar chart with cubes. Perfect for data visualization, business presentations, or illustrating trends. Representing financial, statistical or marketing information. Chart financial growth decrease illustrations Colorful 3D Bar Chart, Data Visualization Concept. Abstract 3D render of a colorful descending bar chart with cubes. Perfect for data visualization, business presentations, or illustrating trends. Representing financial, statistical or marketing information.
Free with trial A 3D rendered golden bar chart displays a clear downward trend. The bars are arranged from tallest on the left to shortest on the right, creating a visual representation of a decreasing value or performance. The metallic gold finish gives the chart a sense of importance and financial significance. The object is isolated on a clean white background. Chart financial growth decrease illustrations Golden Bar Chart Showing a Downward Trend on a White Background graph metallic. A 3D rendered golden bar chart displays a clear downward trend. The bars are arranged from tallest on the left to shortest on the right, creating a visual representation of a decreasing value or performance. The metallic gold finish gives the chart a sense of importance and financial significance. The object is isolated on a clean white background
Free with trial Financial data chart, glowing lines, digital display. Stock image showing trends. Chart financial growth decrease illustrations Digital financial graph with candlestick chart, data analytics, stock market trend, technology concept. Financial data chart, glowing lines, digital display. Stock image showing trends
Free with trial A comprehensive set of monochromatic icons representing various financial and statistical growth metrics. The icons include bar graphs, line charts, pie charts, and other graphical representations of data. Some icons depict upward trends, stability, percentages, and financial symbols such as dollar signs and coins. The overall theme is focused on financial analysis, economic growth, and data. Chart financial growth decrease illustrations Collection of financial and statistical growth icons. A comprehensive set of monochromatic icons representing various financial and statistical growth metrics. The icons include bar graphs, line charts, pie charts, and other graphical representations of data. Some icons depict upward trends, stability, percentages, and financial symbols such as dollar signs and coins. The overall theme is focused on financial analysis, economic growth, and data
Free with trial A visual representation of a stock market crash, showing falling arrows and declining charts. Illustrates financial crisis, economic downturn, and investment loss. A symbolic depiction of recession. Chart financial growth decrease illustrations Stock market crash financial crisis recession investment loss downward trend economic downturn chart analysis. A visual representation of a stock market crash, showing falling arrows and declining charts. Illustrates financial crisis, economic downturn, and investment loss. A symbolic depiction of recession.
Free with trial This image showcases vibrant 3D bar and pie charts illustrating upward trending business growth and financial success. Perfect for presentations or reports. Chart financial growth decrease illustrations Colorful 3D Bar Charts and Pie Charts Showing Business Growth. This image showcases vibrant 3D bar and pie charts illustrating upward trending business growth and financial success. Perfect for presentations or reports.
Free with trial 3D graphic depicts a steeply declining bar graph in red hues, showing economic loss. A downward-sloping arrow extends over the bars, illustrating the negative trend. The text reads "-40% PROFIT," emphasizing financial decline. The bars decrease in height from left to right, indicating progressive loss. The background is a dark grid, enhancing the focus on the graph. The visual conveys the concept of significant profit reduction and economic downturn. Chart financial growth decrease illustrations 3D Financial Concept of Profit Loss and Economic Decline. 3D graphic depicts a steeply declining bar graph in red hues, showing economic loss. A downward-sloping arrow extends over the bars, illustrating the negative trend. The text reads "-40% PROFIT," emphasizing financial decline. The bars decrease in height from left to right, indicating progressive loss. The background is a dark grid, enhancing the focus on the graph. The visual conveys the concept of significant profit reduction and economic downturn.
Free with trial Simple Bar Chart Showing Business Growth and Data Trends. Chart financial growth decrease vectors Simple Bar Chart Showing Business Growth and Data Trends
Free with trial A dynamic black and white background pattern featuring a collection of hand-drawn financial and economic elements. The design includes various currency symbols like the Dollar, Euro, and Yen, alongside upward and downward arrows, zig-zag lines representing market volatility, and simple bar charts indicating growth or decline. Scattered ink splatters add a grunge, artistic touch to the overall composition. This versatile illustration is ideal for conveying concepts related to global finance, business trends, investment, stock market fluctuations, economic data, and wealth management in a creative and engaging way. Chart financial growth decrease vectors Hand Drawn Financial Market Elements Background Pattern. A dynamic black and white background pattern featuring a collection of hand-drawn financial and economic elements. The design includes various currency symbols like the Dollar, Euro, and Yen, alongside upward and downward arrows, zig-zag lines representing market volatility, and simple bar charts indicating growth or decline. Scattered ink splatters add a grunge, artistic touch to the overall composition. This versatile illustration is ideal for conveying concepts related to global finance, business trends, investment, stock market fluctuations, economic data, and wealth management in a creative and engaging way.
Free with trial Bar chart and line graph showing financial data and trends. Generative AI. Chart financial growth decrease illustrations Bar chart and line graph showing financial data and trends
Free with trial A detailed data visualization illustrating market trends over time. The infographic combines a line chart, which shows fluctuating values and percentages, with a bar chart representing data for specific time intervals. The line chart highlights key data points, such as peaks annotated with values like '1. 24%' and '500K'. The x-axis represents a timeline from January to March, while the y-axis. Chart financial growth decrease illustrations A modern market trend analysis visualization combining a bar and line chart for financial data isolated on white background. A detailed data visualization illustrating market trends over time. The infographic combines a line chart, which shows fluctuating values and percentages, with a bar chart representing data for specific time intervals. The line chart highlights key data points, such as peaks annotated with values like '1.24%' and '500K'. The x-axis represents a timeline from January to March, while the y-axis
Free with trial Close-up view of a graph illustrating data analysis, trends, and financial growth ,Generative ai. Chart financial growth decrease illustrations Closeup, graph analysis, trends, and financial growth insights on table closeup. Close-up view of a graph illustrating data analysis, trends, and financial growth ,Generative ai
Free with trial A conceptual image of wooden blocks of varying sizes and colors arranged on a balanced scale, representing financial growth and business development. Chart financial growth decrease illustrations Wooden blocks balanced on a scale showing business growth. A conceptual image of wooden blocks of varying sizes and colors arranged on a balanced scale, representing financial growth and business development
Free with trial Growth financial business on white background. Isolated 3D illustration. Chart financial growth decrease illustrations Growth financial business on white background. Isolated 3D illustration
Free with trial A close-up shot of a hand holding white chalk, drawing a bar chart with a clear downward trend on a dark green chalkboard. The chart features bars progressively decreasing in height from left to right, visually representing a decline. A large, prominent arrow drawn in chalk points diagonally downwards across the graph, powerfully emphasizing concepts of recession, loss, negative growth, or a falling market. This image is ideal for illustrating financial downturns, business challenges, economic crisis, or any concept of decreasing performance and negative statistics. Chart financial growth decrease illustrations Downward Trend Bar Chart with Chalk and Hand on Chalkboard. A close-up shot of a hand holding white chalk, drawing a bar chart with a clear downward trend on a dark green chalkboard. The chart features bars progressively decreasing in height from left to right, visually representing a decline. A large, prominent arrow drawn in chalk points diagonally downwards across the graph, powerfully emphasizing concepts of recession, loss, negative growth, or a falling market. This image is ideal for illustrating financial downturns, business challenges, economic crisis, or any concept of decreasing performance and negative statistics.
Free with trial This image illustrates investment risk management featuring a person holding a stock market chart with fluctuating red and blue bars overlaid with a percentage sign having upward and downward arrows This signifies market volatility financial risk assessment and decisions around investment strategies aimed at minimizing potential losses and maximizing returns in a fluctuating financial landscape. Chart financial growth decrease illustrations Investment Risk Management Volatility with Person Holding Stock Market Chart and Percentage Sign Symbol Displayed. This image illustrates investment risk management featuring a person holding a stock market chart with fluctuating red and blue bars overlaid with a percentage sign having upward and downward arrows This signifies market volatility financial risk assessment and decisions around investment strategies aimed at minimizing potential losses and maximizing returns in a fluctuating financial landscape
Free with trial A collection of line icons representing various financial concepts, including money, bitcoin, shopping, and business growth, all in a simple black and white design. Chart financial growth decrease vectors Financial Icons Set with Money, Bitcoin, and Business Symbols. A collection of line icons representing various financial concepts, including money, bitcoin, shopping, and business growth, all in a simple black and white design
Free with trial A conceptual image featuring a man walking towards a tank, symbolizing growth and progress in finance. Coins stack up alongside an upward chart, representing success. Chart financial growth decrease illustrations Business Growth Symbolized by Tank and Man Walking on Coins. A conceptual image featuring a man walking towards a tank, symbolizing growth and progress in finance. Coins stack up alongside an upward chart, representing success
Free with trial Money loss and economic crisis, money market crash and global financial downturn, vector line icons. Economic crisis icons of bankruptcy, price decrease with money inflation and unemployment growth. Chart financial growth decrease vectors Money loss and economic crisis, money market crash
Free with trial The a digital screen displaying a financial graph with a green upward trending line representing data growth. The screen white text and numerical values, including a 5746% increase and a 5. 66% decrease. The background is dark, and the graph glows with a neon green hue, suggesting a futuristic or tech-oriented style. The interface includes a title bar with options like Dashboard, Announcements, and. Chart financial growth decrease illustrations Green upward trending financial graph on dark digital screen. The a digital screen displaying a financial graph with a green upward trending line representing data growth. The screen white text and numerical values, including a 5746% increase and a 5.66% decrease. The background is dark, and the graph glows with a neon green hue, suggesting a futuristic or tech-oriented style. The interface includes a title bar with options like Dashboard, Announcements, and
Free with trial Visual representation of the indian economy facing a downturn, with a declining arrow and falling charts, indicating a potential recession and financial crisis. it highlights the challenges and risks. Chart financial growth decrease illustrations Indian economy crisis rupee symbol stock market crash recession financial downfall economic depression chart graph. visual representation of the indian economy facing a downturn, with a declining arrow and falling charts, indicating a potential recession and financial crisis. it highlights the challenges and risks.
Free with trial This digital image shows a glowing blue financial graph indicating market trends, growth, and data analysis. Chart financial growth decrease illustrations Blue digital financial graph representing increasing data and information. This digital image shows a glowing blue financial graph indicating market trends, growth, and data analysis
Free with trial An detailed set of stock market financial trends and business growth line icons for data analysis and reporting. Chart financial growth decrease vectors Stock market financial trends and business growth line icons
Free with trial Money loss and economic crisis, money market crash and global financial downturn, vector line icons. Economic crisis icons of bankruptcy, price decrease with money inflation and unemployment growth. Chart financial growth decrease vectors Money loss and economic crisis, money market crash
Free with trial Bitcoin coin value rise and fall charts. Financial infographic. Cryptocurrency crisis. Growth arrow. Crypto currency income. Investment BTC prices statistic diagram. Gold cash stacks. Vector concept. Chart financial growth decrease vectors Bitcoin coin value rise and fall charts. Financial infographic. Cryptocurrency crisis. Crypto currency income. Bitcoin coin value rise and fall charts. Financial infographic. Cryptocurrency crisis. Growth arrow. Crypto currency income. Investment BTC prices statistic diagram. Gold cash stacks. Vector concept
Free with trial This graphic features three stylized red candlestick chart icons arranged in a sequence against a clean white background. Each icon consists of a rectangular body with thin vertical lines extending from the top and bottom, symbolizing financial market data. The vibrant red color indicates a bearish or declining trend in asset valuation. The minimalist design provides a clear and professional. Chart financial growth decrease vectors Three red candlestick chart icons representing a downward market trend on white background. This graphic features three stylized red candlestick chart icons arranged in a sequence against a clean white background. Each icon consists of a rectangular body with thin vertical lines extending from the top and bottom, symbolizing financial market data. The vibrant red color indicates a bearish or declining trend in asset valuation. The minimalist design provides a clear and professional
Free with trial Detailed illustration featuring a variety of hand drawn style financial charts and data analysis line icons including growth curves and market trends. Chart financial growth decrease vectors Collection of business data and financial analytics line icons. detailed illustration featuring a variety of hand drawn style financial charts and data analysis line icons including growth curves and market trends
Free with trial Collection of various business and financial chart icons in a modern, flat style, set against a dark blue background. Perfect for infographics, presentations, and websites requiring data visualization elements. Chart financial growth decrease illustrations Business and Financial Icons Set on Dark Blue Background for Design Elements. Collection of various business and financial chart icons in a modern, flat style, set against a dark blue background. Perfect for infographics, presentations, and websites requiring data visualization elements
Free with trial This image illustrates business concepts such as profit growth and cost reduction using graphical representations on digital devices A businessman points a pen towards the graphics highlighting the importance of financial strategy and positive business outcomes It emphasizes the analytical aspect of monitoring progress. Chart financial growth decrease illustrations Profit growth and cost reduction depicted with graphs and a businessman. This image illustrates business concepts such as profit growth and cost reduction using graphical representations on digital devices A businessman points a pen towards the graphics highlighting the importance of financial strategy and positive business outcomes It emphasizes the analytical aspect of monitoring progress
Free with trial Visualizing cost reduction with a declining graph held in a hand, symbolizing strategic expense management and improved profitability for business growth and financial success. A key concept. Chart financial growth decrease illustrations Cost reduction strategies: how to lower expenses and improve profitability for your business growth. visualizing cost reduction with a declining graph held in a hand, symbolizing strategic expense management and improved profitability for business growth and financial success. A key concept.
Free with trial 3D bar chart illustrating decline, financial loss, or negative growth. Purple bars and arrow on white. Chart financial growth decrease illustrations Purple bar graph showing downward trend with arrow, financial concept. 3D bar chart illustrating decline, financial loss, or negative growth. Purple bars and arrow on white
Free with trial An open notebook displays two pages of business data visualization with a vertical bar graph on the left page featuring green, red, and blue bars alongside a central pie chart divided into red, blue, and green segments showing 70% in red with upward and downward arrows indicating percentage changes, all set against a clean white background ideal for concepts of analytics, financial reporting,. Chart financial growth decrease illustrations Business data analysis shown in an open notebook with colorful bar graph and pie chart illustrating statistics and percentages. An open notebook displays two pages of business data visualization with a vertical bar graph on the left page featuring green, red, and blue bars alongside a central pie chart divided into red, blue, and green segments showing 70% in red with upward and downward arrows indicating percentage changes, all set against a clean white background ideal for concepts of analytics, financial reporting,
Free with trial Bar chart illustrating financial decline with a red arrow pointing downwards towards a dollar symbol. Represents economic recession, loss, and market crash. Chart financial growth decrease illustrations Financial graph showing downward trend with red arrow and dollar sign. Bar chart illustrating financial decline with a red arrow pointing downwards towards a dollar symbol. Represents economic recession, loss, and market crash
Free with trial Green stock chart growth and upward trend on a vibrant green background ,Generative ai. Chart financial growth decrease illustrations Green stock chart indicates upward growth trend in a bull market on green background. Green stock chart growth and upward trend on a vibrant green background ,Generative ai
Free with trial A vibrant infographic illustrating business growth, financial analysis, and data visualization with charts, graphs, and icons. Chart financial growth decrease vectors Infographic of Business Growth and Financial Analysis with Charts and Icons. A vibrant infographic illustrating business growth, financial analysis, and data visualization with charts, graphs, and icons
Free with trial Comprehensive vector silhouette icon set featuring essential financial concepts and business analytics. This professional collection includes 3D growth charts, economic downfall trends, global trade networks, magnifying glass market research, currency balance scales, and intersecting risk analysis arrows. Perfect for corporate presentations, fintech applications, stock market reports, banking graphics, and economic data visualization. Clean, high-contrast, and isolated on a pure white background for versatile commercial use. Chart financial growth decrease vectors Financial Analytics and Global Market Trends Vector Silhouette Icon Set. Comprehensive vector silhouette icon set featuring essential financial concepts and. Comprehensive vector silhouette icon set featuring essential financial concepts and business analytics. This professional collection includes 3D growth charts, economic downfall trends, global trade networks, magnifying glass market research, currency balance scales, and intersecting risk analysis arrows. Perfect for corporate presentations, fintech applications, stock market reports, banking graphics, and economic data visualization. Clean, high-contrast, and isolated on a pure white background for versatile commercial use.
Free with trial The image illustrates a combination of bar and line graphs to represent business performance trends. The bars show an overall upward trend in growth, while the red line indicates a recent decline after a period of increase. This visualization is often used in financial reports, market analysis, or business presentations to depict fluctuations in data over time, such as revenue, market share, or. Chart financial growth decrease illustrations Growth and decline in business performance visualized with bar and line graphs. The image illustrates a combination of bar and line graphs to represent business performance trends. The bars show an overall upward trend in growth, while the red line indicates a recent decline after a period of increase. This visualization is often used in financial reports, market analysis, or business presentations to depict fluctuations in data over time, such as revenue, market share, or
Free with trial The image shows a painted canvas on an easel with a bar chart illustrating a downward trend, followed by a red line chart that also declines sharply. The visual metaphorically represents economic downturns, financial losses, or decreasing performance metrics, possibly used for business, financial, or educational contexts to illustrate negative growth trends. Chart financial growth decrease illustrations Economic decline depicted through a falling bar and line chart on an easel. The image shows a painted canvas on an easel with a bar chart illustrating a downward trend, followed by a red line chart that also declines sharply. The visual metaphorically represents economic downturns, financial losses, or decreasing performance metrics, possibly used for business, financial, or educational contexts to illustrate negative growth trends
Free with trial A watercolor painting of a downward trending financial chart, symbolizing market instability, economic downturn, investment risk, financial loss, and uncertainty. Spacious empty area designed for product displays and advertisements. Perfect for banners, branding, and marketing visuals. . Generative AI. Chart financial growth decrease illustrations Watercolor Chart Decline A watercolor painting of a downward trending financial chart symbolizing market instability economic. A watercolor painting of a downward trending financial chart, symbolizing market instability, economic downturn, investment risk, financial loss, and uncertainty. Spacious empty area designed for product displays and advertisements. Perfect for banners, branding, and marketing visuals. . Generative AI
Free with trial 3D bar chart with red upward and downward arrows indicating growth and decline trends. Chart financial growth decrease vectors Graphic illustration showing upward and downward trend arrows with bar chart. 3D bar chart with red upward and downward arrows indicating growth and decline trends
Free with trial A business professional analyzes a cost reduction strategy presented as a decreasing bar graph pointing downwards indicating financial efficiency improvement and effective planning He is using a digital pen to examine the data and implement solutions while utilizing a laptop suggesting technological integration for business growth. Chart financial growth decrease illustrations Cost Reduction Strategy Analysis with Decreasing Bar Graph and Executive Action Plan Showing Efficiency Improvement and Financial. A business professional analyzes a cost reduction strategy presented as a decreasing bar graph pointing downwards indicating financial efficiency improvement and effective planning He is using a digital pen to examine the data and implement solutions while utilizing a laptop suggesting technological integration for business growth
Free with trial A collection of six distinct financial icons representing concepts like money, exchange, growth, and investment. Perfect for business, finance, and economic presentations. Chart financial growth decrease illustrations Financial icons set money bag graph arrows coin exchange and growth concepts. A collection of six distinct financial icons representing concepts like money, exchange, growth, and investment. Perfect for business, finance, and economic presentations
Free with trial A vibrant and diverse set of financial icons, including symbols for money, growth, and profit, as well as various charts and graphs. The icons are colorful and modern, making them perfect for use in business presentations, reports, and marketing materials. The white background provides a clean and neutral space for the icons to stand out, allowing for easy customization and integration into various designs. Chart financial growth decrease vectors A collection of colorful financial icons on a white background for business use. A vibrant and diverse set of financial icons, including symbols for money, growth, and profit, as well as various charts and graphs. The icons are colorful and modern, making them perfect for use in business presentations, reports, and marketing materials. The white background provides a clean and neutral space for the icons to stand out, allowing for easy customization and integration into various designs.
Free with trial Black chart with stop sign, representing a stop in economic growth. Chart financial growth decrease vectors Stop growing bar chart icon, simple style. Black chart with stop sign, representing a stop in economic growth
Free with trial This is an detailed collection of financial growth charts and market volatility icons in a clean minimal style. Chart financial growth decrease vectors Financial line icons showing stock market trends with bull and bear symbols. This is an detailed collection of financial growth charts and market volatility icons in a clean minimal style
Free with trial The image features a collection of red percentage symbols and arrows, both upward and downward, scattered across a white background. The upward arrows indicate positive growth or increases, while the downward arrows suggest declines or decreases in value. The combination of these elements visually represents financial trends, market fluctuations, and percentage-based changes, often seen in stock. Chart financial growth decrease illustrations Dynamic financial symbols illustrating market trends and percentage changes. The image features a collection of red percentage symbols and arrows, both upward and downward, scattered across a white background. The upward arrows indicate positive growth or increases, while the downward arrows suggest declines or decreases in value. The combination of these elements visually represents financial trends, market fluctuations, and percentage-based changes, often seen in stock
Free with trial 3D pie chart illustrating data segments with percentage values, alongside a bar graph in the background, showcasing financial or business data. Chart financial growth decrease illustrations 3D pie chart illustrating data segments with percentage values, alongside a bar graph in the background, showcasing financial or
Free with trial Detailed collection of linear icons representing various business trends, financial growth metrics, and candlestick market data. Chart financial growth decrease vectors Financial business graph and chart line icons for data analysis and kpi tracking. detailed collection of linear icons representing various business trends, financial growth metrics, and candlestick market data
Free with trial A visual representation of a steep financial or performance decrease, indicated by a series of descending bars and directional arrows. Chart financial growth decrease illustrations 3D bar chart showing a significant decline from 100% to 10% with downward arrows. A visual representation of a steep financial or performance decrease, indicated by a series of descending bars and directional arrows
Free with trial A flat illustration showing a financial decline with a bar graph, falling line, and arrow pointing down. It is in a colorful style. Chart financial growth decrease vectors Financial Downturn Graphic: Stock Chart with Decreasing Value and Falling Arrow. A flat illustration showing a financial decline with a bar graph, falling line, and arrow pointing down. It is in a colorful style.
Free with trial A 3D bar chart visually represents a financial or performance decline. The bars decrease in height from left to right, labeled with percentages indicating a downward trend. This graphic signifies loss or reduction. Chart financial growth decrease illustrations Declining blue bar chart showing percentage decrease from 100 percent downwards. A 3D bar chart visually represents a financial or performance decline. The bars decrease in height from left to right, labeled with percentages indicating a downward trend. This graphic signifies loss or reduction
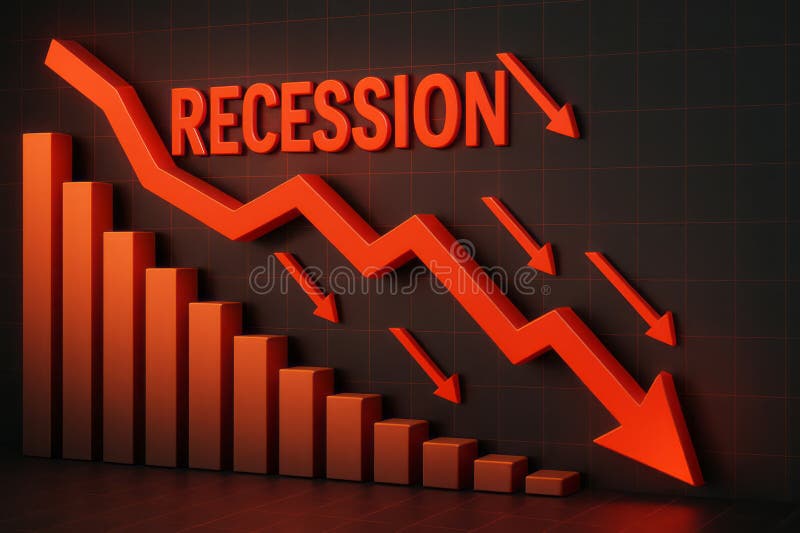
Free with trial This image visually represents an economic recession through downward trends and statistics. The vibrant red arrows emphasize the significant decline in growth, making it an impactful visual for financial analysis. Chart financial growth decrease illustrations Dramatic Decline in Economic Growth with Recession Indicator and Downward Arrows in Red. This image visually represents an economic recession through downward trends and statistics. The vibrant red arrows emphasize the significant decline in growth, making it an impactful visual for financial analysis
Free with trial A person analyzes a pie chart representing different aspects of the music industry with currency symbols and icons for digital media streaming and content management while a pair of scissors cuts into a segment labeled DECREASE symbolizing financial review and cost cutting measures. Chart financial growth decrease vectors Business Analysis Evaluating Music Industry Finances and Identifying Cost Reductions. A person analyzes a pie chart representing different aspects of the music industry with currency symbols and icons for digital media streaming and content management while a pair of scissors cuts into a segment labeled DECREASE symbolizing financial review and cost cutting measures
Free with trial The image depicts a series of ascending wooden blocks forming a staircase, with a red upward-sloping arrow indicating growth. Following this, a downward red arrow suggests a subsequent decline, symbolizing a rise and fall trend often seen in market trends, business cycles, or performance metrics. Chart financial growth decrease illustrations Visual representation of growth and decline in a business or financial context. The image depicts a series of ascending wooden blocks forming a staircase, with a red upward-sloping arrow indicating growth. Following this, a downward red arrow suggests a subsequent decline, symbolizing a rise and fall trend often seen in market trends, business cycles, or performance metrics