Free with trial Collection of black vector icons featuring downward trending charts, magnifying glass over bar graph, document reports, and computer screen data analysis symbols representing financial decline and analytics. Generative AI. Chart financial growth decrease vectors Black icons set showing downward trending graphs analysis with document reports magnifying glass and data visualization. Collection of black vector icons featuring downward trending charts, magnifying glass over bar graph, document reports, and computer screen data analysis symbols representing financial decline and analytics. Generative AI
Free with trial Vector illustration of a red downward trend line graph showing economic crisis, financial loss, or business decline. Concept of recession, risk, and negative performance. Chart financial growth decrease vectors Downward trend red graph illustration. Vector illustration of a red downward trend line graph showing economic crisis, financial loss, or business decline. Concept of recession, risk, and negative performance.
Free with trial A downward-trending red line graph overlays a dark screen displaying financial data with glowing red and green numbers. Image. Chart financial growth decrease illustrations Stock Market Ticker with Red Decline Line. A downward-trending red line graph overlays a dark screen displaying financial data with glowing red and green numbers. Image
Free with trial Bar graph depicting a decline, representing economic downturn, stock market decline, and company insolvency with a dropping red arrow. Chart financial growth decrease vectors Bar chart illustrating a downward trend, symbolizing financial loss, market crash, and business failure with a falling red arrow. Bar graph depicting a decline, representing economic downturn, stock market decline, and company insolvency with a dropping red arrow
Free with trial Graphic showing 3d bar chart with pink blue and yellow bars on a white card against white background. Chart financial growth decrease illustrations 3D Bar Chart with Pink Blue and Yellow Bars on a White Card Against White Background Keywords: bar chart, graph, data, statistics. Graphic showing 3d bar chart with pink blue and yellow bars on a white card against white background
Free with trial Illustration symbolizing economic decline with a descending bar graph and dollar sign. Chart financial growth decrease vectors Economic downturn concept with bar chart. Illustration symbolizing economic decline with a descending bar graph and dollar sign
Free with trial A modern 3D percentage symbol in bold blue, exuding a professional and financial aesthetic. Perfect for business presentations, financial reports, and digital marketing materials. Chart financial growth decrease illustrations Percentage symbol icon with bold blue 3D design featuring 3D, finance, business with professional and graphic elements for. A modern 3D percentage symbol in bold blue, exuding a professional and financial aesthetic. Perfect for business presentations, financial reports, and digital marketing materials
Free with trial A 3D rendered yellow Bitcoin coin with the iconic 'B' symbol is centrally placed. To its left, a green circle with an upward arrow signifies growth, while to its right, a red circle with a downward arrow represents decline. These elements are presented on a clean white background, illustrating cryptocurrency market trends. Chart financial growth decrease illustrations 3D Rendered Bitcoin Symbol with Up and Down Arrows Indicating Cryptocurrency Market Trends on a White Background. A 3D rendered yellow Bitcoin coin with the iconic 'B' symbol is centrally placed. To its left, a green circle with an upward arrow signifies growth, while to its right, a red circle with a downward arrow represents decline. These elements are presented on a clean white background, illustrating cryptocurrency market trends
Free with trial Global economic slowdown shown by falling market finance with inflation crisis and recession impacting business growth. Generative AI. Chart financial growth decrease illustrations Global economic slowdown shown by falling market finance with inflation crisis and recession impacting business growth
Free with trial Photo of handwritten charts illustrating inflation and potential recession. Graphs show rising prices and economic downturn concerns. Financial crisis concept depicted with, business. Chart financial growth decrease illustrations Photo of handwritten charts illustrating inflation and potential recession. Graphs show rising prices and economic downturn
Free with trial Minus 5 percent decrease red arrow. Plus 10 percent increase green arrow. Economic indicators. Financial statistics. Business performance. Market fluctuations shown. Chart financial growth decrease illustrations Red down arrow with minus 5 percent and green up arrow with plus 10 percent on white background. Minus 5 percent decrease red arrow. Plus 10 percent increase green arrow. Economic indicators. Financial statistics. Business performance. Market fluctuations shown
Free with trial Percentage sign icon, related to accounting, ideal for financial, tax, or business-related designs. Chart financial growth decrease vectors Professional Percentage Sign Icon for Accounting Purposes. Percentage sign icon, related to accounting, ideal for financial, tax, or business-related designs.
Free with trial Percentage sign icon, related to accounting, ideal for financial, tax, or business-related designs. Chart financial growth decrease vectors Professional Percentage Sign Icon for Accounting Purposes. Percentage sign icon, related to accounting, ideal for financial, tax, or business-related designs.
Free with trial GDP wooden blocks symbolize global economy slowdown and economic recession crisis with inflation impacting finance and business market growth. Generative AI. Chart financial growth decrease illustrations GDP wooden blocks symbolize global economy slowdown and economic recession crisis with inflation impacting finance and business
Free with trial Business graph icon. Flat design. Vector illustration, EPS 10. Chart financial growth decrease vectors Recession statistics financial failure concept. Business graph icon. Flat design. Vector illustration, EPS 10.
Free with trial Professional vector illustration of downward sloping bar graph and connected dots line represents decreasing profits market loss economic recession data analysis results reduction in growth levels and monthly revenue falling. Chart financial growth decrease illustrations Descending bar chart icon with line graph showing negative business trends and financial decline on transparent background. Professional vector illustration of downward sloping bar graph and connected dots line represents decreasing profits market loss economic recession data analysis results reduction in growth levels and monthly revenue falling
Free with trial Gross Domestic Product (GDP) text on a world map, indicating economic analysis direction with up and down arrows, symbolizing global investment and financial trends. Chart financial growth decrease illustrations Gross Domestic Product GDP text in center of global map with arrows indicating economic analysis direction of stock and investment. Gross Domestic Product (GDP) text on a world map, indicating economic analysis direction with up and down arrows, symbolizing global investment and financial trends
Free with trial Elevate your financial presentations and data visualizations with these captivating vintage-style arrow graphics. Perfect for illustrating price fluctuations, interest rate movements, and market trends, these retro-inspired up and down arrow designs are a visually engaging way to convey complex information. The sepia tone and textured background add a touch of vintage charm, bringing a classic. Chart financial growth decrease illustrations Vintage-Inspired Arrow Graphics for Illustrating Price & Interest Rate Trends: A Retro Style Design Element. Elevate your financial presentations and data visualizations with these captivating vintage-style arrow graphics. Perfect for illustrating price fluctuations, interest rate movements, and market trends, these retro-inspired up and down arrow designs are a visually engaging way to convey complex information. The sepia tone and textured background add a touch of vintage charm, bringing a classic
Free with trial Vector illustration of a graph with a downward arrow, representing decline or negative growth. Chart financial growth decrease vectors Professional Graph with Arrow Down Outline Icon Vector Illustration. Vector illustration of a graph with a downward arrow, representing decline or negative growth.
Free with trial Three dimensional bright green arrows pointing downwards with white percentage symbols symbolizing a reduction or sale isolated on a transparent background. Chart financial growth decrease vectors Three bright green downward pointing arrows with percentage symbols indicating a decrease or discount isolated on transparent. Three dimensional bright green arrows pointing downwards with white percentage symbols symbolizing a reduction or sale isolated on a transparent background
Free with trial Small house sits on pile of coins. Yellow arrow graph shows sharp fall. Night cityscape background suggests economic downturn financial crisis. Chart financial growth decrease illustrations Small house sits on pile of coins. Yellow arrow graph shows sharp fall. Night cityscape background suggests economic downturn
Free with trial This compelling image depicts a visual representation of the current state of the real estate market. Wooden houses, symbolic of residential properties, are nestled within an empty shopping cart. A red downward-trending chart, overlaid with a soft bokeh effect, graphically illustrates the negative market trend. This visual narrative conveys a significant drop in sales, a decrease in property. Chart financial growth decrease illustrations Wooden Homes in Shopping Cart A Visual Representation of the Declining Real Estate Market and Reduced Demand. This compelling image depicts a visual representation of the current state of the real estate market. Wooden houses, symbolic of residential properties, are nestled within an empty shopping cart. A red downward-trending chart, overlaid with a soft bokeh effect, graphically illustrates the negative market trend. This visual narrative conveys a significant drop in sales, a decrease in property
Free with trial Wooden blocks spelling COST with a downward trending arrow and stack of coins, signifying reduced expenses and cost savings. Chart financial growth decrease illustrations Decreasing Costs Business Finance Concept: A Visual Representation of Reduced Expenses and Financial Savings. Wooden blocks spelling COST with a downward trending arrow and stack of coins, signifying reduced expenses and cost savings
Free with trial Minimalist black and white outline vector illustration of a simplified line graph icon for business analytics and financial performance tracking in a corporate environment. Chart financial growth decrease vectors Clean and straightforward icon depicting an increasing and decreasing line graph. Minimalist black and white outline vector illustration of a simplified line graph icon for business analytics and financial performance tracking in a corporate environment
Free with trial A wooden arrow pointing down is on top of a stack of wooden blocks. The arrow represents a downward trend or a decrease in something generated by AI. Chart financial growth decrease vectors A wooden arrow pointing down is on top of a stack of wooden blocks generated by AI. A wooden arrow pointing down is on top of a stack of wooden blocks. The arrow represents a downward trend or a decrease in something generated by AI
Free with trial A stack of wooden blocks with a red arrow pointing upwards. The blocks are arranged in a pyramid shape, with the top block being the largest. Concept of growth and progress generated by AI. Chart financial growth decrease vectors A stack of wooden blocks with a red arrow pointing upwards generated by AI. A stack of wooden blocks with a red arrow pointing upwards. The blocks are arranged in a pyramid shape, with the top block being the largest. Concept of growth and progress generated by AI
Free with trial A wooden arrow pointing upwards is on top of a stack of wooden blocks. Concept of growth and progress, as the arrow represents upward movement generated by AI. Chart financial growth decrease vectors A wooden arrow pointing upwards is on top of a stack of wooden blocks generated by AI. A wooden arrow pointing upwards is on top of a stack of wooden blocks. Concept of growth and progress, as the arrow represents upward movement generated by AI
Free with trial A close-up view of a monitor displaying complex financial data, including stock market charts and numerical values. Stock market Data Displayed on a Monitor. Chart financial growth decrease illustrations Stock market Data Displayed on a Monitor
Free with trial Bear Market, bearish market trend in stocks. Trade exchange background, down arrow graph for decrease in rates. Global economy crash. Chart financial growth decrease vectors Bear Market
Free with trial A chart displaying data trends on a white background. 3D Rendering. Chart financial growth decrease illustrations Graphical representation of data trends. 3D Rendering. A chart displaying data trends on a white background. 3D Rendering
Free with trial Bull Market, Bull or bullish run Bear or bearish market trend in stocks. Trade exchange, green up or red down arrows graph. Cryptocurrency price chart. Global economy crash or boom. Chart financial growth decrease vectors Bull Market
Free with trial A black and white line illustration features a speech bubble with a downward arrow and a dollar sign, indicating a decrease in value. Below, a stylized gold bar is depicted, flanked by two sparkles. The minimalistic design suggests an economic theme, likely related to changes in gold prices. Chart financial growth decrease vectors Gold Price Down. A black and white line illustration features a speech bubble with a downward arrow and a dollar sign, indicating a decrease in value. Below, a stylized gold bar is depicted, flanked by two sparkles. The minimalistic design suggests an economic theme, likely related to changes in gold prices.
Free with trial A graphic icon shows a stylized gold bar with two sparkle symbols on either side, suggesting value or shine. Above, a speech bubble contains a downward-facing arrow and a dollar sign, indicating a decrease or decline in value or price. The design uses a simple black and white color scheme, conveying information clearly and directly. Chart financial growth decrease vectors Gold Price Down. A graphic icon shows a stylized gold bar with two sparkle symbols on either side, suggesting value or shine. Above, a speech bubble contains a downward-facing arrow and a dollar sign, indicating a decrease or decline in value or price. The design uses a simple black and white color scheme, conveying information clearly and directly.
Free with trial This image features two variations of a graph icon showing a downward trend. One is a simple outline, while the other is a solid black silhouette. Both depict a graph with a sharp decline, represented by a line with a downward-pointing arrow. The icons are suitable for illustrating concepts like financial loss, economic downturn, negative growth, or any situation involving a decrease in value or performance. Chart financial growth decrease illustrations Declining Graph Icon Set. This image features two variations of a graph icon showing a downward trend. One is a simple outline, while the other is a solid black silhouette. Both depict a graph with a sharp decline, represented by a line with a downward-pointing arrow. The icons are suitable for illustrating concepts like financial loss, economic downturn, negative growth, or any situation involving a decrease in value or performance.
Free with trial A simple, flat design icon depicting a downward trend. The image features a red graph line descending from the top left to the bottom right, with an arrow indicating the direction. The graph is set against a clean white background, emphasizing the visual impact of the trend. This graphic is suitable for illustrating concepts such as financial decline, decreasing sales, or negative performance in business, economics, or data analysis. Chart financial growth decrease vectors Downward Trend Graph Icon. A simple, flat design icon depicting a downward trend. The image features a red graph line descending from the top left to the bottom right, with an arrow indicating the direction. The graph is set against a clean white background, emphasizing the visual impact of the trend. This graphic is suitable for illustrating concepts such as financial decline, decreasing sales, or negative performance in business, economics, or data analysis.
Free with trial A computer displays a dramatic downward trending graph, generated by AI, symbolizing a market crash or economic downturn. The image is a 3D rendering showing a clean, modern workspace setting, highlighting the severity of the financial decline depicted on screen. Chart financial growth decrease illustrations Market Crash Simulation. A computer displays a dramatic downward trending graph, generated by AI, symbolizing a market crash or economic downturn. The image is a 3D rendering showing a clean, modern workspace setting, highlighting the severity of the financial decline depicted on screen.
Free with trial A red J is on a table with a graph behind it. The graph shows a downward trend, which could represent a decrease in value or a negative outcome. The red J could symbolize a warning or a call to action. Chart financial growth decrease illustrations A red J is on a table with a graph behind it
Free with trial Two 3D arrows, one red pointing down and one green pointing up, symbolizing contrasting financial trends or data analysis. Visual representation of market fluctuations. Chart financial growth decrease illustrations Arrow chart up and down on. Two 3D arrows, one red pointing down and one green pointing up, symbolizing contrasting financial trends or data analysis. Visual representation of market fluctuations
Free with trial A simple line graph illustration showing fluctuations and an upward trend. The graph is drawn on a grid with a black line and red data points, indicating a period of increase, followed by a decrease, and then a final increase. This image can be used to represent business trends, financial analysis, stock market data, or any data that shows changes over time. Chart financial growth decrease vectors Line Graph with Fluctuations. A simple line graph illustration showing fluctuations and an upward trend. The graph is drawn on a grid with a black line and red data points, indicating a period of increase, followed by a decrease, and then a final increase. This image can be used to represent business trends, financial analysis, stock market data, or any data that shows changes over time.
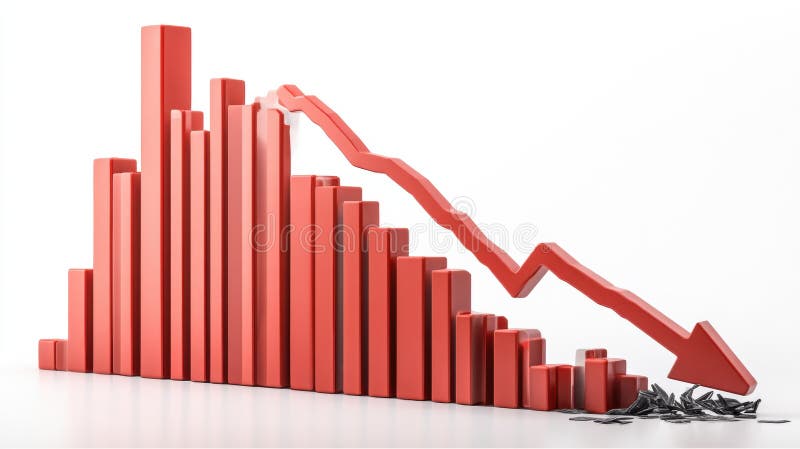
Free with trial A 3D rendering of a bar graph depicting a sharp decline in values. The red bars decrease in size, culminating in a large downward red arrow, symbolizing a significant economic downturn or market crash. The broken pieces at the bottom represent the loss or damage incurred. Chart financial growth decrease illustrations Red Bar Graph Showing Decline. A 3D rendering of a bar graph depicting a sharp decline in values. The red bars decrease in size, culminating in a large downward red arrow, symbolizing a significant economic downturn or market crash. The broken pieces at the bottom represent the loss or damage incurred.
Free with trial A graph with a red line and a green line. This could represent a decrease in one variable and an increase in another. Chart financial growth decrease illustrations A graph with a red line and a green line
Free with trial This image, generated by AI, depicts a hand placing a small, metallic object onto a graph showing a sharp market decline. It visually represents the fragility and potential for sudden drops in financial markets. The image is a high-quality 3D rendering. Chart financial growth decrease illustrations AI-Generated Market Crash Image. This image, generated by AI, depicts a hand placing a small, metallic object onto a graph showing a sharp market decline. It visually represents the fragility and potential for sudden drops in financial markets. The image is a high-quality 3D rendering.
Free with trial A businessman in a suit interacts with a digital interface illustrating the relationship between quality and cost. The image features a visual representation of increasing quality and decreasing cost, with checkmarks indicating positive outcomes. This concept is ideal for illustrating business strategies, efficiency, and financial planning. The scene includes a clipboard with charts, adding a professional context. Chart financial growth decrease illustrations Quality vs. Cost: Business Concept. A businessman in a suit interacts with a digital interface illustrating the relationship between quality and cost. The image features a visual representation of increasing quality and decreasing cost, with checkmarks indicating positive outcomes. This concept is ideal for illustrating business strategies, efficiency, and financial planning. The scene includes a clipboard with charts, adding a professional context.
Free with trial A close-up shot of wooden blocks arranged to form a small graph, illustrating an interest rate. The blocks are textured and have percentage symbols and directional arrows carved into them. The image has a dark, moody feel and evokes concepts of finance, economics, and growth or decline. Chart financial growth decrease illustrations Wooden blocks interest rate graph. A close-up shot of wooden blocks arranged to form a small graph, illustrating an interest rate. The blocks are textured and have percentage symbols and directional arrows carved into them. The image has a dark, moody feel and evokes concepts of finance, economics, and growth or decline
Free with trial A hand places a Bitcoin into a piggy bank, symbolizing cryptocurrency investment. The upward arrow and growing bar graph illustrate increasing value, a visual representation of potential returns generated by AI. Chart financial growth decrease illustrations Bitcoin Piggy Bank Savings Growth. A hand places a Bitcoin into a piggy bank, symbolizing cryptocurrency investment. The upward arrow and growing bar graph illustrate increasing value, a visual representation of potential returns generated by AI.
Free with trial This 3D rendering shows a stylized stock market chart, generated by AI, displayed on a sleek, blue metallic stand. The vibrant blue color and modern design make it visually appealing and ideal for representing technological advancements in finance. Chart financial growth decrease illustrations AI-Generated Stock Market Display. This 3D rendering shows a stylized stock market chart, generated by AI, displayed on a sleek, blue metallic stand. The vibrant blue color and modern design make it visually appealing and ideal for representing technological advancements in finance.
Free with trial A captivating image featuring a descending bar graph composed of miniature candy canes against a bokeh background of twinkling Christmas lights and miniature snow-covered evergreen trees. The candy canes, in classic red and white stripes, visually represent a declining trend or decrease. The scene evokes a festive yet subtly concerning mood, ideal for illustrating concepts related to holiday. Chart financial growth decrease illustrations Christmas Candy Cane Graph Decline. A captivating image featuring a descending bar graph composed of miniature candy canes against a bokeh background of twinkling Christmas lights and miniature snow-covered evergreen trees. The candy canes, in classic red and white stripes, visually represent a declining trend or decrease. The scene evokes a festive yet subtly concerning mood, ideal for illustrating concepts related to holiday
Free with trial This image showcases a downward trending graph, generated by AI, represented by a red arrow descending within a transparent glass structure. The visual effectively communicates decline or negative growth. The clean, minimalist design enhances the impact of the falling trend. Chart financial growth decrease illustrations Decreasing Trend: AI-Generated Graph. This image showcases a downward trending graph, generated by AI, represented by a red arrow descending within a transparent glass structure. The visual effectively communicates decline or negative growth. The clean, minimalist design enhances the impact of the falling trend.
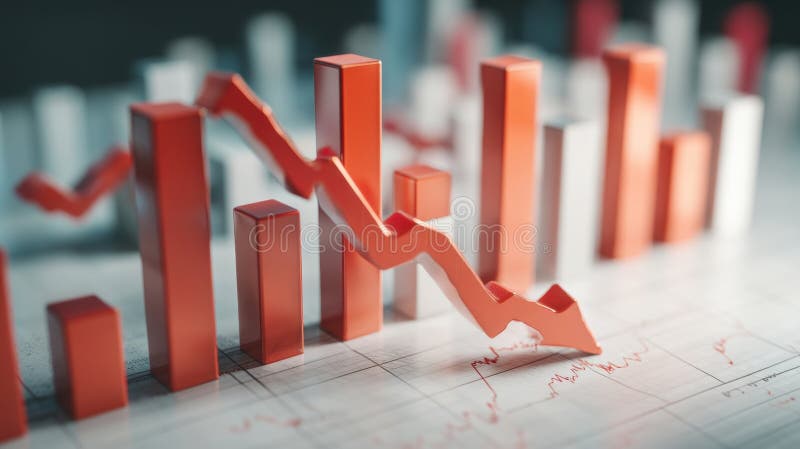
Free with trial This image depicts a 3D rendering of a downward trending graph, generated by AI, showcasing a clear visual representation of market decline or economic downturn. The red bars and arrow emphasize the severity of the fall, suggesting potential financial instability or crisis. Chart financial growth decrease illustrations Declining Market Trends. This image depicts a 3D rendering of a downward trending graph, generated by AI, showcasing a clear visual representation of market decline or economic downturn. The red bars and arrow emphasize the severity of the fall, suggesting potential financial instability or crisis.
Free with trial Flat icons related to financial transactions pertaining to business or personal both. Very well crafted finance icons set to be used in related projects. Grab this pack and enjoy designing. Chart financial growth decrease vectors Set of Finance Flat Icons. Flat icons related to financial transactions pertaining to business or personal both. Very well crafted finance icons set to be used in related projects. Grab this pack and enjoy designing
Free with trial A graph with a red arrow pointing upward. The graph is orange and blue. The graph is a representation of a trend or growth. Chart financial growth decrease vectors A graph with a red arrow pointing upward
Free with trial A worrying business report showing a sharp decline, generated by AI, rests on a wooden desk in an office setting. The red graph line dramatically falls, symbolizing potential losses or market downturn. This AI-generated image is perfect for illustrating financial instability or economic crisis. Chart financial growth decrease illustrations Declining Business Graph. A worrying business report showing a sharp decline, generated by AI, rests on a wooden desk in an office setting. The red graph line dramatically falls, symbolizing potential losses or market downturn. This AI-generated image is perfect for illustrating financial instability or economic crisis.
Free with trial High-Quality Vector Icons. Chart financial growth decrease illustrations Decrease icon vector, filled. High-Quality Vector Icons
Free with trial Downward Trend Financial Graph Illustration. Chart financial growth decrease vectors Downward Trend Financial Graph Illustration
Free with trial Visualize financial concepts with this dynamic illustration showcasing currency exchange rates and market trends. Perfect for business presentations, financial reports, and investment strategies. Showcasing global market volatility and opportunities. Chart financial growth decrease vectors Dollar and Euro currency exchange rate with upward and downward trends. Visualize financial concepts with this dynamic illustration showcasing currency exchange rates and market trends. Perfect for business presentations, financial reports, and investment strategies. Showcasing global market volatility and opportunities
Free with trial 3D illustration of gold bars with a red arrow sloping down, symbolizing financial decrease, and scattered golden coins. Chart financial growth decrease illustrations Gold bars with red arrow and scattered coins. 3D illustration of gold bars with a red arrow sloping down, symbolizing financial decrease, and scattered golden coins
Free with trial This image shows a hand-drawn graph depicting a sharp decline, generated by AI for illustrative purposes. It's a simple yet effective visual representation of negative growth or market downturn, useful for presentations or reports. Chart financial growth decrease illustrations Downward Trend on Whiteboard. This image shows a hand-drawn graph depicting a sharp decline, generated by AI for illustrative purposes. It's a simple yet effective visual representation of negative growth or market downturn, useful for presentations or reports.
Free with trial Business graph is being drawn on a piece of paper with a pencil. Chart financial growth decrease illustrations Pencil drawing business graph on paper with pie chart. Business graph is being drawn on a piece of paper with a pencil
Free with trial A pair of hands gently cradles four small, wooden house models against a backdrop of financial charts and graphs. The image evokes concepts of real estate investment, market analysis, and the security of owning property. The wooden houses symbolize homes and the charts represent market trends, making it suitable for illustrating financial articles, investment advice, or real estate services. Chart financial growth decrease illustrations Real Estate Market Analysis and Investment. A pair of hands gently cradles four small, wooden house models against a backdrop of financial charts and graphs. The image evokes concepts of real estate investment, market analysis, and the security of owning property. The wooden houses symbolize homes and the charts represent market trends, making it suitable for illustrating financial articles, investment advice, or real estate services.
Free with trial This 3D bar graph, generated by AI, visually represents a significant downward trend. The red bars show a decrease in value over time, culminating in a sharp drop indicated by the prominent red arrow. This image is ideal for illustrating economic downturns, market crashes, or any scenario depicting. Chart financial growth decrease illustrations Declining Bar Graph. This 3D bar graph, generated by AI, visually represents a significant downward trend. The red bars show a decrease in value over time, culminating in a sharp drop indicated by the prominent red arrow. This image is ideal for illustrating economic downturns, market crashes, or any scenario depicting
Free with trial A turquoise moon hovers above a stock market graph with rising and falling arrows indicating market trends, useful for illustrating financial concepts. Chart financial growth decrease illustrations Stock Market Graph with Moon and Arrow Trends. A turquoise moon hovers above a stock market graph with rising and falling arrows indicating market trends, useful for illustrating financial concepts
Free with trial Bear money down graph stock market concept Vector bull with Red arrow stock price decrease. Chart financial growth decrease vectors Bear money up graph stock market concept Vector. bear money down graph stock market concept Vector bull with Red arrow stock price decrease
Free with trial A vibrant and modern illustration showcasing various data visualization elements. The image features a collection of charts, graphs, and diagrams, including line graphs, bar graphs, pie charts, and circular diagrams, all rendered in a colorful and abstract style. The design incorporates gradients and geometric shapes, suggesting growth, analysis, and business concepts. Ideal for presentations, reports, websites, and marketing materials related to finance, economics, and data analysis. Chart financial growth decrease illustrations Abstract Data Visualization and Business Charts. A vibrant and modern illustration showcasing various data visualization elements. The image features a collection of charts, graphs, and diagrams, including line graphs, bar graphs, pie charts, and circular diagrams, all rendered in a colorful and abstract style. The design incorporates gradients and geometric shapes, suggesting growth, analysis, and business concepts. Ideal for presentations, reports, websites, and marketing materials related to finance, economics, and data analysis.
Free with trial Hand holding coin with arrows symbolizing increasing and decreasing value. Suitable for financial growth concepts in presentations, articles, and ads. Chart financial growth decrease vectors Hand holding coin with arrows symbolizing increasing and decreasing value
Free with trial Abstract 3D rendering of a golden bar graph, depicting data fluctuations Represents growth and market trends. Chart financial growth decrease illustrations Golden Data Visualization. AI Generated. Abstract 3D rendering of a golden bar graph, depicting data fluctuations Represents growth and market trends
Free with trial , Applied for Info Graphics, Design Elements, Websites, Presentations, and Application - Vector. Chart financial growth decrease illustrations Decrease Icon. Down Symbol within Glyph Style - Vector. , Applied for Info Graphics, Design Elements, Websites, Presentations, and Application - Vector.
Free with trial Abstract graphic showing currency symbols and arrows to visually represent financial market changes and exchange rate fluctuations Ideal for illustrating finance topics. Chart financial growth decrease illustrations Currency Exchange Rate Fluctuations Abstract Graphic. Abstract graphic showing currency symbols and arrows to visually represent financial market changes and exchange rate fluctuations Ideal for illustrating finance topics
Free with trial A 3D rendering shows a red, downward-trending graph on a tablet screen, illustrating a market decline. The image, generated by AI, vividly represents financial loss and market instability. This visualization is ideal for illustrating economic trends and analysis. Chart financial growth decrease illustrations AI-Generated Market Decline Visualization. A 3D rendering shows a red, downward-trending graph on a tablet screen, illustrating a market decline. The image, generated by AI, vividly represents financial loss and market instability. This visualization is ideal for illustrating economic trends and analysis.
Free with trial A blackboard with a graph on it and a potted plant next to it. The graph shows a downward trend, which could represent a decrease in sales or a decline in a particular stock. Chart financial growth decrease illustrations A blackboard with a graph on it and a potted plant next to it
Free with trial Financial crisis business market. Currency risk. White background with 3D red button for global inflation concept. Chart financial growth decrease illustrations 3D illustration of red button switching on global inflation. Financial crisis business market. Currency risk. White background with 3D red button for global inflation concept.
Free with trial A businessman in a suit draws a red downward trend line over a bar graph, illustrating cost reduction and financial decline. Chart financial growth decrease illustrations Businessman Drawing a Downward Trend Line on a Cost Graph. A businessman in a suit draws a red downward trend line over a bar graph, illustrating cost reduction and financial decline
Free with trial A striking red arrow points downward over white bars, indicating a significant decrease. Chart financial growth decrease illustrations Red arrow falls over white bars indicating growth decline. A striking red arrow points downward over white bars, indicating a significant decrease
Free with trial Two bar charts, one green showing growth and one red showing decline, with trend lines and arrows. Chart financial growth decrease illustrations Bar charts showing upward and downward trends. Two bar charts, one green showing growth and one red showing decline, with trend lines and arrows
Free with trial Stacks of gold and silver coins are arranged on a light gray surface. A metallic silver arrow, forming an upward trend graph, emerges from the center of the composition, pointing upwards and to the right. The coins have ribbed edges and reflect light, creating a sense of value and financial movement. Chart financial growth decrease illustrations Gold and silver coins with upward trend arrow gold coins. Stacks of gold and silver coins are arranged on a light gray surface. A metallic silver arrow, forming an upward trend graph, emerges from the center of the composition, pointing upwards and to the right. The coins have ribbed edges and reflect light, creating a sense of value and financial movement
Free with trial A 3D figure sits on a platform reviewing financial data, using a laptop to analyze bar graphs, pie charts and line graphs representing business performance and growth. Chart financial growth decrease illustrations 3D Character Analyzing Business Charts and Graphs on Laptop. A 3D figure sits on a platform reviewing financial data, using a laptop to analyze bar graphs, pie charts and line graphs representing business performance and growth.
Free with trial Profit and loss concept. Businessmen run with briefcases on the upward growth and downward recession charts. Chart financial growth decrease vectors Profit and loss concept. Businessmen run on the up and down arrows. Profit and loss concept. Businessmen run with briefcases on the upward growth and downward recession charts
Free with trial A grid of black icons representing various types of graphs and charts, including bar graphs and line graphs with upward arrows, on a white background. Chart financial growth decrease vectors Collection of Ai-Generated black and white graph and chart icons. A grid of black icons representing various types of graphs and charts, including bar graphs and line graphs with upward arrows, on a white background
Free with trial A hand manipulates a red arrow pointing downwards, superimposed on a bar graph, illustrating a market downturn. This image, generated by AI, symbolizes economic recession, financial crisis, or business failure, showcasing the impact of negative trends. Chart financial growth decrease illustrations Declining Market Trend. A hand manipulates a red arrow pointing downwards, superimposed on a bar graph, illustrating a market downturn. This image, generated by AI, symbolizes economic recession, financial crisis, or business failure, showcasing the impact of negative trends.
Free with trial A 3D bar graph with a red line graph indicating a significant decrease, isolated on a clean white background. Chart financial growth decrease illustrations Bar graph showing downward trend isolated on white background. A 3D bar graph with a red line graph indicating a significant decrease, isolated on a clean white background