Free with trial Vietnam business economy growth country with map and finance condition - vector illustration. Chart financial growth decrease illustrations Vietnam business economy growth country with map and finance condition - vector illustration
Free with trial Minimalist vector icons illustrating financial growth, savings, ice cream treat, and energy efficiency. Ideal for business presentations, infographics, and educational materials on economics or sustainability. Chart financial growth decrease vectors Flat design icons for financial trends and energy consumption concepts. Minimalist vector icons illustrating financial growth, savings, ice cream treat, and energy efficiency. Ideal for business presentations, infographics, and educational materials on economics or sustainability
Free with trial Bitcoin and chart bull run icon, cryptocurrency background money vector. Chart financial growth decrease vectors Bitcoin and chart bull run icon, cryptocurrency background money
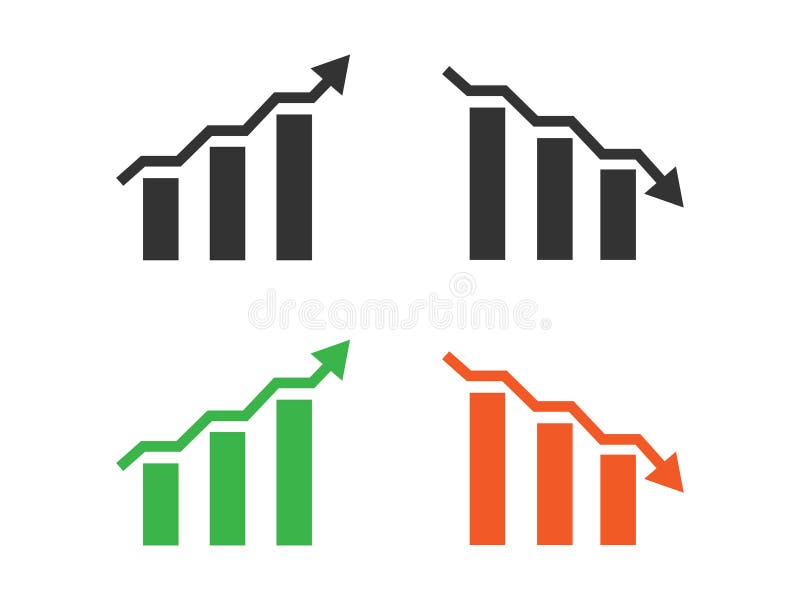
Free with trial Graph chart going up and down sign arrows flat design vector illustration on white background. Chart financial growth decrease vectors Graph chart going up and down sign arrows flat design vector illustration
Free with trial Blue bar chart illustrating financial decline with downward red arrow pointing to green dollar sign, isolated. Chart financial growth decrease illustrations Business graph showing decreasing performance with red arrow and dollar. Blue bar chart illustrating financial decline with downward red arrow pointing to green dollar sign, isolated
Free with trial Euro and chart, price increase, bullran icon, background money vector. Chart financial growth decrease vectors Euro and chart, price increase, bullran icon, background money
Free with trial A detailed financial analysis scene featuring a whiteboard calculator, a magnifying glass hovering over pie charts, and gold coins scattered on documents with bar graphs. This overhead shot on a wooden desk conveys concepts of auditing, investment, and financial planning. This image was generated with the assistance of artificial intelligence. Chart financial growth decrease illustrations Financial Analysis Calculator, Magnifying Glass, Charts, and Coins on Desk. A detailed financial analysis scene featuring a whiteboard calculator, a magnifying glass hovering over pie charts, and gold coins scattered on documents with bar graphs. This overhead shot on a wooden desk conveys concepts of auditing, investment, and financial planning.This image was generated with the assistance of artificial intelligence.
Free with trial A clean, minimalist smartphone app interface displays a spending tracker. A bar graph shows spending increase, highlighting financial growth. The design is black and white, emphasizing data clarity. Chart financial growth decrease illustrations Smartphone App UI: Minimalist Black & White Spending Tracker with Rising Graph. A clean, minimalist smartphone app interface displays a spending tracker. A bar graph shows spending increase, highlighting financial growth. The design is black and white, emphasizing data clarity
Free with trial Falling red arrow illustrating financial downturn on dark grid statistics decline Can be used as a banner or header image. Chart financial growth decrease illustrations Falling red arrow illustrating financial downturn on dark grid , statistics, decline. Falling red arrow illustrating financial downturn on dark grid statistics decline Can be used as a banner or header image
Free with trial Indonesia business economy growth country with map and finance condition - vector illustration. Chart financial growth decrease illustrations Indonesia business economy growth country with map and finance condition - vector illustration
Free with trial A blue zig zag line represents a stock market graph that rises and falls. It is placed upon a financial square grid of many small blocks with color changing from red to blue. Chart financial growth decrease illustrations Stock Market Graph Showing Trending Line on Financial Grid During Daytime. A blue zig zag line represents a stock market graph that rises and falls. It is placed upon a financial square grid of many small blocks with color changing from red to blue.
Free with trial Marketing. A vibrant and modern bar graph with glowing neon colors represents data and business growth. Chart financial growth decrease illustrations Glowing Bar Graph Data Visualization, Business Growth, Statistics, marketing. marketing. A vibrant and modern bar graph with glowing neon colors represents data and business growth.
Free with trial This abstract digital artwork features a blue and gray bar graph with data points highlighting growth trends on a dark background, ideal for business and analytics themes Generative AI. Chart financial growth decrease illustrations Blue and Gray Bar Graph with Data Points Representing Growth Trends and Statistical Analysis in Digital Format on Dark Background. This abstract digital artwork features a blue and gray bar graph with data points highlighting growth trends on a dark background, ideal for business and analytics themes Generative AI
Free with trial Bitcoin with red arrow down and bitcoin with green growth arrow. Falling and growing price of cryptocurrency, concept. 3D rendering isolated on white background. Chart financial growth decrease illustrations Bitcoin with red arrow down and bitcoin with green growth arrow. Falling and growing price of cryptocurrency, concept. 3D
Free with trial This is an detailed collection of line icons depicting market fluctuations, financial downturns, recovery patterns, and technical analysis indicators. Chart financial growth decrease vectors Market volatility and financial loss icons with bull and bear market cycle symbols. This is an detailed collection of line icons depicting market fluctuations, financial downturns, recovery patterns, and technical analysis indicators
Free with trial Finance concept with blue arrows pointing down and plus symbol representing decrease and increase in business finance abstract symbols. Chart financial growth decrease vectors Blue 3d arrows down and plus symbol showing growth down and increase finance concept. Finance concept with blue arrows pointing down and plus symbol representing decrease and increase in business finance abstract symbols
Free with trial A green bar chart profit with an upward arrow, while a red bar chart loss with a downward arrow, presented on a white background. Chart financial growth decrease illustrations Representation of profit and loss with ascending green bar chart and descending red bar chart on a white background. A green bar chart profit with an upward arrow, while a red bar chart loss with a downward arrow, presented on a white background
Free with trial Financial concept illustration with arrows pointing towards and away from bag. Chart financial growth decrease vectors Financial concept illustration with arrows pointing towards and away from bag
Free with trial Percent growth and decline icon. Percentage arrow up and down sign symbol vector. Chart financial growth decrease vectors Percent growth and decline icon. Percentage arrow up and down sign symbol
Free with trial Vibrant Business Data Visualization Highlighting Market Trends and Financial Metrics. Generative AI. Chart financial growth decrease illustrations Vibrant Business Data Visualization Highlighting Market Trends and Financial Metrics
Free with trial Economics financial management concept - people team work group joins gear mechanism with money symbol dollar inside main cog wheel - vector illustration. Chart financial growth decrease vectors Economics financial management concept
Free with trial Economic recession, financial crisis or stock market crash concept with worried businessman investor or business owner. Red down arrow. Vector illustration. Chart financial growth decrease vectors Economic recession, financial crisis
Free with trial Colorful bar graph showing market growth and success over time. Chart financial growth decrease vectors Colorful bar graph showing market growth and success
Free with trial Two gleaming gold bars sit atop a financial chart showing a downward trend, suggesting investment strategy. Chart financial growth decrease illustrations Gold Bars Resting on a Decreasing Market Graph. Two gleaming gold bars sit atop a financial chart showing a downward trend, suggesting investment strategy
Free with trial Financial Report with Charts and Graphs on Clipboard, Business Data Analysis. Generative AI. Chart financial growth decrease illustrations Financial Report with Charts and Graphs on Clipboard Business Data Analysis. Financial Report with Charts and Graphs on Clipboard, Business Data Analysis. Generative AI
Free with trial A businessman examines a declining cost graph on a laptop, indicating financial analysis and planning Generative AI. Chart financial growth decrease illustrations Businessman analyzing cost graph on laptop with financial data visualization. A businessman examines a declining cost graph on a laptop, indicating financial analysis and planning Generative AI
Free with trial A 3D rendered bar graph displays a series of six distinct bars, arranged in descending order of height from left to right. The bars are colored in a gradient from blue to orange, resting on a white, slightly angled platform. A subtle shadow is cast to the left, emphasizing the three-dimensional nature of the graphic. The visual represents a downward trend or decrease in data. Chart financial growth decrease illustrations 3D rendered bar graph showing a downward trend with colorful bars on a white platform chart statistics. A 3D rendered bar graph displays a series of six distinct bars, arranged in descending order of height from left to right. The bars are colored in a gradient from blue to orange, resting on a white, slightly angled platform. A subtle shadow is cast to the left, emphasizing the three-dimensional nature of the graphic. The visual represents a downward trend or decrease in data
Free with trial Percent arrow down and up icon. Percentage decline and growth sign symbol vector. Chart financial growth decrease vectors Percent arrow down and up icon. Percentage decline and growth sign symbol
Free with trial Euro and chart, price increase, bullran icon, background money, blank template raster template. Chart financial growth decrease vectors Euro and chart, price increase, bullran icon, background money, blank template raster
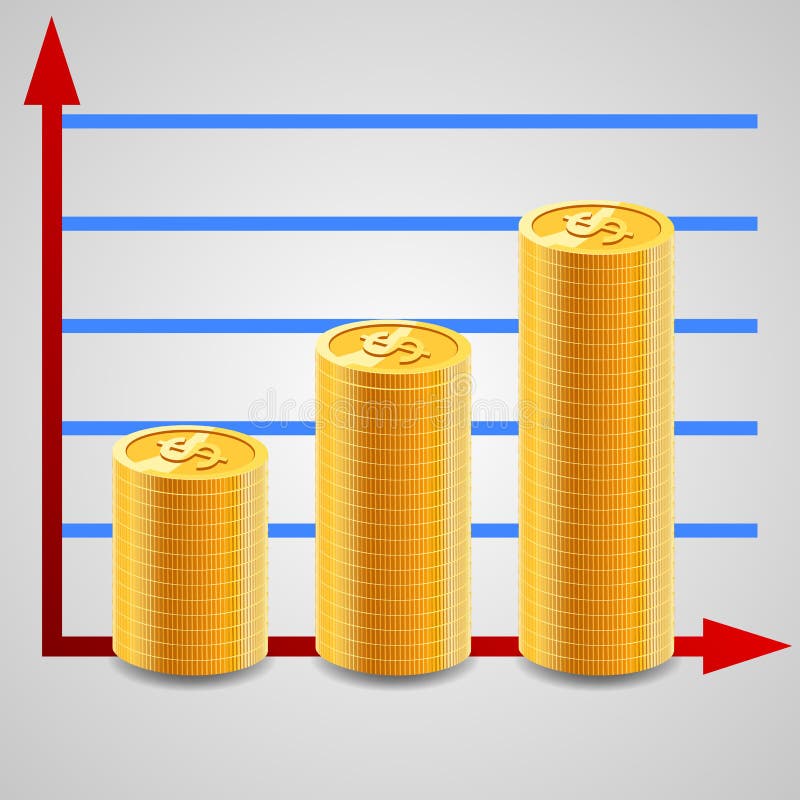
Free with trial Increasing piles of coins with going up graph. Concept for financial growth. illustration. Chart financial growth decrease vectors Increasing piles of coins with going up graph.
Free with trial Crypto Currency market panic sell concept. Double exposure of digital coins price drop and technical chart. Both in red color theme to indicate bearish stage. Chart financial growth decrease illustrations Crypto Currency market panic sell concept. Double exposure of digital coins price drop and technical chart.
Free with trial Abstract background vector of blue decreasing Economic growth or GDP. Chart financial growth decrease vectors Background vector of blue decreasing Economic growth or GDP
Free with trial Businessman on falling down chart. Cartoon character thin line style vector. Chart financial growth decrease vectors Businessman on falling down chart. Cartoon character thin line style.
Free with trial A 3D rendering of a vibrant red arrow pointing upwards and a bright green arrow pointing downwards, representing market fluctuations, economic changes, and data trends. Chart financial growth decrease illustrations Red up arrow and green down arrow symbolizing financial market trends growth decline. A 3D rendering of a vibrant red arrow pointing upwards and a bright green arrow pointing downwards, representing market fluctuations, economic changes, and data trends
Free with trial A man's hand holds a glowing blue bar graph with a white arrow pointing down indicating cost reduction. Chart financial growth decrease illustrations Man holding glowing cost reduction graph with downward arrow chart financial 1. A man's hand holds a glowing blue bar graph with a white arrow pointing down indicating cost reduction
Free with trial A red graph with a downward trend, indicating a decline or decrease, set against a grid background with a prominent red arrow pointing downwards, symbolizing a significant drop or loss. Chart financial growth decrease illustrations Financial downturn indicated by red graph and downward arrow on grid background. A red graph with a downward trend, indicating a decline or decrease, set against a grid background with a prominent red arrow pointing downwards, symbolizing a significant drop or loss
Free with trial Financial graph depicting declining trends with stock market data in blue and black lines, on a white background. Concept of financial downturn. 3D Rendering. Chart financial growth decrease illustrations Financial graph with declining trends and stock market data on white background. 3D Rendering. Financial graph depicting declining trends with stock market data in blue and black lines, on a white background. Concept of financial downturn. 3D Rendering
Free with trial Glitch green matrix symbols with decrease red trade graph. Chart financial growth decrease illustrations Glitch green matrix symbols with decrease trade graph
Free with trial Visualize cost reduction with a downward trending graph held in a hand. Illustrates finance, business strategy, and expense management. Shows efficiency and financial planning concepts. Chart financial growth decrease illustrations Cost reduction strategy business finance graph chart decreasing costs expense management efficiency concept. Visualize cost reduction with a downward trending graph held in a hand. Illustrates finance, business strategy, and expense management. Shows efficiency and financial planning concepts.
Free with trial Black downward arrow and percentage symbol on a white background representing decrease. Chart financial growth decrease illustrations Black downward arrow and percentage symbol on white background decrease reduction. Black downward arrow and percentage symbol on a white background representing decrease
Free with trial Illustration of a dollar symbol surrounded by arrows showing financial movement, investment, and economic flow. Chart financial growth decrease vectors Financial Flow: Dollar Symbol with Arrows Indicating Money Movement and Investment. Illustration of a dollar symbol surrounded by arrows showing financial movement, investment, and economic flow.
Free with trial Stacks of golden coins arranged in a descending order on a light background, illustrating concepts of financial loss, economic downturn, and decreasing value. Chart financial growth decrease illustrations Decreasing stacks of golden coins symbolizing financial decline and economic loss. Stacks of golden coins arranged in a descending order on a light background, illustrating concepts of financial loss, economic downturn, and decreasing value
Free with trial A 3D png of a red jagged arrow pointing downwards. This graphic represents a decline in stock markets, financial loss, economic recession, or a negative business trend, isolated on a white background. Chart financial growth decrease vectors Red downward trend arrow financial crisis concept isolated on transparent background. A 3D png of a red jagged arrow pointing downwards. This graphic represents a decline in stock markets, financial loss, economic recession, or a negative business trend, isolated on a white background.
Free with trial Illustration features worried blocks stacked with a data chart and arrows pointing up and down, in a flat, graphic style. Chart financial growth decrease vectors Worried blocks stacked with data chart and arrows depicting volatile market conditions or economic uncertainty. Illustration features worried blocks stacked with a data chart and arrows pointing up and down, in a flat, graphic style.
Free with trial Cac cost acquisition is represented by wooden blocks and stacks of coins showing decreasing investment and financial return on marketing strategy business planning and customer acquisition for sales. Chart financial growth decrease illustrations Cac cost acquisition marketing business finance investment strategy return growth analysis budget advertising customer sales reven. Cac cost acquisition is represented by wooden blocks and stacks of coins showing decreasing investment and financial return on marketing strategy business planning and customer acquisition for sales
Free with trial This conceptual studio photograph shows coins stacked in an increasing bar chart format with upward and downward arrows, ideal for illustrating financial reports, banking services, and investment risks. Chart financial growth decrease illustrations Silver coin stacks with green and red arrows showing market volatility studio photo. This conceptual studio photograph shows coins stacked in an increasing bar chart format with upward and downward arrows, ideal for illustrating financial reports, banking services, and investment risks
Free with trial A conceptual shot of a businessman pointing at a glowing green arrow that indicates risk reduction the arrow has the word risk written on it to further emphasize the concept of risk management strategy planning success investment return profitability market analysis and economic factors for sustainable business growth and development highlighting the importance of careful planning and strategic. Chart financial growth decrease illustrations Risk Management Strategy for Business Growth and Success with Green Arrow Pointing Downwards Showing Reduced Risk. A conceptual shot of a businessman pointing at a glowing green arrow that indicates risk reduction the arrow has the word risk written on it to further emphasize the concept of risk management strategy planning success investment return profitability market analysis and economic factors for sustainable business growth and development highlighting the importance of careful planning and strategic
Free with trial Analyzing Data: Person Presenting Graph Showing Progress and Growth Pointing to Top Data Peak, Achievement Concept. Chart financial growth decrease illustrations Analyzing Data: Person Presenting Graph Showing Progress and Growth Pointing to Top Data Peak, Achievement Concept
Free with trial A 3D bar chart made of red and blue cubes arranged in ascending and descending steps against a white background. Chart financial growth decrease illustrations 3D Red and Blue Cubes Arranged in Ascending Bar Chart Formation on White graph data. A 3D bar chart made of red and blue cubes arranged in ascending and descending steps against a white background
Free with trial The image shows a financial dashboard with a stock price chart, a significant upward trend arrow, and various metrics. The chart indicates a stock price of 1,219 with. Chart financial growth decrease illustrations Financial dashboard displaying stock market performance with upward trend indicator. The image shows a financial dashboard with a stock price chart, a significant upward trend arrow, and various metrics. The chart indicates a stock price of 1,219 with
Free with trial A digital dashboard displaying financial data and market analytics on a desk with potted plants and greenery accents showcasing a modern technology driven workspace for business economics. Chart financial growth decrease illustrations Financial Data Analytics Display with Greenery Accents on Office Desk. A digital dashboard displaying financial data and market analytics on a desk with potted plants and greenery accents showcasing a modern technology driven workspace for business economics
Free with trial Percent down and up icon in trendy style. Percentage downward and upward arrow sign. Decline and growth symbol vector. Chart financial growth decrease vectors Percent down and up icon in trendy style. Percentage downward and upward arrow sign. Decline and growth symbol
Free with trial Close up of businessman hand touching a falling arrow and bar chart. Business Loss and Risk Management. Chart financial growth decrease illustrations Close up of businessman hand touching a falling arrow and bar chart. Business Loss and Risk Management.
Free with trial A collection of financial icons is presented in a 3D render on a white background. A large blue dollar sign is on the left. To its right, a green upward arrow and a red downward arrow intersect, with a purple coin featuring a white dollar sign in the center. On the far right, a white smartphone displays a yellow coin with a white dollar sign on its screen. Chart financial growth decrease illustrations Financial Icons: Dollar Sign, Up and Down Arrows, Coin, and Smartphone on White Background. A collection of financial icons is presented in a 3D render on a white background. A large blue dollar sign is on the left. To its right, a green upward arrow and a red downward arrow intersect, with a purple coin featuring a white dollar sign in the center. On the far right, a white smartphone displays a yellow coin with a white dollar sign on its screen
Free with trial A downward trending bar graph in shades of blue, illustrating a financial decline with sleek, minimalistic lines and a clear visual impact. Generative AI. Chart financial growth decrease vectors Downward trending bar graph in flat design style showcasing financial decline vector illustration. A downward trending bar graph in shades of blue, illustrating a financial decline with sleek, minimalistic lines and a clear visual impact. Generative AI
Free with trial A white rectangular featuring a bar chart with blue and gray bars and a line graph with blue and gray lines. Upward and downward arrows with horizontal bars are positioned to the right of the. Chart financial growth decrease illustrations Blue and gray bar chart with upward and downward arrows on a white background line graph. A white rectangular featuring a bar chart with blue and gray bars and a line graph with blue and gray lines. Upward and downward arrows with horizontal bars are positioned to the right of the
Free with trial Minimalist bar chart created with natural wooden blocks, symbolizing data, financial trends, market fluctuations, and business analysis on a white surface. Chart financial growth decrease illustrations Wooden blocks bar chart illustrating business data progression on a white background. Minimalist bar chart created with natural wooden blocks, symbolizing data, financial trends, market fluctuations, and business analysis on a white surface.
Free with trial A chart with a growing trend. Financial Flat vector illustration isolated on white background. Chart financial growth decrease illustrations A graph with a dollar sign. A chart with a growing trend. Financial Flat vector illustration isolated on white background.
Free with trial Broken bitcoin symbol with statistics chart showing various visualization graphs going down. Cryptocurrency falling crisis concept. Chart financial growth decrease vectors Broken bitcoin symbol with statistics chart showing various visu
Free with trial Set of vector chart and graph icons for infographic. Thin line diagrams for business report or presentation. Chart financial growth decrease vectors Set of vector chart
Free with trial The image displays two contrasting zigzag arrows, one green ascending arrow and one red descending arrow, symbolizing opposing trends or market movements. The green arrow indicates growth, increase, or positive progression, while the red arrow signifies decline, decrease, or negative progression. This visual is often used in financial contexts to represent bullish and bearish market trends,. Chart financial growth decrease illustrations Contrasting upward and downward zigzag arrows representing market or trend fluctuations. The image displays two contrasting zigzag arrows, one green ascending arrow and one red descending arrow, symbolizing opposing trends or market movements. The green arrow indicates growth, increase, or positive progression, while the red arrow signifies decline, decrease, or negative progression. This visual is often used in financial contexts to represent bullish and bearish market trends,
Free with trial Negative growth graph with white 3d pillars on grid floor against blue background for market trend analysis. Chart financial growth decrease illustrations Business bar chart with declining red arrow showing financial loss and economic recession. Negative growth graph with white 3d pillars on grid floor against blue background for market trend analysis
Free with trial A businessman looking at financial charts on screen, dark background, cinematic lighting, success concept. Chart financial growth decrease illustrations A businessman looking at financial charts on screen, dark background, cinematic lighting, success concept
Free with trial Economic recession, financial crisis or stock market crash concept with worried businessman investor or business owner. Red down arrow. Vector illustration. Chart financial growth decrease vectors Economic recession, financial crisis or stock market crash
Free with trial Economic recession, financial crisis or stock market crash concept with worried businessman investor or business owner. Red down arrow. Vector illustration. Chart financial growth decrease vectors Economic recession, financial crisis or stock market crash
Free with trial An illustration of a bar graph showing a decline with descending arrow indicating business downturn and financial loss using flat style. Chart financial growth decrease vectors Financial decline graph with a descending arrow showing losses and market downturns. An illustration of a bar graph showing a decline with descending arrow indicating business downturn and financial loss using flat style
Free with trial A close-up shot reveals a vibrant red line graph sharply declining on a dark blue screen depicting a negative trend in the stock market The image represents financial loss investment risk and market downturn Ideal for illustrating economic instability. Chart financial growth decrease illustrations Close up Red Stock Market Graph Showing Decline Financial Loss Investment Risk AI generated. A close-up shot reveals a vibrant red line graph sharply declining on a dark blue screen depicting a negative trend in the stock market The image represents financial loss investment risk and market downturn Ideal for illustrating economic instability
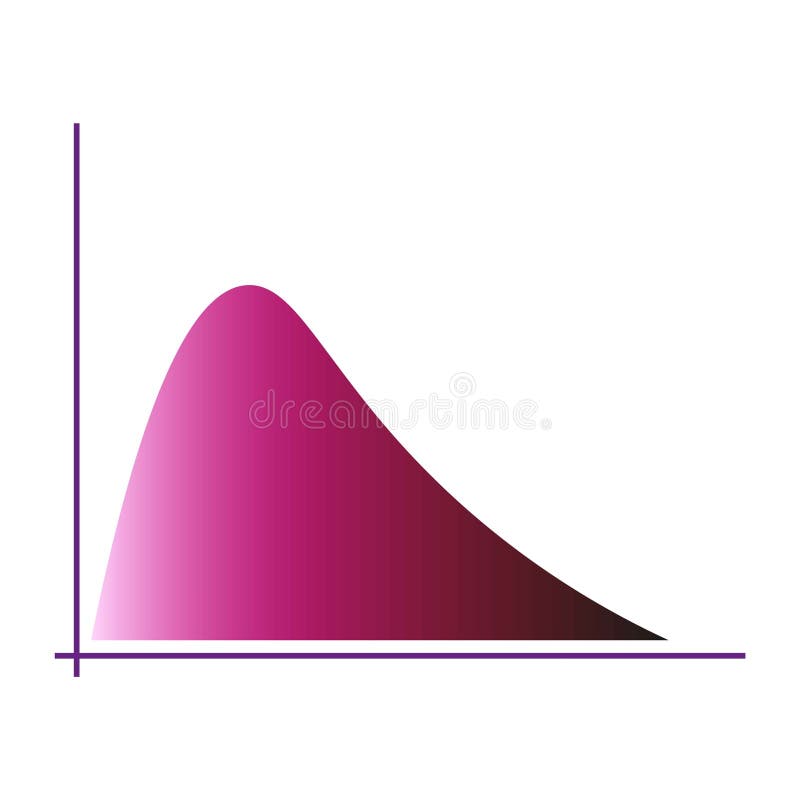
Free with trial Gradient curve chart. Pink color distribution. Graphical data visualization. Modern vector graphic. EPS 10. Chart financial growth decrease vectors Gradient curve chart. Pink color distribution. Graphical data visualization. Modern vector graphic.
Free with trial A 3D rendered blue arrow pointing downwards is adorned with a pink circular tag featuring a white percentage symbol. The graphic is isolated on a clean white background, symbolizing a decrease or reduction. Chart financial growth decrease illustrations Blue downward arrow with a pink percentage symbol tag on a white background decrease decline. A 3D rendered blue arrow pointing downwards is adorned with a pink circular tag featuring a white percentage symbol. The graphic is isolated on a clean white background, symbolizing a decrease or reduction
Free with trial Three prominent green downward-pointing arrows each bearing a percentage symbol represent a decrease in financial values or rates. This visual depicts economic decline or reduction effectively. Chart financial growth decrease illustrations Green percentage down arrows symbolizing declining rates finance business growth reduction. Three prominent green downward-pointing arrows each bearing a percentage symbol represent a decrease in financial values or rates. This visual depicts economic decline or reduction effectively
Free with trial Minimalist 3D bar chart with colorful pastel blocks representing data on a clean white background. Chart financial growth decrease illustrations Minimalist 3D bar chart with colorful pastel blocks representing data on a clean white background
Free with trial A dynamic visual representation showcases interest rate volatility, featuring fluctuating lines, percentage symbols, and financial data analysis. The display creates a sense of market flux and economic shifts. Ideal for illustrating financial news, investment strategies, economic forecasts, and mark. Chart financial growth decrease illustrations Interest Rate Volatility Display Showing Financial Data Trends and Fluctuations for Market Analysis. A dynamic visual representation showcases interest rate volatility, featuring fluctuating lines, percentage symbols, and financial data analysis. The display creates a sense of market flux and economic shifts. Ideal for illustrating financial news, investment strategies, economic forecasts, and mark
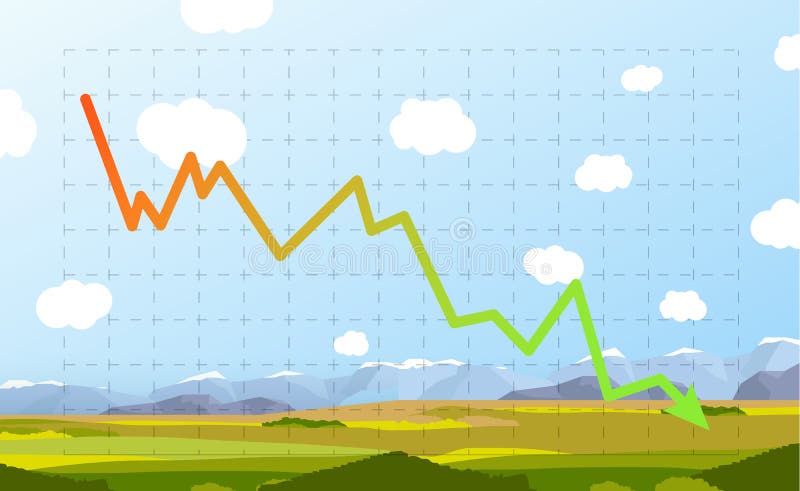
Free with trial Bright green and red decrease stocks graph on sunny nature landscape. Chart financial growth decrease vectors Green and red decrease stocks graph on sunny nature landscape
Free with trial Abstract financial trading graph with candlestick charts and data analysis on a dark background. Chart financial growth decrease illustrations Abstract financial trading graph with candlestick charts and data analysis on a dark background
Free with trial Red graphic arrows pointing up and a black arrow shows decrease on white background. Financial chart. From high to low. 3D illustration. Chart financial growth decrease illustrations Red graphic arrows pointing up and a black arrow shows decrease
Free with trial Stacked cubes with red arrow down symbols showing step by step decreasing trend and negative growth. Generative AI. Chart financial growth decrease illustrations Stacked cubes with red arrow down symbols showing step by step decreasing trend and negative growth
Free with trial A laptop screen shows a sales funnel chart with declining percentages positioned next to a notebook mug and plant on a desk. Chart financial growth decrease illustrations Laptop displaying sales funnel chart with decreasing percentages beside notebook mug and plant. A laptop screen shows a sales funnel chart with declining percentages positioned next to a notebook mug and plant on a desk
Free with trial Economy growth graph down vector icon illustration. Chart financial growth decrease vectors Economy growth graph down icon design. economy growth graph down vector icon illustration