Free with trial Wheat seed crop grain price goes down drop decrease cheap in global commodity market trade export transaction vector. Chart financial growth decrease vectors Wheat seed crop grain price goes down drop decrease cheap in global commodity market trade export transaction
Free with trial Colorful flat icons depicting piggy banks, financial charts, calendars, and home representing savings, investments, and financial planning. Chart financial growth decrease illustrations Colorful flat icons depicting piggy banks, financial charts, cal
Free with trial A black shopping basket icon displays various financial charts and graphs in blue and green, indicating business analytics. Chart financial growth decrease illustrations Shopping basket icon with financial charts and graphs on white background cart retail. A black shopping basket icon displays various financial charts and graphs in blue and green, indicating business analytics
Free with trial A 3D rendered bar chart illustrates a decreasing trend. The bars, colored in a gradient from yellow to purple, represent data points that are diminishing in value. Placed on a simple gray base, the chart is isolated against a white background. This image is suitable for illustrating concepts related to business, finance, statistics, and economic downturns. Chart financial growth decrease illustrations 3D Bar Chart Decreasing Trend. A 3D rendered bar chart illustrates a decreasing trend. The bars, colored in a gradient from yellow to purple, represent data points that are diminishing in value. Placed on a simple gray base, the chart is isolated against a white background. This image is suitable for illustrating concepts related to business, finance, statistics, and economic downturns.
Free with trial Blue Glass 3D Bar Chart Showing Data Decline. Chart financial growth decrease illustrations Blue Glass 3D Bar Chart Showing Data Decline
Free with trial This image features a bold 2. 29% percentage symbol in metallic blue on a black background, ideal for financial presentations and business reports. Chart financial growth decrease illustrations Metallic Blue Percentage Symbol 229 on Black Background for Financial and Business Concepts. This image features a bold 2.29% percentage symbol in metallic blue on a black background, ideal for financial presentations and business reports
Free with trial An isometric 3D bar chart composed of blue, gray, and orange blocks of varying heights is arranged on a white background. Chart financial growth decrease illustrations Isometric 3D bar chart with blue, gray, and orange blocks on a white background graph data. An isometric 3D bar chart composed of blue, gray, and orange blocks of varying heights is arranged on a white background
Free with trial A hand holds a glowing blue bar graph with a downward trending arrow and the word COST above. Chart financial growth decrease illustrations Man holding glowing cost reduction graph with downward arrow chart financial. A hand holds a glowing blue bar graph with a downward trending arrow and the word COST above
Free with trial Cost of euro with arrow down and up. Coin of euro with loss or growth. Increase and low of revenue. Economy crisis or economy growth. Icon of exchange of currency. Vector. Chart financial growth decrease vectors Cost of euro with arrow down and up. Coin of euro with loss or growth. Increase and low of revenue. Economy crisis or economy
Free with trial Simple Chart graph diagram bar histograms. Chart financial growth decrease vectors Chart graph diagram bar histograms
Free with trial Simple Chart graph diagram bar histograms. Chart financial growth decrease vectors Chart graph diagram bar histograms
Free with trial Simple Chart graph diagram bar histograms. Chart financial growth decrease vectors Chart graph diagram bar histograms
Free with trial Simple Chart graph diagram bar histograms. Chart financial growth decrease vectors Chart graph diagram bar histograms
Free with trial Economy growth arrow icons on white. Chart financial growth decrease illustrations Economy growth arrow icons
Free with trial Green arrow on financial graph with terrified cartoon face reacting to a sharp downward trend. Concept of market crash or business loss. Chart financial growth decrease illustrations Green arrow on financial graph with terrified cartoon face reacting to a sharp downward trend
Free with trial Germany Stock Exchange market crisis red market price down chart fall / Stock analysis or forex charts graph Business and finance money crisis red negative drop in sales economic fall. Chart financial growth decrease illustrations Germany Stock Exchange market crisis red market price down chart fall Business and finance money crisis red negative drop in sales. Germany Stock Exchange market crisis red market price down chart fall / Stock analysis or forex charts graph Business and finance money crisis red negative drop in sales economic fall
Free with trial Natural gas LPG LNG energy price goes down drop decrease cheap in global commodity market trade export transaction vector. Chart financial growth decrease illustrations Natural gas LPG LNG energy price goes down drop decrease cheap in global commodity market trade export transaction
Free with trial Simple Chart graph diagram bar histograms. Chart financial growth decrease vectors Chart graph diagram bar histograms
Free with trial Simple Chart graph diagram bar histograms. Chart financial growth decrease vectors Chart graph diagram bar histograms
Free with trial A visual representation of a financial downturn, depicted by a bar chart with bars decreasing in height and a prominent red arrow pointing downwards, signifying a negative trend. Chart financial growth decrease illustrations Bar chart with red arrow showing decline isolated on white background. A visual representation of a financial downturn, depicted by a bar chart with bars decreasing in height and a prominent red arrow pointing downwards, signifying a negative trend
Free with trial Downward trending chart with a declining arrow in vector illustration. Chart financial growth decrease vectors Downward trending chart with a declining arrow in vector illustration
Free with trial Red 3d arrow going down stock icon on white background. Bankruptcy, financial market crash icon for your web site design. chart going down sign. 3d rendering. Vector illustration. Chart financial growth decrease vectors 3d arrow going down stock icon
Free with trial Modern and various graph icons, bar chart, pie chart icon for indicating the progress. Chart financial growth decrease vectors Modern and various graph icons, bar chart, pie chart icon
Free with trial A man is pointing at a stock chart with a sell indicator and a downward arrow, indicating a potential downward trend in the market. Chart financial growth decrease vectors Man pointing at sell chart with downward arrow indicator. a man is pointing at a stock chart with a sell indicator and a downward arrow, indicating a potential downward trend in the market.
Free with trial Bar graph displays a colorful representation of business growth and financial success with bars increasing in height and vibrant colors on a reflective surface indicating positive trends. Chart financial growth decrease illustrations Colorful bar graph showing growth and success in business and finance on a reflective surface. Bar graph displays a colorful representation of business growth and financial success with bars increasing in height and vibrant colors on a reflective surface indicating positive trends.
Free with trial Abstract financial trading graph with candlestick charts and data analysis on a dark background. Chart financial growth decrease illustrations Abstract financial trading graph with candlestick charts and data analysis on a dark background
Free with trial A laptop screen displays financial data, illuminated against a blurry background, suggesting analysis. Chart financial growth decrease illustrations Laptop displays dynamic financial data represented in charts and graphs. A laptop screen displays financial data, illuminated against a blurry background, suggesting analysis
Free with trial A golden house miniature sits on a smartphone screen displaying stock market charts, surrounded by stacks of gold coins. This image represents the concept of investing in real estate through mobile apps and online platforms, highlighting the potential for financial growth and digital investment strategies in the property market. Chart financial growth decrease illustrations Real Estate Investment on Mobile. A golden house miniature sits on a smartphone screen displaying stock market charts, surrounded by stacks of gold coins. This image represents the concept of investing in real estate through mobile apps and online platforms, highlighting the potential for financial growth and digital investment strategies in the property market.
Free with trial Bright, colorful stock chart on dark screen. Fluctuations lines and grid representing data and trends. Stock photo. Chart financial growth decrease illustrations Bright, colorful stock chart on dark screen. Fluctuations lines and grid representing data and trends
Free with trial A vibrant collection of hand-drawn business charts and graphs, rendered in blue tones. The set includes various types of visualizations like bar charts, line graphs, and a pie chart, all with a sketchy, illustrative style. These visuals are ideal for presentations, reports, and infographics related to finance, data analysis, growth, and business performance. Chart financial growth decrease illustrations Hand-Drawn Business Charts and Graphs Collection. A vibrant collection of hand-drawn business charts and graphs, rendered in blue tones. The set includes various types of visualizations like bar charts, line graphs, and a pie chart, all with a sketchy, illustrative style. These visuals are ideal for presentations, reports, and infographics related to finance, data analysis, growth, and business performance.
Free with trial Analyze Market Trends on Phone Screen with Desk Details and Financial Analysis , immersive atmosphere. Chart financial growth decrease illustrations Analyze Market Trends on Phone Screen with Desk Details and Financial Analysis
Free with trial A shiny red arrow curves downwards, indicating a downward trend or negative growth. This image visually represents concepts like financial decline market crash or falling stock prices. Chart financial growth decrease illustrations Red arrow points downward showing decline trend and negative growth concept. A shiny red arrow curves downwards, indicating a downward trend or negative growth. This image visually represents concepts like financial decline market crash or falling stock prices
Free with trial A 3D bar chart with a red arrow indicating a significant downward trend, symbolizing financial loss or economic decline. Isolated on a white background. Chart financial growth decrease illustrations Bar chart showing a downward trend isolated on white background. A 3D bar chart with a red arrow indicating a significant downward trend, symbolizing financial loss or economic decline. Isolated on a white background
Free with trial Colorful bar graph with stacked segments illustrating growth and data analysis. Chart financial growth decrease vectors Colorful bar graph with stacked segments illustrating growth and data analysis
Free with trial A cartoon Bitcoin character is presenting a chart showing cryptocurrency market trends. The image is suitable for illustrating financial news, investment advice, or educational materials about Bitcoin and the crypto market. Chart financial growth decrease illustrations Bitcoin Cartoon Character Explaining Crypto Market Trends. A cartoon Bitcoin character is presenting a chart showing cryptocurrency market trends. The image is suitable for illustrating financial news, investment advice, or educational materials about Bitcoin and the crypto market.
Free with trial Sad face beside declining line graph and bar chart, symbolizing setbacks. Ideal for finance, business, economy, loss, analytics, crisis performance. Simple flat metaphor. Chart financial growth decrease vectors Negative Trend Line and Declining Bar Chart Representing Business Loss or Financial Downturn. Sad face beside declining line graph and bar chart, symbolizing setbacks. Ideal for finance, business, economy, loss, analytics, crisis performance. Simple flat metaphor
Free with trial This image depicts a house with a rising stock market graph overlay on a green lawn, symbolizing growth and prosperity in the real estate and financial markets. The graph shows a mix of green and red lines, indicating fluctuations in the market, but overall trending upwards. The image conveys a sense of optimism and hope for the future. Chart financial growth decrease illustrations A house with a rising stock market graph overlay on a green lawn
Free with trial Hand-drawn financial charts, graphs, and calculators perfect for business, finance, and accounting illustrations. These vector illustrations depict various tools used for data analysis and financial calculations. Chart financial growth decrease vectors Collection of Hand Drawn Financial Charts and Calculators. Hand-drawn financial charts, graphs, and calculators perfect for business, finance, and accounting illustrations. These vector illustrations depict various tools used for data analysis and financial calculations.
Free with trial A neon glowing graph with blue bars and pink zigzag arrow showing fluctuating growth on black background. Generative AI. Chart financial growth decrease illustrations Neon glowing graph with blue bars and pink zigzag arrow showing fluctuating growth on black background
Free with trial Graphic element displays contrasting financial indicators featuring a jagged green arrow pointing up signifying growth alongside a similar red arrow pointing sharply down representing decline or market correction. Chart financial growth decrease vectors Graphic representation contrasting upward trending market growth with sharp downward trending financial decline. Graphic element displays contrasting financial indicators featuring a jagged green arrow pointing up signifying growth alongside a similar red arrow pointing sharply down representing decline or market correction
Free with trial A visual representation of financial losses or declining market trends, ideal for economic reports and business analysis presentations. Chart financial growth decrease illustrations Bar chart showing a significant decline, emphasized by a red arrow pointing downwards and a magnifying glass. A visual representation of financial losses or declining market trends, ideal for economic reports and business analysis presentations
Free with trial Falling bar chart with up and right arrows illustrating declining business trends. Chart financial growth decrease vectors Falling bar chart with up and right arrows illustrating declining business trends
Free with trial Businessman hand on head and looks up to a downward trending arrow chart. Chart financial growth decrease illustrations Businessman hand on head and looks up to a downward trending arrow chart
Free with trial Business on falling down chart. Concept business illustration, Fail, Risk, Problem. Chart financial growth decrease illustrations Chart with red down arrow on abstract background. Falling growth in busines. Business on falling down chart. Concept business illustration, Fail, Risk, Problem.
Free with trial Stacks of gold and silver coins in front of a blurred background with a financial graph and percentages. Chart financial growth decrease illustrations Stacks of coins and financial graph with percentages in background finance money. Stacks of gold and silver coins in front of a blurred background with a financial graph and percentages
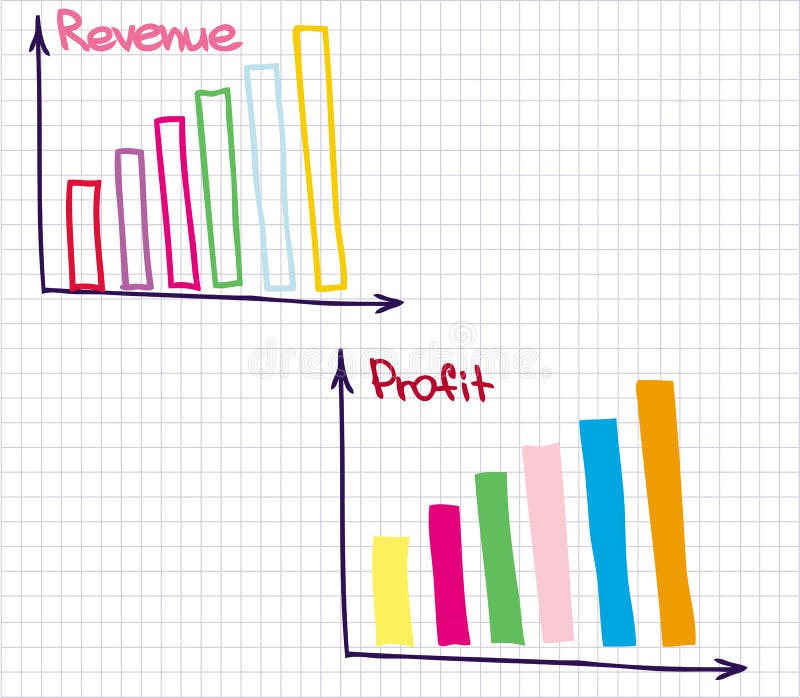
Free with trial Financial chart of revenue and loss. Chart financial growth decrease vectors Profit Revenue Chart. Financial chart of revenue and loss
Free with trial Financial chart of revenue and loss. Chart financial growth decrease vectors Profit Revenue Chart. Financial chart of revenue and loss
Free with trial Red downward arrows symbolize a decline in financial markets or economic downturn. The background features blurred lights, enhancing the dramatic effect. Chart financial growth decrease illustrations Red downward arrows symbolize a decline in financial markets or economic downturn.
Free with trial Five colorful bars, resembling a chart, visually represent a downward trend. The bars are yellow, green, blue and purple. Chart financial growth decrease vectors Colorful bar chart illustration showing declining trend on transparent background. Five colorful bars, resembling a chart, visually represent a downward trend. The bars are yellow, green, blue and purple.
Free with trial Businesswoman On Falling Down Chart. vector. Chart financial growth decrease vectors Businesswoman On Falling Down Chart.
Free with trial A vibrant circular chart displaying a twenty percent decrease with bright colors and clean design, ideal for business, finance, and analytics presentations. Chart financial growth decrease illustrations Colorful Circular Chart with Percentage Reduction in Modern Data Visualization Style. A vibrant circular chart displaying a twenty percent decrease with bright colors and clean design, ideal for business, finance, and analytics presentations
Free with trial Simple line art business icons set featuring a magnifying glass, minus symbol, pie chart, and rising bar graph for financial data analysis. Chart financial growth decrease vectors Simple line art business icons set featuring a magnifying glass, minus symbol, pie chart, and rising bar graph for
Free with trial Dollar and chart, rising prices, money icon blank template. Chart financial growth decrease vectors Dollar and chart, rising prices, money icon blank
Free with trial Cityscape financial data analysis on tablet, high-resolution background Generative AI. Chart financial growth decrease illustrations Cityscape financial data analysis on tablet
Free with trial Financial planning graph shows coins and pen. Chart financial growth decrease illustrations Financial planning graph shows coins and pen
Free with trial A business professional conducts a thorough analysis of financial data using a magnifying glass, illustrating market trends with graphs and charts on a digital interface. Scalp. Chart financial growth decrease illustrations Business Professional Analyzing Financial Data with a Magnifying Glass, Graphs, and Visual Representation of Market. A business professional conducts a thorough analysis of financial data using a magnifying glass, illustrating market trends with graphs and charts on a digital interface. Scalp
Free with trial Brightly colored wooden blocks arranged as a bar graph with one block falling represents decline Use for financial or business illustrations. Chart financial growth decrease illustrations Colorful Wooden Blocks Forming a Graph, One Falling, on Data Chart. Brightly colored wooden blocks arranged as a bar graph with one block falling represents decline Use for financial or business illustrations
Free with trial A close-up shot of a printed financial report showing market fluctuations indicated by a red line graph. Chart financial growth decrease illustrations A financial document showing a fluctuating red line graph displayed. A close-up shot of a printed financial report showing market fluctuations indicated by a red line graph
Free with trial Tax blocks with percentage symbol and up and down arrows on financial charts, concept of tax rate changes and fiscal policy featuring taxes, taxation, percent with VAT and government elements for. Chart financial growth decrease illustrations Tax blocks with percentage symbol and up and down arrows on financial charts
Free with trial Economic recession, financial crisis or stock market crash concept with injured businessman investor or business owner. Red down arrow. Vector illustration. Chart financial growth decrease vectors Economic recession, financial crisis
Free with trial Cost of dollar with arrow down and up. Coin of dollar with loss or growth. Increase and low of revenue. Economy crisis or economy growth. Icon of exchange of currency. Vector. Chart financial growth decrease vectors Cost of dollar with arrow down and up. Coin of dollar with loss or growth. Increase and low of revenue. Economy crisis or economy
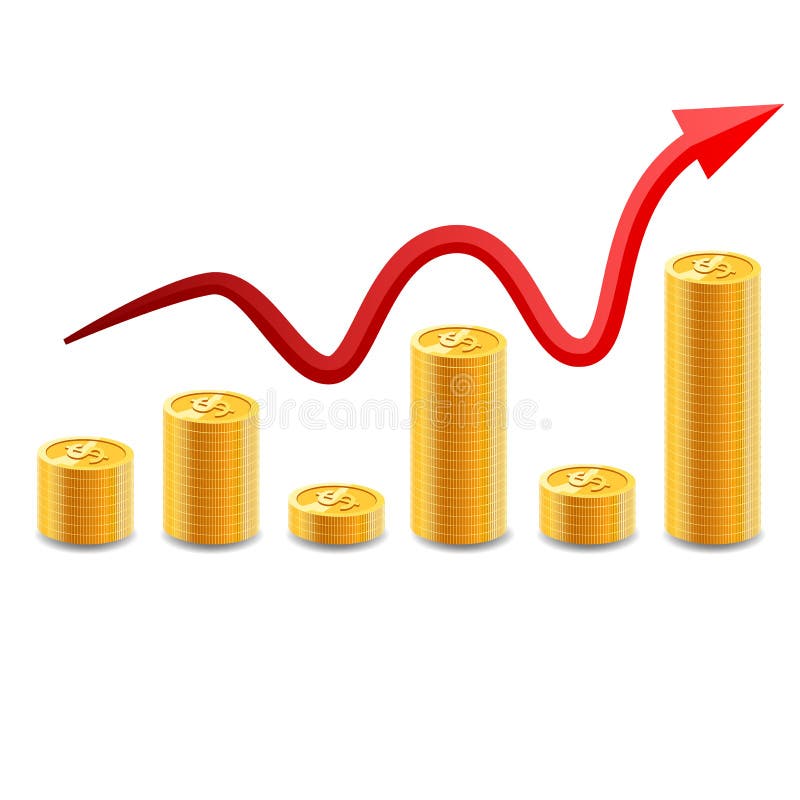
Free with trial Increasing piles of coins with going up graph. Concept for financial growth. illustration. Chart financial growth decrease vectors Increasing piles of coins with going up graph.
Free with trial Illustration of economic growth is depicted by a green staircase ascending toward light, symbolizing progress and increased prosperity. Chart financial growth decrease vectors Illustration of economic growth is depicted by a green staircase ascending toward light
Free with trial Red arrow pointing downward over a dilapidated house. Concept of real estate market decline, property value decrease, and foreclosure. Chart financial growth decrease illustrations Red arrow pointing downward over a dilapidated house. Concept of real estate market decline, property value decrease
Free with trial Financial chart of revenue and loss. Chart financial growth decrease vectors Time Management Chart. Financial chart of revenue and loss
Free with trial Profit and loss, investment direction or economic forecast, growth and decline in profit, make money or losing money concept, businessman running on rising up growth graph and decline recession down. Chart financial growth decrease vectors Profit and loss, investment direction or economic forecast, growth and decline in profit, make money or losing money concept
Free with trial Up and down curved arrow chart icon illustration. Business trend bar symbol in black circle. Chart financial growth decrease vectors Up and down curved arrow chart icon. Business trend bar symbol in black circle
Free with trial Up and down graph icon on black circle. Outline bar chart with uptrend and downtrend arrow symbol vector. Chart financial growth decrease vectors Up and down graph icon on black circle. Outline bar chart with uptrend and downtrend arrow symbol
Free with trial A clean and modern vector illustration of a line graph, isolated on a white background. This flat design icon features two distinct lines, one blue and one brown, plotting various data points to show trends and comparisons over time. It's a versatile graphic representing concepts like data analysis, business analytics, financial statistics, market research, and performance tracking. Ideal for use in presentations, infographics, websites, business reports, and marketing materials to visualize progress, growth, or economic fluctuations. Chart financial growth decrease vectors Data Analysis Line Graph Icon. A clean and modern vector illustration of a line graph, isolated on a white background. This flat design icon features two distinct lines, one blue and one brown, plotting various data points to show trends and comparisons over time. It's a versatile graphic representing concepts like data analysis, business analytics, financial statistics, market research, and performance tracking. Ideal for use in presentations, infographics, websites, business reports, and marketing materials to visualize progress, growth, or economic fluctuations.
Free with trial A 3D bar chart shows a downward trend with a prominent red arrow indicating a significant decrease in value. Chart financial growth decrease illustrations Red arrow graph showing steep decline in bar chart data. A 3D bar chart shows a downward trend with a prominent red arrow indicating a significant decrease in value
Free with trial A vibrant and playful collection of hand-drawn financial and business icons. The set includes a bar graph, gold bars, a downward arrow, calculators, a smiley face, and cartoon dollar bills. These icons are perfect for illustrating concepts related to finance, economics, investment, and business growth. The simple and cheerful design makes them ideal for educational materials, presentations, and websites. Chart financial growth decrease vectors Finance and Business Icons Set. A vibrant and playful collection of hand-drawn financial and business icons. The set includes a bar graph, gold bars, a downward arrow, calculators, a smiley face, and cartoon dollar bills. These icons are perfect for illustrating concepts related to finance, economics, investment, and business growth. The simple and cheerful design makes them ideal for educational materials, presentations, and websites.
Free with trial Bitcoin and chart, rising prices, money icon blank template. Chart financial growth decrease vectors Bitcoin and chart, rising prices, money icon blank
Free with trial Blue arrow points down beside stack of gold coins with dollar sign. Conceptual graphic represents financial decline, market crash or economic recession. Chart financial growth decrease illustrations Blue arrow points down beside stack of gold coins with dollar sign. Conceptual graphic represents financial decline, market
Free with trial Dollar rate increase. Cost rising icon with money sign and growth arrow. Increase price, higher profit. vector. Chart financial growth decrease vectors Dollar rate increase. Cost rising icon with money sign and growth arrow. Increase price, higher profit. vector
Free with trial Bar graphs with various upward and downward trending arrows and a stylized dollar sign indicating financial growth and decline. Chart financial growth decrease vectors Bar graphs with various upward and downward trending arrows and a stylized dollar sign
Free with trial This minimalist vector illustration depicts a line chart indicating a negative performance or decline. The design features a clean blue line with circular data points connected by segments, ending in a sharp red arrow pointing downwards. The background is a soft, neutral shade, emphasizing the clear visual representation of financial loss or decreasing statistics. Chart financial growth decrease vectors A simple line graph showing a downward trend with a red arrow. This minimalist vector illustration depicts a line chart indicating a negative performance or. This minimalist vector illustration depicts a line chart indicating a negative performance or decline. The design features a clean blue line with circular data points connected by segments, ending in a sharp red arrow pointing downwards. The background is a soft, neutral shade, emphasizing the clear visual representation of financial loss or decreasing statistics
Free with trial Growth development graph rise icon. Vector graphic design. Chart financial growth decrease vectors Graph up down growth development icon. Growth development graph rise icon. Vector graphic design.
Free with trial Financial icons including coins, ATM, gold bars, calculator, piggy bank, and credit card, representing money and banking. Chart financial growth decrease vectors Financial icons including coins, ATM, gold bars, calculator, piggy bank, and credit card
Free with trial An illustration depicts a sad face atop a credit card and rising green bars with upward arrows in a flat design style. Chart financial growth decrease vectors Financial Burden and Growth: Sad Face with Credit Card and Rising Arrows Concept. An illustration depicts a sad face atop a credit card and rising green bars with upward arrows in a flat design style.
Free with trial Dollar and chart, currency decline, money icon blank template. Chart financial growth decrease vectors Dollar and chart, currency decline, money icon blank