Free with trial Calendar, Report diagram and Presentation board icons simple set. Smartphone statistics sign. Event reminder, Financial market, Growth chart. Mobile business. Education set. Linear calendar icon. Chart financial growth decrease vectors Calendar, Report diagram and Presentation board icons set. Smartphone statistics sign. Vector. Calendar, Report diagram and Presentation board icons simple set. Smartphone statistics sign. Event reminder, Financial market, Growth chart. Mobile business. Education set. Linear calendar icon
Free with trial Cost low and loss. Decrease revenue. Crisis of economy. Icon of money inflation. Chart financial growth decrease vectors Cost low and loss. Decrease revenue. Crisis of economy.
Free with trial A hand-drawn illustration depicting a presentation on data trends. A stick figure presenter, holding a microphone, points to a chart on a screen labeled "DATA TRENDS. " The chart displays a line graph and bar graphs, suggesting growth and analysis. This image is suitable for illustrating business concepts, data analysis, presentations, and financial reports. It conveys a sense of information, communication, and progress. Chart financial growth decrease vectors Data Presentation: Business Trends and Analysis. A hand-drawn illustration depicting a presentation on data trends. A stick figure presenter, holding a microphone, points to a chart on a screen labeled "DATA TRENDS." The chart displays a line graph and bar graphs, suggesting growth and analysis. This image is suitable for illustrating business concepts, data analysis, presentations, and financial reports. It conveys a sense of information, communication, and progress.
Free with trial Diagram graph, Investment graph and Swipe up icons simple set. Halftone dots button. Presentation chart, Investment infochart, Growth report. Scrolling page. Science set. Vector. Chart financial growth decrease vectors Diagram graph, Investment graph and Swipe up icons set. Vector. Diagram graph, Investment graph and Swipe up icons simple set. Halftone dots button. Presentation chart, Investment infochart, Growth report. Scrolling page. Science set. Vector
Free with trial Coins decrease isometric isolated on transparent background. Chart financial growth decrease illustrations Coins decrease isometric isolated on transparent background
Free with trial Abstract cloud on red forex chart background. Market crisis and data server concept. 3D Rendering. Chart financial growth decrease illustrations Abstract cloud on forex chart background. Market crisis and data server concept. 3D Rendering
Free with trial This stock image features a visual representation of the concept of business and financial crisis. The image shows the impact of economic uncertainty and instability on companies and individuals. This stock image can be used to illustrate the consequences of financial struggles and the need for solutions to overcome them. Whether used in a corporate presentation, news segment, or educational image, this stock image provides a powerful visual representation of a complex and important issue. Chart financial growth decrease illustrations Business and financial crisis concept. This stock image features a visual representation of the concept of business and financial crisis. The image shows the impact of economic uncertainty and instability on companies and individuals. This stock image can be used to illustrate the consequences of financial struggles and the need for solutions to overcome them. Whether used in a corporate presentation, news segment, or educational image, this stock image provides a powerful visual representation of a complex and important issue.
Free with trial 3D Cost of dollar with arrow down and up. Economy crisis or economy growth. loss or growth. Icon of exchange currency. Trendy and modern vector in 3d style. Chart financial growth decrease vectors 3D Cost of dollar with arrow down and up. Economy crisis or economy growth. loss or growth. Icon of exchange currency
Free with trial Hand drawn doodle falling down graph chart illustration vector isolated sketch. Chart financial growth decrease vectors Hand drawn doodle falling down graph chart illustration vector isolated
Free with trial Collection Abstract graph line moving up and down. concept of business growth or lower. Modern design graphics on white and dark background. Vector illustration. Chart financial growth decrease vectors Collection Abstract graph line moving up and down. concept of business growth or lower.
Free with trial Recruitment, Pie chart and Report line icons set. Licence, cell phone and deal vector icons. Wallet sign. Manager change, Presentation graph, Presentation document. Money payment. Vector. Chart financial growth decrease vectors Recruitment, Pie chart and Report icons set. Wallet sign. Vector. Recruitment, Pie chart and Report line icons set. Licence, cell phone and deal vector icons. Wallet sign. Manager change, Presentation graph, Presentation document. Money payment. Vector
Free with trial 3D Stock crisis red price drop down arrow down chart, business and finance money loss move inflation economic deflation investment collapse. Chart financial growth decrease illustrations 3D Stock crisis red price drop down arrow down chart
Free with trial Hand drawn doodle falling down graph chart illustration vector isolated sketch. Chart financial growth decrease vectors Hand drawn doodle falling down graph chart illustration vector isolated
Free with trial A vibrant collection of hand-drawn business charts and graphs, rendered in shades of blue with a sketch-like aesthetic. The set includes various types of visualizations like bar charts, line graphs, pie charts, and donut charts, representing data, growth, and analysis. This versatile illustration is perfect for presentations, reports, infographics, and any project requiring a visual representation of financial or statistical information with a creative, hand-crafted feel. Chart financial growth decrease illustrations Hand-Drawn Business Charts and Graphs Collection. A vibrant collection of hand-drawn business charts and graphs, rendered in shades of blue with a sketch-like aesthetic. The set includes various types of visualizations like bar charts, line graphs, pie charts, and donut charts, representing data, growth, and analysis. This versatile illustration is perfect for presentations, reports, infographics, and any project requiring a visual representation of financial or statistical information with a creative, hand-crafted feel.
Free with trial Money coin decrease vector design. That icon, sign or symbol. Consist of round circle coin, dollars currency sign and drop down arrow. Crisis concept for financial, economy, stock or salary. 48x48 px. Chart financial growth decrease vectors Increase decrease and arrow vector icon set design, 48x48 pixel perfect and editable stroke. Money coin decrease vector design. That icon, sign or symbol. Consist of round circle coin, dollars currency sign and drop down arrow. Crisis concept for financial, economy, stock or salary. 48x48 px.
Free with trial Money coin decrease vector design. That icon, sign or symbol. Consist of round circle coin, dollars currency sign and drop down arrow. Crisis concept for financial, economy, stock or salary. 48x48 px. Chart financial growth decrease vectors Increase decrease and arrow vector icon set design, 48x48 pixel perfect and editable stroke. Money coin decrease vector design. That icon, sign or symbol. Consist of round circle coin, dollars currency sign and drop down arrow. Crisis concept for financial, economy, stock or salary. 48x48 px.
Free with trial Money coin decrease vector design. That icon, sign or symbol. Consist of round circle coin, dollars currency sign and drop down arrow. Crisis concept for financial, economy, stock or salary. 48x48 px. Chart financial growth decrease vectors Increase decrease and arrow vector icon set design, 48x48 pixel perfect and editable stroke. Money coin decrease vector design. That icon, sign or symbol. Consist of round circle coin, dollars currency sign and drop down arrow. Crisis concept for financial, economy, stock or salary. 48x48 px.
Free with trial Money coin decrease vector design. That icon, sign or symbol. Consist of round circle coin, dollars currency sign and drop down arrow. Crisis concept for financial, economy, stock or salary. 48x48 px. Chart financial growth decrease vectors Increase decrease and arrow vector icon set design, 48x48 pixel perfect and editable stroke. Money coin decrease vector design. That icon, sign or symbol. Consist of round circle coin, dollars currency sign and drop down arrow. Crisis concept for financial, economy, stock or salary. 48x48 px.
Free with trial Set line Browser with stocks market Cloud and shield Binary code Coal mine trolley Calculator Folder lock Financial growth decrease and Search folder icon. Vector. Chart financial growth decrease illustrations Set line Browser with stocks market, Cloud and shield, Binary code, Coal mine trolley, Calculator, Folder lock. Set line Browser with stocks market Cloud and shield Binary code Coal mine trolley Calculator Folder lock Financial growth decrease and Search folder icon. Vector.
Free with trial Colorful graph chart is showing and comparing different data results with lines and dots. Chart financial growth decrease vectors Colorful graph chart showing different data comparing results. Colorful graph chart is showing and comparing different data results with lines and dots
Free with trial Bear stock market invest decrease symbol in black and white vector illustration. Chart financial growth decrease vectors Bear stock market invest decrease symbol
Free with trial Bear stock market invest decrease symbol vector illustration. Chart financial growth decrease vectors Bear stock market invest decrease symbol
Free with trial Decrease icon vector from sales concept. Thin line illustration of decrease editable stroke. decrease linear sign for use on web and mobile apps, logo, print media. Chart financial growth decrease vectors Decrease icon vector from sales concept. Thin line illustration of decrease editable stroke. decrease linear sign for use on web
Free with trial Vector set of Remove team, Cashback and Chemistry lab line icons set. UI phone app screens with line icons. Diagram chart icon. Networking, Financial transfer, Laboratory. Presentation graph. Vector. Chart financial growth decrease vectors Vector set of Remove team, Cashback and Chemistry lab line icons set. Vector. Vector set of Remove team, Cashback and Chemistry lab line icons set. UI phone app screens with line icons. Diagram chart icon. Networking, Financial transfer, Laboratory. Presentation graph. Vector
Free with trial Global World Financial Crisis Concept. Default, Inflation, Devaluation, Stock Market Crash. Shocked People Lose Money And Investments. Price Increase Process. Isometric Cartoon 3d Vector Illustration. Chart financial growth decrease illustrations Global World Financial Crisis Concept. Default, Inflation, Devaluation, Stock Market Crash. Shocked People Lose Money
Free with trial Business graphics traffic, Arrow Business, Financial analysis data graphs and diagram, marketing statistic modern business presentation elements vector investment progress icon set, element arrow presentation. Chart financial growth decrease vectors Business graphics traffic, Arrow Business, Financial analysis data graphiics. Business graphics traffic, Arrow Business, Financial analysis data graphs and diagram, marketing statistic modern business presentation elements vector investment progress icon set, element arrow presentation
Free with trial Businessman in suit jumps between cliffs with red downward and green upward arrows, symbolizing market recovery and financial success. Chart financial growth decrease illustrations Businessman jumping from financial crisis to success with red downward and green upward arrows. Businessman in suit jumps between cliffs with red downward and green upward arrows, symbolizing market recovery and financial success
Free with trial Business graphic chart line, round and candlestick graph trend with glassmorphism effect. Transparent blur glass on gradient arrow vector set. Financial diagram on black. Marketing analytics. Chart financial growth decrease illustrations Business graphic chart line round and candlestick graph trend with glassmorphism effect vector set, arrows on black. Business graphic chart line, round and candlestick graph trend with glassmorphism effect. Transparent blur glass on gradient arrow vector set. Financial diagram on black. Marketing analytics
Free with trial Businessman stick figure character in suit standing front of downward trend graph chart. concerned situation. Business failure, crisis, bankruptcy, down negative arrow. hand drawn doodle illustration. Chart financial growth decrease vectors Businessman stick figure character in suit standing front of downward trend graph chart. concerned situation. Business failure
Free with trial A girl stands confidently, pointing at a finance chart displayed on a large screen. Her expression is focused and determined, highlighting key trends and data that drive her presentation. Chart financial growth decrease illustrations The girl is pointing at the finance chart. A girl stands confidently, pointing at a finance chart displayed on a large screen. Her expression is focused and determined, highlighting key trends and data that drive her presentation.
Free with trial A 3D icon featuring a dark square base with a gold border. On the base are four vertical bars of varying heights, colored in shades of beige and gold. A red zigzag line representing a downward trend is positioned above the bars, with its peak resting on the tallest bar and its subsequent segments descending. The icon is isolated on a clean white background. Chart financial growth decrease illustrations Downward financial trend graph icon chart business. A 3D icon featuring a dark square base with a gold border. On the base are four vertical bars of varying heights, colored in shades of beige and gold. A red zigzag line representing a downward trend is positioned above the bars, with its peak resting on the tallest bar and its subsequent segments descending. The icon is isolated on a clean white background
Free with trial Red arrow pointer, stock market chart, red arrow pointing down, global crisis, economic downturn. Chart financial growth decrease illustrations Red arrow pointer, stock market chart, red arrow pointing down, global crisis, economic downturn
Free with trial Iraq business economy growth country with map and finance condition - vector illustration. Chart financial growth decrease illustrations Iraq business economy growth country with map and finance condition - vector illustration
Free with trial Falling Performance Shown in 3D Business Data Chart - 3D chart displays a decline in business performance, highlighting negative growth. Chart financial growth decrease illustrations Falling Performance Shown in 3D Business Data Chart
Free with trial Up and down curved arrow chart icon. Business trend bar symbol illustration. Chart financial growth decrease vectors Up and down curved arrow chart icon. Business trend bar symbol
Free with trial Vector set of Crown, Payment click and Statistics timer line icons set. UI phone app screens with line icons. Horizontal chart icon. Monarchy king, Financial transfer, Growth chart. Vector. Chart financial growth decrease vectors Vector set of Crown, Payment click and Statistics timer line icons set. Vector. Vector set of Crown, Payment click and Statistics timer line icons set. UI phone app screens with line icons. Horizontal chart icon. Monarchy king, Financial transfer, Growth chart. Vector
Free with trial Candlestick graph sign. Diploma certificate, save planet chat bubbles. Safe time, Organic product and Web report line icons set. Management, Leaves, Graph chart. Finance chart. Business set. Vector. Chart financial growth decrease vectors Safe time, Organic product and Web report icons set. Candlestick graph sign. Management, Leaves, Graph chart. Vector. Candlestick graph sign. Diploma certificate, save planet chat bubbles. Safe time, Organic product and Web report line icons set. Management, Leaves, Graph chart. Finance chart. Business set. Vector
Free with trial Decrease icon vector isolated on white background for your web and mobile app design, Decrease logo concept. Chart financial growth decrease vectors Decrease icon vector sign and symbol isolated on white background, Decrease logo concept. Decrease icon vector isolated on white background for your web and mobile app design, Decrease logo concept
Free with trial Safe time, Organic product and Web report line icons set. Handshake deal, research and promotion complex icons. Candlestick graph sign. Management, Leaves, Graph chart. Finance chart. Vector. Chart financial growth decrease vectors Safe time, Organic product and Web report icons set. Candlestick graph sign. Management, Leaves, Graph chart. Vector. Safe time, Organic product and Web report line icons set. Handshake deal, research and promotion complex icons. Candlestick graph sign. Management, Leaves, Graph chart. Finance chart. Vector
Free with trial Safe time, Organic product and Web report line icons set. Candlestick graph sign. Management, Leaves, Graph chart. Finance chart. Business set. Line safe time outline icon. Vector. Chart financial growth decrease vectors Safe time, Organic product and Web report icons set. Candlestick graph sign. Management, Leaves, Graph chart. Vector. Safe time, Organic product and Web report line icons set. Candlestick graph sign. Management, Leaves, Graph chart. Finance chart. Business set. Line safe time outline icon. Vector
Free with trial Flat declining coin bar chart with stack coin icon logo vector illustration design, for business and finance symbol. Chart financial growth decrease illustrations Flat declining coin bar chart with stack coin icon logo vector illustration design
Free with trial Graph going Up and Down sign with green and red arrows vector. Flat design vector illustration concept of sales bar chart symbol icon with arrow moving down and sales bar chart with arrow moving up. Chart financial growth decrease vectors Graph going Up and Down sign with green and red arrows vector. Flat design vector illustration concept of sales bar chart symbol. Graph going Up and Down sign with green and red arrows vector. Flat design vector illustration concept of sales bar chart symbol icon with arrow moving down and sales bar chart with arrow moving up.
Free with trial Economic chart declining icon vector illustration design economic. Chart financial growth decrease vectors Economic chart declining icon vector illustration design
Free with trial A vibrant 3D representation of a business graph and chart, showcasing data analysis and financial trends with colorful bars and a dynamic line, isolated on a clean white background. Chart financial growth decrease illustrations 3d graph and chart icons isolated on white background. A vibrant 3D representation of a business graph and chart, showcasing data analysis and financial trends with colorful bars and a dynamic line, isolated on a clean white background
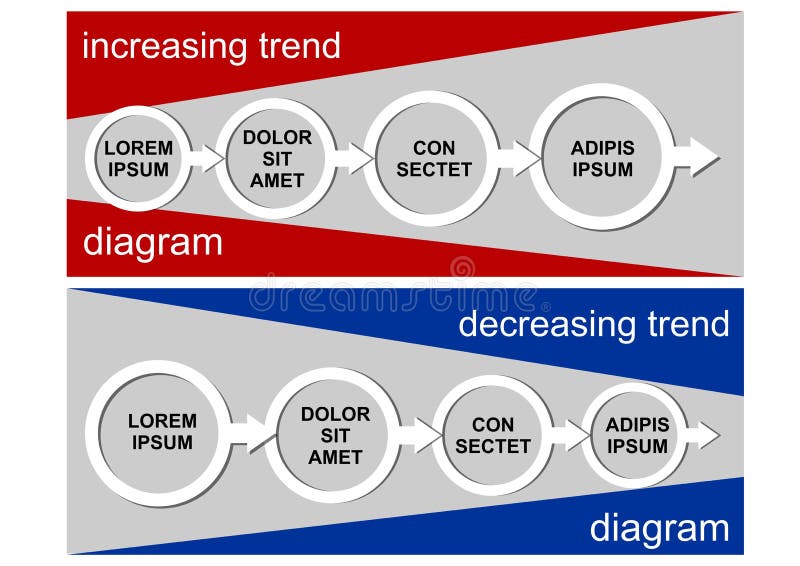
Free with trial Increase diagram and decrease diagram with circles and arrows, infographic template with simple white elements on gray background, red triangles and blue triangles, vector template. Chart financial growth decrease vectors Increase diagram and decrease diagram with circles and arrows, infographic template with simple white elements on gray
Free with trial A set of financial icons depicting market trends, investment growth, and money management, including charts, coins, and graphs for economic analysis. Chart financial growth decrease vectors Financial graph and money icons on transparent background. A set of financial icons depicting market trends, investment growth, and money management, including charts, coins, and graphs for economic analysis.
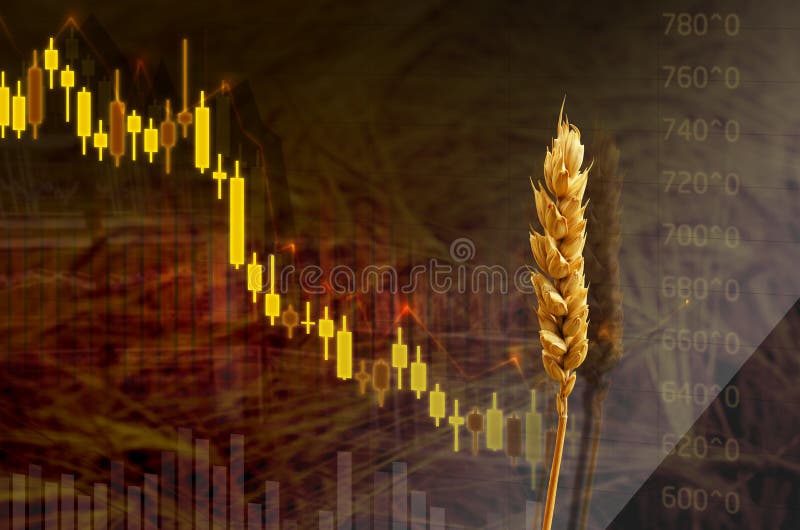
Free with trial Price level decrease of agricultural grains shown by chart, graph and close up photo of wheat, on wheat field brown background. Chart financial growth decrease illustrations Diagram of fall food prices. Decrease in the price of wheat seedson the graph with dollar sign. Put down price of seeds. Price level decrease of agricultural grains shown by chart, graph and close up photo of wheat, on wheat field brown background.
Free with trial Decline chart icon. Concept of falling stock markets or declining profits in business. Simple color version from a series of business icons. Chart financial growth decrease vectors Decline chart icon. Concept of falling stock markets or declining profits in business. Simple color version
Free with trial Myanmar business economy growth country with map and finance condition - vector illustration. Chart financial growth decrease illustrations Myanmar business economy growth country with map and finance condition - vector illustration
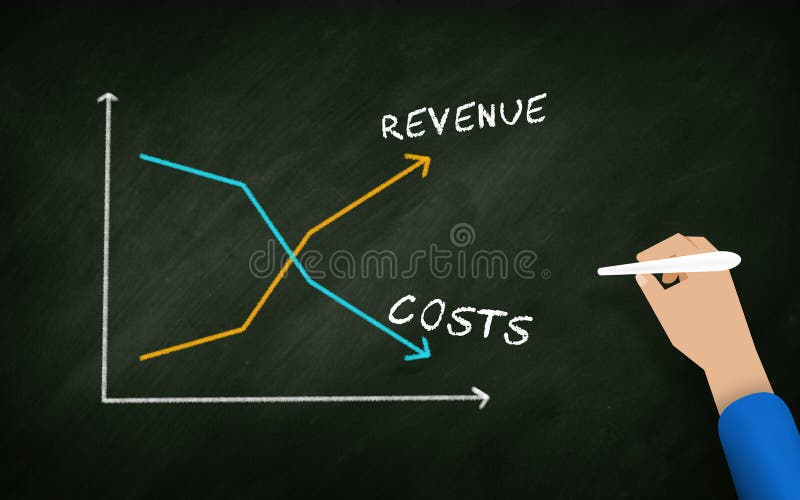
Free with trial Revenue Costs Graph on blackboard. Revenue Increase and Cost decrease. drawing In chalk board by businessman Hand. Chart financial growth decrease illustrations Revenue Costs Graph on blackboard. Revenue Increase and Cost decrease. drawing In chalk board by businessman Hand
Free with trial Diagram chart, Bitcoin system and Payment method icons simple set. Halftone dots button. Decreasing graph sign. Presentation graph, Cryptocurrency monitor, Wallet with coins. Column chart. Vector. Chart financial growth decrease vectors Diagram chart, Bitcoin system and Payment method icons set. Decreasing graph sign. Vector. Diagram chart, Bitcoin system and Payment method icons simple set. Halftone dots button. Decreasing graph sign. Presentation graph, Cryptocurrency monitor, Wallet with coins. Column chart. Vector
Free with trial Economic growth concept with the business people. Chart financial growth decrease illustrations Economic growth concept with business people
Free with trial Pie chart icon design vector. Chart financial growth decrease vectors Pie chart icon design
Free with trial Pie chart icon design vector. Chart financial growth decrease vectors Pie chart icon design
Free with trial Pie chart icon design vector. Chart financial growth decrease vectors Pie chart icon design
Free with trial Pie chart icon design vector. Chart financial growth decrease vectors Pie chart icon design
Free with trial Pie chart icon design vector. Chart financial growth decrease vectors Pie chart icon design
Free with trial Pie chart icon design vector. Chart financial growth decrease vectors Pie chart icon design
Free with trial Pie chart icon design vector. Chart financial growth decrease vectors Pie chart icon design
Free with trial Pie chart icon design vector. Chart financial growth decrease vectors Pie chart icon design
Free with trial Kamboja business economy growth country with map and finance condition - vector illustration. Chart financial growth decrease illustrations Kamboja business economy growth country with map and finance condition - vector illustration
Free with trial 3D Rendering of financial icon floating on water gold symbol on background concept of sunk cost finance asset. 3D render illustration cartoon. Chart financial growth decrease illustrations 3D Rendering of financial icon floating on water gold symbol on background
Free with trial Chart creator black icon, concept illustration, glyph symbol, vector flat sign. Chart financial growth decrease vectors Chart creator black icon, concept illustration, vector flat symbol, glyph sign. Chart creator black icon, concept illustration, glyph symbol, vector flat sign.
Free with trial Declining graph icon. Business decline chart filled flat sign for mobile concept and web design. Simple vector logo. Chart financial growth decrease illustrations Declining graph icon. Business decline chart filled flat sign for mobile concept and web design
Free with trial A 3D rendered bar chart composed of four colored blocks of varying heights. The blocks are blue, yellow, red, and white, arranged from shortest to tallest from left to right. The chart is presented on a clean white background, with subtle shadows beneath the blocks. Chart financial growth decrease illustrations Colorful 3D Bar Chart with Varying Heights on a White Background graph statistics. A 3D rendered bar chart composed of four colored blocks of varying heights. A 3D rendered bar chart composed of four colored blocks of varying heights. The blocks are blue, yellow, red, and white, arranged from shortest to tallest from left to right. The chart is presented on a clean white background, with subtle shadows beneath the blocks
Free with trial Line icon of a flip chart showing decreasing bars, suggesting a negative trend during a business presentation. Chart financial growth decrease vectors Flip chart showing decreasing bars graphic for business presentation. Line icon of a flip chart showing decreasing bars, suggesting a negative trend during a business presentation
Free with trial Descending chart icon. Element of Finance for mobile concept and web apps icon. Outline, thin line icon for website design and development, app development on white background. Chart financial growth decrease illustrations Descending chart icon. Element of Finance for mobile concept and web apps icon. Outline, thin line icon for website design and
Free with trial Closeup of male hand analyzing financial graph with stylus. Chart financial growth decrease illustrations Closeup of male hand analyzing financial graph with stylus
Free with trial Business analysis icon. symbol with magnifying glass. dollar increase revenue. Money with arrow. finance cost. decrease rate economy stretching. lost crisis. reduction bankrupt. vector illustration. Chart financial growth decrease vectors Business analysis icon. symbol with magnifying glass. dollar increase revenue. Money with arrow. finance cost. decrease rate econo
Free with trial Bankruptcy financial crisis social media post template collection vector illustration. Chart financial growth decrease vectors Bankruptcy financial crisis social media post collection vector illustration
Free with trial Chart, data, graph, reports, valuation Logo Design. Blue and Orange Brand Name Design. Place for Tagline. Business Logo template. Chart financial growth decrease vectors Chart, data, graph, reports, valuation Logo Design. Blue and Ora
Free with trial Three isometric 3D bar chart columns with a gradient color fill on a light background. Chart financial growth decrease illustrations Three Isometric 3D Bar Chart Columns with Gradient Colors. Three isometric 3D bar chart columns with a gradient color fill on a light background
Free with trial Payment received, Cash and No internet icons simple set. Graph chart sign. Money, Banking currency, Bandwidth meter. Growth report. Business set. Linear payment received icon. Colorful design set. Chart financial growth decrease vectors Payment received, Cash and No internet icons set. Graph chart sign. Money, Banking currency, Bandwidth meter. Vector. Payment received, Cash and No internet icons simple set. Graph chart sign. Money, Banking currency, Bandwidth meter. Growth report. Business set. Linear payment received icon. Colorful design set
Free with trial A close-up, angled perspective of several printed business reports displaying a variety of financial data. The documents feature colorful pie charts, blue bar graphs, and line graphs tracking performance and statistics. This image is perfect for illustrating concepts such as data analysis, market research, financial planning, investment strategy, and corporate performance review. The detailed charts and figures represent the core of business analytics, accounting, and economic forecasting, making it a versatile background for financial presentations and articles. Chart financial growth decrease illustrations Business Analytics Report with Financial Charts and Graphs. A close-up, angled perspective of several printed business reports displaying a variety of financial data. The documents feature colorful pie charts, blue bar graphs, and line graphs tracking performance and statistics. This image is perfect for illustrating concepts such as data analysis, market research, financial planning, investment strategy, and corporate performance review. The detailed charts and figures represent the core of business analytics, accounting, and economic forecasting, making it a versatile background for financial presentations and articles.
Free with trial Global World Financial Crash, Stock Market Crisis Concept. Shocked Traders Got Margin Call, And Try to Control Situation On Market. Downfall, Inflation, Bankruptcy. Isometric 3d Vector Illustration. Chart financial growth decrease vectors Global World Financial Crash, Stock Market Crisis Concept. Shocked Traders Got Margin Call, And Try to Control Situation
Free with trial Gold bitcoin down with mobile phone. business finance. Growth, economy, investment and technology,Leadership concept, Minimalist retro. Chart financial growth decrease illustrations Gold bitcoin down with mobile phone . business finance. Growth, economy, investment and technology,Leadership concept, Minim
Free with trial Bitcoin bubble burst. business finance. Growth, economy, investment and technology,Leadership concept, Minimalist retro pos. Chart financial growth decrease illustrations Bitcoin bubble burst . business finance. Growth, economy, investment and technology,Leadership concept, Minimalist retro pos
Free with trial Descending chart icon. Finance icons universal set for web and mobile on white background. Chart financial growth decrease illustrations Descending chart icon. Finance icons universal set for web and mobile
Free with trial Chart, data, graph, reports, valuation Flat Business Logo template. Creative Green Brand Name Design. Chart financial growth decrease vectors Chart, data, graph, reports, valuation Flat Business Logo templa
Free with trial Growth market icon design vector. Chart financial growth decrease vectors Growth market icon design