Free with trial Infographic timeline. Payment received, Cash and No internet icons simple set. Graph chart sign. Money, Banking currency, Bandwidth meter. Growth report. Business set. 4 steps layout. Vector. Chart financial growth decrease vectors Payment received, Cash and No internet icons set. Graph chart sign. Money, Banking currency, Bandwidth meter. Vector. Infographic timeline. Payment received, Cash and No internet icons simple set. Graph chart sign. Money, Banking currency, Bandwidth meter. Growth report. Business set. 4 steps layout. Vector
Free with trial The growth and decline concept with businessmen. Chart financial growth decrease illustrations The growth and decline concept with businessmen
Free with trial The growth and decline concept with businessmen. Chart financial growth decrease illustrations The growth and decline concept with businessmen
Free with trial The growth and decline concept with businessmen. Chart financial growth decrease illustrations The growth and decline concept with businessmen
Free with trial The growth and decline concept with businessmen. Chart financial growth decrease illustrations The growth and decline concept with businessmen
Free with trial Demand curve, Money exchange and Candlestick chart line icons set. Column chart, Business targeting and Dollar exchange signs. Bitcoin system symbol. Statistical report, Cash in bag. Vector. Chart financial growth decrease vectors Demand curve, Money exchange and Candlestick chart icons set. Vector. Demand curve, Money exchange and Candlestick chart line icons set. Column chart, Business targeting and Dollar exchange signs. Bitcoin system symbol. Statistical report, Cash in bag. Vector
Free with trial The growth and decline concept with businessmen. Chart financial growth decrease illustrations The growth and decline concept with businessmen
Free with trial Demand curve, Money exchange and Candlestick chart line icons set. Chat bubbles with quotes. Column chart, Business targeting and Dollar exchange signs. Bitcoin system symbol. Vector. Chart financial growth decrease vectors Demand curve, Money exchange and Candlestick chart icons set. Vector. Demand curve, Money exchange and Candlestick chart line icons set. Chat bubbles with quotes. Column chart, Business targeting and Dollar exchange signs. Bitcoin system symbol. Vector
Free with trial Blue Round Button for chart, data, graph, reports, valuation Glyph icon. Vector EPS10 Abstract Template background. Chart financial growth decrease vectors Blue Round Button for chart, data, graph, reports, valuation Glyph icon
Free with trial The growth and decline concept with businessmen. Chart financial growth decrease illustrations The growth and decline concept with businessmen
Free with trial Finance icons set. Included icon as Graph chart, Calendar, Web report signs. Financial diagram, Loyalty points, Cashback symbols. Loyalty card, Income money line icons. Line icons set. Vector. Chart financial growth decrease vectors Finance icons set. Included icon as Graph chart, Calendar, Web report signs. Vector. Finance icons set. Included icon as Graph chart, Calendar, Web report signs. Financial diagram, Loyalty points, Cashback symbols. Loyalty card, Income money line icons. Line icons set. Vector
Free with trial Stock market chart showing a downward trend with red and green candlesticks indicating price fluctuations. A moving average line overlays the candlesticks. Volume bars at the bottom correlate with trading activity, mostly red, suggesting higher selling pressure. Vertical axis shows price levels, and horizontal axis depicts time. The chart originates from Cendlewe (Bearits). Candlestick shapes and colors represent price movements over time, with red indicating a decrease and green an increase. Chart financial growth decrease illustrations Dynamic stock market chart shows downward trend with red and green candlesticks and volume bars. Stock market chart showing a downward trend with red and green. Stock market chart showing a downward trend with red and green candlesticks indicating price fluctuations. A moving average line overlays the candlesticks. Volume bars at the bottom correlate with trading activity, mostly red, suggesting higher selling pressure. Vertical axis shows price levels, and horizontal axis depicts time. The chart originates from Cendlewe (Bearits). Candlestick shapes and colors represent price movements over time, with red indicating a decrease and green an increase.
Free with trial Financial market analysis vector graphics. Chart financial growth decrease vectors Financial market analysis vector
Free with trial Financial market analysis vector graphics. Chart financial growth decrease vectors Financial market analysis vector
Free with trial Financial market analysis vector graphics. Chart financial growth decrease vectors Financial market analysis vector
Free with trial Financial market analysis vector graphics. Chart financial growth decrease vectors Financial market analysis vector
Free with trial Financial market analysis vector graphics. Chart financial growth decrease vectors Financial market analysis vector
Free with trial Financial market analysis vector graphics. Chart financial growth decrease vectors Financial market analysis vector
Free with trial Financial market analysis vector graphics. Chart financial growth decrease vectors Financial market analysis vector
Free with trial Modern business steps to grow chart and graph options banner. Vector illustration. Abstract digital illustration with lines. Chart financial growth decrease illustrations Modern business steps to grow chart and graph options banner. Vector illustration. Abstract digital illustration with lines.
Free with trial This image features a striking red neon-style line graph on a black background, symbolizing decline, decrease, or downward trend in data visualization. Ideal for business, finance, and analytics concepts, it visually represents performance drops or negative growth in a modern, eye-catching manner. Chart financial growth decrease illustrations Red Neon Declining Graph Line Icon for Business Data Visualization. This image features a striking red neon-style line graph on a black background, symbolizing decline, decrease, or downward trend in data visualization. Ideal for business, finance, and analytics concepts, it visually represents performance drops or negative growth in a modern, eye-catching manner.
Free with trial Set of Finance icons, such as Report, Discounts calendar, Presentation board icons. UI phone app screens with people. Cashback line symbols. Presentation document, Sale month, Growth chart. Vector. Chart financial growth decrease vectors Set of Finance icons, such as Report, Discounts calendar, Presentation board. Vector. Set of Finance icons, such as Report, Discounts calendar, Presentation board icons. UI phone app screens with people. Cashback line symbols. Presentation document, Sale month, Growth chart. Vector
Free with trial Bitcoin, Income money and Presentation board icons simple set. Halftone dots button. Stock analysis sign. Cryptocurrency coin, Savings, Growth chart. Business trade. Finance set. Vector. Chart financial growth decrease vectors Bitcoin, Income money and Presentation board icons set. Stock analysis sign. Vector. Bitcoin, Income money and Presentation board icons simple set. Halftone dots button. Stock analysis sign. Cryptocurrency coin, Savings, Growth chart. Business trade. Finance set. Vector
Free with trial The opposite growth and decliine charts with businessman. Chart financial growth decrease illustrations The opposite growth and decliine charts with businessman
Free with trial Stock market investment graph arrow up and down technology on blue background. business trading increase and decrease. vector illustration fantastic hi tech design. download and upload speed. Chart financial growth decrease vectors Stock market investment graph arrow up and down technology on blue background. business trading increase and decrease. vector
Free with trial Infographics business graphics charts arrow. Financial analysis data graphs and diagram, marketing statistic modern business presentation elements vector investment progress icon set. Chart financial growth decrease vectors Infographics arrow, Arrow Business, Financial analysis data graphic object elemeent arrow profit. Infographics business graphics charts arrow. Financial analysis data graphs and diagram, marketing statistic modern business presentation elements vector investment progress icon set.
Free with trial The businessman with charts of growth and decline. Chart financial growth decrease illustrations The businessman with charts of growth and decline
Free with trial The businessman with charts of growth and decline. Chart financial growth decrease illustrations The businessman with charts of growth and decline
Free with trial The businessman with charts of growth and decline. Chart financial growth decrease illustrations The businessman with charts of growth and decline
Free with trial The businessman with charts of growth and decline. Chart financial growth decrease illustrations The businessman with charts of growth and decline
Free with trial The businessman with charts of growth and decline. Chart financial growth decrease illustrations The businessman with charts of growth and decline
Free with trial The businessman with charts of growth and decline. Chart financial growth decrease illustrations The businessman with charts of growth and decline
Free with trial Dynamic financial graphs and data analysis display on digital screen. That the image is generated using AI. Chart financial growth decrease illustrations Dynamic financial graphs and data analysis display on digital screen
Free with trial Set of Business icons, such as Statistics, Augmented reality, Payment methods, Truck delivery, Growth chart, Diagram chart, Friend, Payment exchange, Wifi, Bitcoin mining line icons. Vector. Chart financial growth decrease vectors Set of Business icons, such as Statistics, Augmented reality, Payment methods. Vector. Set of Business icons, such as Statistics, Augmented reality, Payment methods, Truck delivery, Growth chart, Diagram chart, Friend, Payment exchange, Wifi, Bitcoin mining line icons. Vector
Free with trial Chart, data, graph, reports, valuation Icon. glyph vector gray symbol for UI and UX, website or mobile application. Vector EPS10 Abstract Template background. Chart financial growth decrease vectors Chart, data, graph, reports, valuation Icon. glyph vector gray symbol for UI and UX, website or mobile application
Free with trial Bitcoin price increase decrease icon vector. Cryptocurrency market up down symbol - icon. Chart financial growth decrease vectors Bitcoin price increase decrease icon vector. Cryptocurrency market up down symbol
Free with trial Loss chart icon in filled, thin line, outline and stroke style. Vector illustration of two colored and black loss chart vector icons designs can be used for mobile, ui, web. Chart financial growth decrease vectors Loss chart icon in filled, thin line, outline and stroke style. Vector illustration of two colored and black loss chart vector
Free with trial Up and down graph icon vector in circular line. Outline bar chart with uptrend and downtrend arrow symbol. Chart financial growth decrease vectors Up and down graph icon in circular line. Outline bar chart with uptrend and downtrend arrow symbol
Free with trial Graph up and down icon vector in circular line. Outline bar chart with arrow symbol. Analytics concept. Chart financial growth decrease vectors Graph up and down icon in circular line. Outline bar chart with arrow symbol. Analytics concept
Free with trial Savings, Report document and Bill accounting line icons set. Discount, Bitcoin atm and Analytics signs. Checklist, Dot plot symbols. Finance currency, Growth chart. Finance set. Vector. Chart financial growth decrease vectors Savings, Report document and Bill accounting icons set. Discount, Bitcoin atm and Analytics signs. Vector. Savings, Report document and Bill accounting line icons set. Discount, Bitcoin atm and Analytics signs. Checklist, Dot plot symbols. Finance currency, Growth chart. Finance set. Vector
Free with trial Declining bar graph illustration, business, financial, and economic data. Chart financial growth decrease vectors Declining bar graph illustration, business, financial, and economic data
Free with trial Decrease vector icon sign symbol icon vector, filled flat sign, solid pictogram isolated on white. Symbol, logo illustration. Chart financial growth decrease illustrations Decrease vector icon sign symbol
Free with trial Decrease icon vector, filled flat sign, solid pictogram isolated on white. Symbol, logo illustration. Chart financial growth decrease vectors Decrease vector icon sign symbol. Decrease icon vector, filled flat sign, solid pictogram isolated on white. Symbol, logo illustration.
Free with trial Decrease icon sign vector,Symbol, logo illustration for web and mobile. Chart financial growth decrease vectors Decrease vector icon sign symbol. Decrease icon sign vector,Symbol, logo illustration for web and mobile
Free with trial Decrease icon vector, filled flat sign, solid pictogram isolated on white. Symbol, logo illustration. Chart financial growth decrease illustrations Decrease vector icon sign symbol. Decrease icon vector, filled flat sign, solid pictogram isolated on white. Symbol, logo illustration
Free with trial Decrease icon sign vector,Symbol, logo illustration for web and mobile. Chart financial growth decrease vectors Decrease vector icon sign symbol. Decrease icon sign vector,Symbol, logo illustration for web and mobile
Free with trial Downtrend chart with red rocket down. The concept of a business crisis or stock. vector. Chart financial growth decrease vectors Downtrend chart with red rocket down. The concept of a business crisis or stock
Free with trial Abstract financial data, changing symbols on computer black screen background. Close up of stock market and trading statistics, business concept, monochrome. Chart financial growth decrease illustrations Abstract financial data, changing symbols on computer black screen background. Animation. Close up of stock market and. Abstract financial data, changing symbols on computer black screen background. Close up of stock market and trading statistics, business concept, monochrome.
Free with trial Financial loss line icon, vector illustration, outline symbol, concept sign. Chart financial growth decrease vectors Financial loss line icon, outline symbol, vector illustration, concept sign. financial loss line icon, vector illustration, outline symbol, concept sign
Free with trial Graph going Up and Down sign with green and red arrows. graph increase, decrease sign design. Chart financial growth decrease vectors Graph going Up and Down sign with green and red arrows. graph increase, decrease sign
Free with trial Bar chart icon sign vector,Symbol, logo illustration for web and mobile. Chart financial growth decrease vectors Bar chart vector icon sign symbol. Bar chart icon sign vector,Symbol, logo illustration for web and mobile
Free with trial Bar chart icon sign vector,Symbol, logo illustration for web and mobile. Chart financial growth decrease vectors Bar chart vector icon sign symbol. Bar chart icon sign vector,Symbol, logo illustration for web and mobile
Free with trial Bar chart icon sign vector,Symbol, logo illustration for web and mobile. Chart financial growth decrease vectors Bar chart vector icon sign symbol. Bar chart icon sign vector,Symbol, logo illustration for web and mobile
Free with trial Bar chart icon sign vector,Symbol, logo illustration for web and mobile. Chart financial growth decrease vectors Bar chart vector icon sign symbol. Bar chart icon sign vector,Symbol, logo illustration for web and mobile
Free with trial Bar chart icon sign vector,Symbol, logo illustration for web and mobile. Chart financial growth decrease vectors Bar chart vector icon sign symbol. Bar chart icon sign vector,Symbol, logo illustration for web and mobile
Free with trial Bar chart icon sign vector,Symbol, logo illustration for web and mobile. Chart financial growth decrease vectors Bar chart vector icon sign symbol. Bar chart icon sign vector,Symbol, logo illustration for web and mobile
Free with trial Bar chart icon sign vector,Symbol, logo illustration for web and mobile. Chart financial growth decrease vectors Bar chart vector icon sign symbol. Bar chart icon sign vector,Symbol, logo illustration for web and mobile
Free with trial Bar chart icon sign vector,Symbol, logo illustration for web and mobile. Chart financial growth decrease vectors Bar chart vector icon sign symbol. Bar chart icon sign vector,Symbol, logo illustration for web and mobile
Free with trial Bar chart icon sign vector,Symbol, logo illustration for web and mobile. Chart financial growth decrease vectors Bar chart vector icon sign symbol. Bar chart icon sign vector,Symbol, logo illustration for web and mobile
Free with trial Bar chart icon sign vector,Symbol, logo illustration for web and mobile. Chart financial growth decrease vectors Bar chart vector icon sign symbol. Bar chart icon sign vector,Symbol, logo illustration for web and mobile
Free with trial Vector illustration of decreasing bar graph with arrow, financial concept. Chart financial growth decrease vectors Vector illustration of decreasing bar graph with arrow, financial concept
Free with trial Finance icons set. Included icon as Refresh bitcoin, Growth chart, Buying signs. Loyalty points, Fast payment, Bitcoin system symbols. Pie chart, Loyalty star line icons. Line icons set. Vector. Chart financial growth decrease vectors Finance icons set. Included icon as Refresh bitcoin, Growth chart, Buying signs. Vector. Finance icons set. Included icon as Refresh bitcoin, Growth chart, Buying signs. Loyalty points, Fast payment, Bitcoin system symbols. Pie chart, Loyalty star line icons. Line icons set. Vector
Free with trial Analyze Business Graph with Gold Coins and Pen, Financial Investment Theme , dreamy concept. Chart financial growth decrease illustrations Analyze Business Graph with Gold Coins and Pen, Financial Investment Theme
Free with trial Hot loan, Download arrow and Usd coins signs. Chat bubbles. Web traffic, Loan percent and Line chart line icons set. Website window, Discount, Financial graph. Discount offer. Finance set. Vector. Chart financial growth decrease vectors Web traffic, Loan percent and Line chart icons set. Hot loan, Download arrow and Usd coins signs. Vector. Hot loan, Download arrow and Usd coins signs. Chat bubbles. Web traffic, Loan percent and Line chart line icons set. Website window, Discount, Financial graph. Discount offer. Finance set. Vector
Free with trial A financial market graph on a blue background illustrating investment trends, this is a visual representation of market fluctuations and volume, reflecting economic movements, investment strategies and business performance analysis. Generative AI. Chart financial growth decrease illustrations Financial markets graph on a blue background showing investment trends. A financial market graph on a blue background illustrating investment trends, this is a visual representation of market fluctuations and volume, reflecting economic movements, investment strategies and business performance analysis. Generative AI
Free with trial Loss chart line icon, concept illustration, outline symbol, vector sign, linear symbol. Chart financial growth decrease illustrations Loss chart line icon, concept sign, outline vector illustration, linear symbol. Loss chart line icon, concept illustration, outline symbol, vector sign, linear symbol.
Free with trial The opposite growth and decliine charts with businessman. Chart financial growth decrease illustrations Opposite growth and decliine charts with businessman
Free with trial Set of Accounting, 24 hours and Trade chart line icons. People characters with delivery parcel, money coins. Include Decreasing graph icons. For web, application. Vector. Chart financial growth decrease vectors Set of Accounting, 24 hours and Trade chart line icons. For design. Vector. Set of Accounting, 24 hours and Trade chart line icons. People characters with delivery parcel, money coins. Include Decreasing graph icons. For web, application. Vector
Free with trial Science icons set. Included icon as Medical mask, Financial diagram, Nurse signs. Coronavirus vaccine, Wifi, Rainy weather symbols. Analytics chart, Cogwheel, Horizontal chart. 360 degrees. Vector. Chart financial growth decrease illustrations Science icons set. Included icon as Medical mask, Financial diagram, Nurse signs. Vector. Science icons set. Included icon as Medical mask, Financial diagram, Nurse signs. Coronavirus vaccine, Wifi, Rainy weather symbols. Analytics chart, Cogwheel, Horizontal chart. 360 degrees. Vector
Free with trial Chart, data, graph, reports, valuation Line Icon in Mobile for Download Page. Vector EPS10 Abstract Template background. Chart financial growth decrease vectors Chart, data, graph, reports, valuation Line Icon in Mobile for Download Page
Free with trial Finance icons set. Included icon as Analytics, Horizontal chart, Infochart signs. Cashback, Loyalty award, Vip shopping symbols. Report statistics, Decreasing graph, Wind energy. Vector. Chart financial growth decrease vectors Finance icons set. Included icon as Analytics, Horizontal chart, Infochart signs. Vector. Finance icons set. Included icon as Analytics, Horizontal chart, Infochart signs. Cashback, Loyalty award, Vip shopping symbols. Report statistics, Decreasing graph, Wind energy. Vector
Free with trial Set of Accounting, 24 hours and Trade chart line icons. People characters with delivery parcel, money coins. Include Decreasing graph icons. For web, application. Vector. Chart financial growth decrease vectors Set of Accounting, 24 hours and Trade chart line icons. For design. Vector. Set of Accounting, 24 hours and Trade chart line icons. People characters with delivery parcel, money coins. Include Decreasing graph icons. For web, application. Vector
Free with trial Business Logo for chart, data, graph, reports, valuation. Vertical Blue Business / Visiting Card template. Vector EPS10 Abstract Template background. Chart financial growth decrease vectors Business Logo for chart, data, graph, reports, valuation. Vertical Blue Business / Visiting Card template
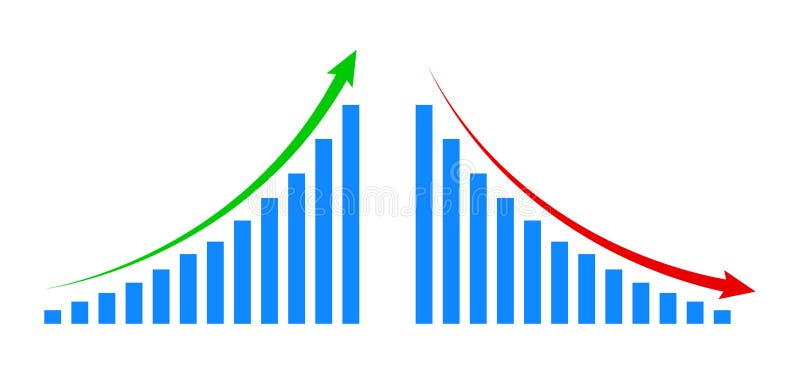
Free with trial A visual representation of data showing a decline over a period. The blue bars are arranged in descending order of height, each marked with numerical indicators, suggesting a decrease in value or quantity. Chart financial growth decrease illustrations Blue bar chart showing decreasing trend over time with numerical labels. A visual representation of data showing a decline over a period. The blue bars are arranged in descending order of height, each marked with numerical indicators, suggesting a decrease in value or quantity
Free with trial Vector Set of Finance icons related to Startup, Diagram chart and Bitcoin icons. UI phone app screens with teamwork. Graph chart, Credit card and Discount line symbols. Vector. Chart financial growth decrease vectors Vector Set of Finance icons related to Startup, Diagram chart and Bitcoin. Vector. Vector Set of Finance icons related to Startup, Diagram chart and Bitcoin icons. UI phone app screens with teamwork. Graph chart, Credit card and Discount line symbols. Vector
Free with trial Company Name Logo Design For chart, data, graph, reports, valuation. Blue and red Brand Name Design with place for Tagline. Abstract Creative Logo template for Small and Large Business. Chart financial growth decrease vectors Company Name Logo Design For chart, data, graph, reports, valuat
Free with trial Company Name Logo Design For chart, data, graph, reports, valuation. Purple and yellow Brand Name Design with place for Tagline. Creative Logo template for Small and Large Business. Chart financial growth decrease vectors Company Name Logo Design For chart, data, graph, reports, valuat
Free with trial Vector Set of Business icons related to Collagen skin, Toilet paper and Financial goal icons. Cash, Megaphone box and Fair trade signs. Puzzle, Reject file and Spanner. Verification person. Vector. Chart financial growth decrease vectors Vector Set of Business icons related to Collagen skin, Toilet paper and Financial goal. Vector. Vector Set of Business icons related to Collagen skin, Toilet paper and Financial goal icons. Cash, Megaphone box and Fair trade signs. Puzzle, Reject file and Spanner. Verification person. Vector
Free with trial Vector Set of Finance icons related to Startup, Diagram chart and Bitcoin icons. UI phone app screens with teamwork. Graph chart, Credit card and Discount line symbols. Vector. Chart financial growth decrease illustrations Vector Set of Finance icons related to Startup, Diagram chart and Bitcoin. Vector. Vector Set of Finance icons related to Startup, Diagram chart and Bitcoin icons. UI phone app screens with teamwork. Graph chart, Credit card and Discount line symbols. Vector