Free with trial Growth market icon design vector. Chart financial growth decrease vectors Growth market icon design
Free with trial Growth market icon design vector. Chart financial growth decrease vectors Growth market icon design
Free with trial Growth market icon design vector. Chart financial growth decrease vectors Growth market icon design
Free with trial Growth market icon design vector. Chart financial growth decrease vectors Growth market icon design
Free with trial Growth market icon design vector. Chart financial growth decrease vectors Growth market icon design
Free with trial Growth market icon design vector. Chart financial growth decrease vectors Growth market icon design
Free with trial Growth market icon design vector. Chart financial growth decrease vectors Growth market icon design
Free with trial Growth market icon design vector. Chart financial growth decrease vectors Growth market icon design
Free with trial Growth market icon design vector. Chart financial growth decrease vectors Growth market icon design
Free with trial Growth market icon design vector. Chart financial growth decrease vectors Growth market icon design
Free with trial Growth market icon design vector. Chart financial growth decrease vectors Growth market icon design
Free with trial Growth market icon design vector. Chart financial growth decrease vectors Growth market icon design
Free with trial Growth market icon design vector. Chart financial growth decrease vectors Growth market icon design
Free with trial Growth market icon design vector. Chart financial growth decrease vectors Growth market icon design
Free with trial Growth market icon design vector. Chart financial growth decrease vectors Growth market icon design
Free with trial Growth market icon design vector. Chart financial growth decrease vectors Growth market icon design
Free with trial Growth market icon design vector. Chart financial growth decrease vectors Growth market icon design
Free with trial Growth market icon design vector. Chart financial growth decrease vectors Growth market icon design
Free with trial Growth market icon design vector. Chart financial growth decrease vectors Growth market icon design
Free with trial Growth market icon design vector. Chart financial growth decrease vectors Growth market icon design
Free with trial Liquid badges. Set of Diagram chart, Statistics timer and Saving money icons. Accounting report sign. Presentation graph, Growth chart, Piggy bank. Financial case. Gradient diagram chart icon. Chart financial growth decrease vectors Diagram chart, Statistics timer and Saving money icons. Accounting report sign. Vector. Liquid badges. Set of Diagram chart, Statistics timer and Saving money icons. Accounting report sign. Presentation graph, Growth chart, Piggy bank. Financial case. Gradient diagram chart icon
Free with trial Loss chart icon vector isolated on white background for your web and mobile app design, Loss chart logo concept. Chart financial growth decrease vectors Loss chart icon vector sign and symbol isolated on white background, Loss chart logo concept. Loss chart icon vector isolated on white background for your web and mobile app design, Loss chart logo concept
Free with trial Calculator alongside arrows indicating increase and decrease, and a line graph with fluctuations. Ideal for finance, budgeting, economics, analysis, statistics, decision-making, simple flat metaphor. Chart financial growth decrease illustrations Calculator with Arrows and Graph Representing Financial Analysis and Data Trends. Calculator alongside arrows indicating increase and decrease, and a line graph. Calculator alongside arrows indicating increase and decrease, and a line graph with fluctuations. Ideal for finance, budgeting, economics, analysis, statistics, decision-making, simple flat metaphor
Free with trial Three identical green downward-pointing arrows are displayed side-by-side against a black background. Each arrow features a white percent symbol (%) prominently displayed on its surface. The visual suggests a decrease in percentage, a sale, or a financial reduction. Chart financial growth decrease illustrations Three green downward arrows with percent symbols percentage. Three identical green downward-pointing arrows are displayed side-by-side against a black background. Each arrow features a white percent symbol (%) prominently displayed on its surface. The visual suggests a decrease in percentage, a sale, or a financial reduction
Free with trial Business investment arrow up and down symbol on white background. finance exchange rates increase and decrease symbol. vector illustration flat design. Chart financial growth decrease vectors Business investment arrow up and down symbol on white background. finance exchange rates increase and decrease symbol. vector
Free with trial Diagram chart, Ssd and Logistics network line icons set. Infographic chart, financial data graphic. Copywriting network sign. Presentation graph, Memory disk, International tracking. Vector. Chart financial growth decrease vectors Diagram chart, Ssd and Logistics network icons set. Copywriting network sign. Vector. Diagram chart, Ssd and Logistics network line icons set. Infographic chart, financial data graphic. Copywriting network sign. Presentation graph, Memory disk, International tracking. Vector
Free with trial Chart vector icon. Elements for mobile concept and web apps. Thin line icons for website design and development, app development. Premium pack. Chart financial growth decrease vectors Chart thin line vector icon. Chart vector icon. Elements for mobile concept and web apps. Thin line icons for website design and development, app development. Premium pack.
Free with trial This image shows a bar graph depicting a downward trend. A red arrow highlights the decrease in quarterly sales from Q1 to Q4, indicating negative growth and financial loss. Chart financial growth decrease illustrations Declining Bar Graph with Red Arrow Depicts Sales Performance. This image shows a bar graph depicting a downward trend. A red arrow highlights the decrease in quarterly sales from Q1 to Q4, indicating negative growth and financial loss.
Free with trial Help, cash out, debt, finance, loan Business Flow Chart Design with 3 Steps. Line Icon For Presentation Background Template Place for text. Vector EPS10 Abstract Template background. Chart financial growth decrease vectors Help, cash out, debt, finance, loan Business Flow Chart Design with 3 Steps. Line Icon For Presentation Background Template Place
Free with trial Bitcoin price increase decrease icon vector. Cryptocurrency market up down sign symbol - icon. Chart financial growth decrease vectors Bitcoin price increase decrease icon vector. Cryptocurrency market up down sign symbol
Free with trial Vector set of Customer satisfaction, Report diagram and Dot plot line icons set. UI phone app screens with line icons. Payment icon. Happy smile chart, Financial market, Presentation graph. Vector. Chart financial growth decrease vectors Vector set of Customer satisfaction, Report diagram and Dot plot line icons set. Vector. Vector set of Customer satisfaction, Report diagram and Dot plot line icons set. UI phone app screens with line icons. Payment icon. Happy smile chart, Financial market, Presentation graph. Vector
Free with trial Sales line icons. linear set. quality vector line set such as online sales, decrease, sale. Chart financial growth decrease vectors Sales line icons. linear set. quality vector line set such as online sales, decrease, sale
Free with trial Chart vector icon. Elements for mobile concept and web apps. Thin line icons for website design and development, app development. Premium pack. Chart financial growth decrease vectors Chart glyph flat vector icon. Chart vector icon. Elements for mobile concept and web apps. Thin line icons for website design and development, app development. Premium pack.
Free with trial Economic crisis which the economy has a sudden downturn and people get effect and cause financial crisis vector. Chart financial growth decrease vectors Economic crisis which the economy has a sudden downturn and people get effect and cause financial crisis
Free with trial 3D Rendering of financial icon floating on water piggy bank symbol on background concept of sunk cost finance. 3D render illustration cartoon. Chart financial growth decrease illustrations 3D Rendering of financial icon floating on water piggy bank symbol on background
Free with trial Green bar chart showing a downward trend with a down arrow graphic. Chart financial growth decrease vectors Green bar chart showing a downward trend with a down arrow graphic
Free with trial Set of Credit card, Bitcoin pay and Graph chart line icons. People characters with delivery parcel, money coins. Include Discounts ribbon icons. For web, application. Vector. Chart financial growth decrease vectors Set of Credit card, Bitcoin pay and Graph chart line icons. For design. Vector. Set of Credit card, Bitcoin pay and Graph chart line icons. People characters with delivery parcel, money coins. Include Discounts ribbon icons. For web, application. Vector
Free with trial Business graphics charts. Financial analysis data graphs and diagram, marketing statistic modern business presentation elements vector investment progress icon set. arrow bussines, arrow element. Chart financial growth decrease vectors Title: Business graphics, Arrow Business, Financial analysis data graphic. Business graphics charts. Financial analysis data graphs and diagram, marketing statistic modern business presentation elements vector investment progress icon set. arrow bussines, arrow element
Free with trial Vector illustration of sales increase and decrease data, data analysis, sales statistics, businessman, presentation. Chart financial growth decrease vectors Vector illustration of sales increase and decrease data, data analysis, sales statistics
Free with trial Chart vector icon. Elements for mobile concept and web apps. Thin line icons for website design and development, app development. Premium pack. Chart financial growth decrease vectors Chart glyph color vector icon. Chart vector icon. Elements for mobile concept and web apps. Thin line icons for website design and development, app development. Premium pack.
Free with trial Bitcoin chart icons set. Outline set of bitcoin chart vector icons neon color on black. Chart financial growth decrease illustrations Bitcoin chart icons set vector neon. Bitcoin chart icons set. Outline set of bitcoin chart vector icons neon color on black
Free with trial Bitcoin chart icons set. Outline set of bitcoin chart vector icons neon color on black. Chart financial growth decrease illustrations Bitcoin chart icons set vector neon. Bitcoin chart icons set. Outline set of bitcoin chart vector icons neon color on black
Free with trial Bitcoin chart icons set. Outline set of bitcoin chart vector icons neon color on black. Chart financial growth decrease vectors Bitcoin chart icons set vector neon. Bitcoin chart icons set. Outline set of bitcoin chart vector icons neon color on black
Free with trial 3D Rendering of financial icon floating on water candle stick bar graph symbol on background concept of sunk cost finance. 3D render illustration cartoon. Chart financial growth decrease illustrations 3D Rendering of financial icon floating on water candle stick bar graph symbol
Free with trial Colorful bar graph showing market analysis, financial report and accounting on a digital tablet. Generative AI. Chart financial growth decrease illustrations Colorful bar graph showing market analysis and financial report. Colorful bar graph showing market analysis, financial report and accounting on a digital tablet. Generative AI
Free with trial This image depicts a close-up of a hand using a pen to review detailed financial data, generated by AI. The image emphasizes precision and attention to detail in financial analysis. The cool blue tones enhance the professional and analytical nature of the task. Chart financial growth decrease illustrations Analyzing Financial Data. This image depicts a close-up of a hand using a pen to review detailed financial data, generated by AI. The image emphasizes precision and attention to detail in financial analysis. The cool blue tones enhance the professional and analytical nature of the task.
Free with trial Hot loan, Download arrow and Usd coins signs. Infographic timeline. Web traffic, Loan percent and Line chart line icons set. Website window, Discount, Financial graph. Discount offer. Vector. Chart financial growth decrease vectors Web traffic, Loan percent and Line chart icons set. Hot loan, Download arrow and Usd coins signs. Vector. Hot loan, Download arrow and Usd coins signs. Infographic timeline. Web traffic, Loan percent and Line chart line icons set. Website window, Discount, Financial graph. Discount offer. Vector
Free with trial Red Line Graph Showing Growth and Fluctuation on White Grid Paper, generative Ai. Chart financial growth decrease illustrations Red Line Graph Showing Growth and Fluctuation on White Grid Paper
Free with trial Economic growth concept with the business people. Chart financial growth decrease illustrations Economic growth concept with business people
Free with trial Data analytics ascending line chart icon in different style vector illustration. two colored and black data analytics ascending line chart vector icons designed in filled, outline, line and stroke. Chart financial growth decrease vectors Data analytics ascending line chart icon in different style vector illustration. two colored and black data analytics ascending
Free with trial Confirmed, Diagram graph and Report diagram icons simple set. Halftone dots button. Update data sign. Accepted message, Presentation chart, Financial market. Sales statistics. Education set. Vector. Chart financial growth decrease vectors Confirmed, Diagram graph and Report diagram icons set. Update data sign. Vector. Confirmed, Diagram graph and Report diagram icons simple set. Halftone dots button. Update data sign. Accepted message, Presentation chart, Financial market. Sales statistics. Education set. Vector
Free with trial Quality increase and cost optimization to improve efficiency and profit. Businessman with quality control growth graph and cost reduction, Effective business, Efficient Risk. Chart financial growth decrease vectors Quality increase and cost optimization to improve efficiency and profit. Businessman with quality control growth graph and cost
Free with trial Vector of Bad Business Growth. Perfect for business content, finance design, etc. Chart financial growth decrease vectors Vector of Bad Business Growth. Perfect for business content, finance design
Free with trial Money icon with arrows, capital decrease and increase, dollar rate increase, investment concept. Stock Vector illustration isolated. Chart financial growth decrease illustrations Money icon with arrows, capital decrease and increase, dollar rate increase, investment concept. Stock Vector illustration
Free with trial Money icon with arrows, capital decrease and increase, dollar rate increase, investment concept. Stock Vector illustration isolated. Chart financial growth decrease illustrations Money icon with arrows, capital decrease and increase, dollar rate increase, investment concept. Stock Vector illustration
Free with trial Magnifying glass focuses on a graphic pie chart over document, highlighting trends and potential insights Use for data analysis and business concept. Chart financial growth decrease illustrations Analyzing Graphic Pie Chart with Magnifying Glass for Insights. Magnifying glass focuses on a graphic pie chart over document, highlighting trends and potential insights Use for data analysis and business concept
Free with trial Education icons set. Included icon as 3d chart, Web mail, Stock analysis signs. Statistics timer, Rejected payment, Certificate symbols. Chemistry pipette, Messenger, Checklist line icons. Vector. Chart financial growth decrease vectors Education icons set. Included icon as 3d chart, Web mail, Stock analysis. Vector. Education icons set. Included icon as 3d chart, Web mail, Stock analysis signs. Statistics timer, Rejected payment, Certificate symbols. Chemistry pipette, Messenger, Checklist line icons. Vector
Free with trial Economic growth concept with the business people. Chart financial growth decrease illustrations Economic growth concept with business people
Free with trial Reduction chart icon set in thin line outline style and linear vector sign. Chart financial growth decrease vectors Reduction chart icon thin line illustration. Reduction chart icon set in thin line outline style and linear vector sign
Free with trial Red graph chart icon. Isometric of red graph chart vector icon for web design isolated on white background. Chart financial growth decrease vectors Red graph chart icon, isometric style. Red graph chart icon. Isometric of red graph chart vector icon for web design isolated on white background
Free with trial Reduction chart icon vector line logo mark or symbol set collection outline style. Chart financial growth decrease vectors Reduction chart icon thin line illustration. Reduction chart icon vector line logo mark or symbol set collection outline style
Free with trial International globe, Histogram and Diagram chart icons simple set. Graph chart, Stats and Algorithm signs. World networking, Economic trend. Education set. Line international globe icon. Vector. Chart financial growth decrease vectors International globe, Histogram and Diagram chart icons set. Graph chart, Stats and Algorithm signs. Vector. International globe, Histogram and Diagram chart icons simple set. Graph chart, Stats and Algorithm signs. World networking, Economic trend. Education set. Line international globe icon. Vector
Free with trial Decline chart icon. Concept of falling stock markets or declining profits in business. Simple black and white version from a series of business icons. Chart financial growth decrease vectors Decline chart icon. Concept of falling stock markets or declining profits in business. Simple black and white version
Free with trial Business investment graph arrow up and down background. trend stock market concept. trading exchange financial on blue background. vector illustration fantastic hi tech design. Chart financial growth decrease vectors Business investment graph arrow up and down background. trend stock market concept. trading exchange financial on blue background
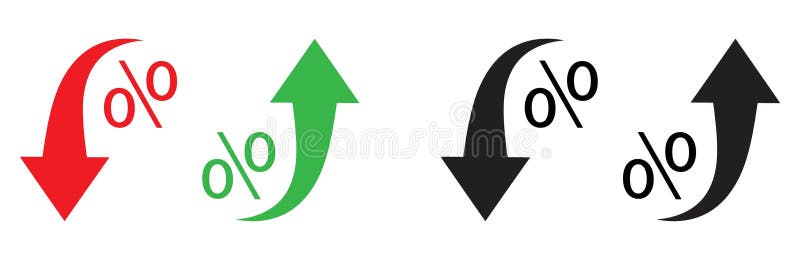
Free with trial Red and black arrows point downward, while green and black arrows point upward. Each arrow is curved, paired with a percentage symbol (%), indicating changes in rate or value. The red and black arrows denote decrease, and the green and black arrows denote increase, suggesting economic or statistical trends. The arrows and symbols are bold and stylized for emphasis. Chart financial growth decrease vectors Percent arrow icon. Growth, increase, decrease arrow filled icons. Up arrows, down arrows. Red and black arrows point downward, while green and black arrows point upward. Each arrow is curved, paired with a percentage symbol (%), indicating changes in rate or value. The red and black arrows denote decrease, and the green and black arrows denote increase, suggesting economic or statistical trends. The arrows and symbols are bold and stylized for emphasis.
Free with trial Inflation, deflation, money lost concept. Decrease graph with flying money on balloon. Profit lost, value reduce due to global financial economic recession. Chart financial growth decrease vectors Inflation, deflation, money lost concept. Decrease graph with flying money on balloon. Profit lost, value reduce due to global
Free with trial 3D Rendering of financial icon floating on water bank building symbol on background concept of sunk cost finance. 3D render illustration cartoon. Chart financial growth decrease illustrations 3D Rendering of financial icon floating on water bank building symbol on background
Free with trial Business chart is displaying market data analytics with a candlestick chart, pie chart and line graph. Chart financial growth decrease vectors Business chart displaying market data analytics with candlestick chart, pie chart and line graph
Free with trial Chart, data, graph, reports, valuation Icon Over Various Background. Line style design, designed for web and app. Eps 10 vector illustration. Vector EPS10 Abstract Template background. Chart financial growth decrease vectors Chart, data, graph, reports, valuation Icon Over Various Background. Line style design, designed for web and app. Eps 10 vector
Free with trial Vector Set of Finance icons related to Report document, Sale and Loyalty points icons. UI phone app screens with people. Accounting line symbols. Growth chart, Shopping tag, Bonus grows. Vector. Chart financial growth decrease vectors Vector Set of Finance icons related to Report document, Sale and Loyalty points. Vector. Vector Set of Finance icons related to Report document, Sale and Loyalty points icons. UI phone app screens with people. Accounting line symbols. Growth chart, Shopping tag, Bonus grows. Vector
Free with trial Vector Set of Education icons related to Dot plot, Refresh mail and Talk bubble icons. UI phone app screens with people. Growth chart line symbols. Presentation graph, New e-mail, Chat message. Vector. Chart financial growth decrease vectors Vector Set of Education icons related to Dot plot, Refresh mail and Talk bubble. Vector. Vector Set of Education icons related to Dot plot, Refresh mail and Talk bubble icons. UI phone app screens with people. Growth chart line symbols. Presentation graph, New e-mail, Chat message. Vector
Free with trial Credit card, Euro money and Bitcoin chart line icons set. Timeline process infograph. Report document sign. Loan percent, Cash, Cryptocurrency statistics. Growth chart. Finance set. Vector. Chart financial growth decrease vectors Credit card, Euro money and Bitcoin chart icons set. Report document sign. Vector. Credit card, Euro money and Bitcoin chart line icons set. Timeline process infograph. Report document sign. Loan percent, Cash, Cryptocurrency statistics. Growth chart. Finance set. Vector
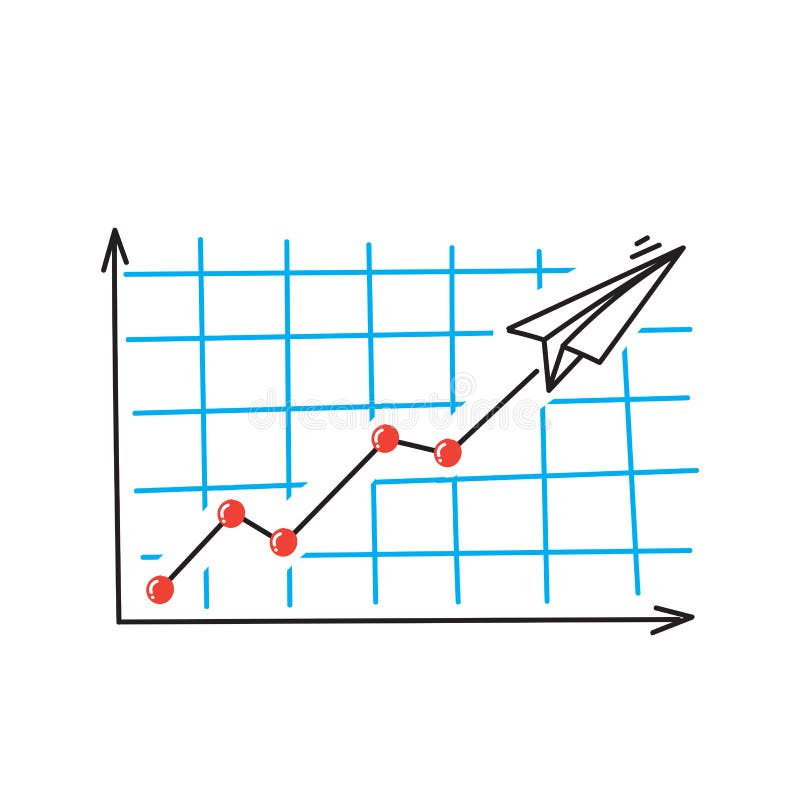
Free with trial Hand drawn doodle growth and drop graph like paper plane illustration vector icon. Chart financial growth decrease vectors Hand drawn doodle growth and drop graph like paper plane illustration vector
Free with trial Hand drawn doodle growth and drop graph like paper plane illustration vector sketch. Chart financial growth decrease vectors Hand drawn doodle growth and drop graph like paper plane illustration vector
Free with trial Hand drawn doodle growth and drop graph like paper plane illustration vector icon. Chart financial growth decrease vectors Hand drawn doodle growth and drop graph like paper plane illustration vector
Free with trial Doodle style bar and line graph icon representing growth and analytics. Chart financial growth decrease vectors Doodle style bar and line graph icon representing growth and analytics
Free with trial Man Views Red Green Financial Data On Screen At Desk For Analysis , monochrome style. Chart financial growth decrease illustrations Man Views Red Green Financial Data On Screen At Desk For Analysis
Free with trial The growth and decline concept with businessmen. Chart financial growth decrease illustrations The growth and decline concept with businessmen
Free with trial The growth and decline concept with businessmen. Chart financial growth decrease illustrations The growth and decline concept with businessmen
Free with trial The growth and decline concept with businessmen. Chart financial growth decrease illustrations The growth and decline concept with businessmen