Free with trial A series of seven golden bars, arranged in descending order of height, form a bar chart on a white background. The bars are smooth and reflective, suggesting a metallic material. This visual representation clearly depicts a downward trend or a decline, commonly associated with financial losses, economic recession, or negative performance. Chart financial growth decrease illustrations Golden Bar Chart Illustrating a Downward Trend on a White Background graph financial. A series of seven golden bars, arranged in descending order of height, form a bar chart on a white background. The bars are smooth and reflective, suggesting a metallic material. This visual representation clearly depicts a downward trend or a decline, commonly associated with financial losses, economic recession, or negative performance
Free with trial Stylized business chart icon depicting financial growth, percentage, and decline. Flat design, blue outline with light blue fill, minimalistic style. Chart financial growth decrease vectors Business chart icon showing growth, percentage, and decline in a simple outlined style. Stylized business chart icon depicting financial growth, percentage, and decline. Flat design, blue outline with light blue fill, minimalistic style.
Free with trial Vibrant financial chart illustrates stock market trends and trading activity. Showcasing investment dynamics with percentage values command signals and statistic data display. Chart financial growth decrease illustrations Vibrant financial chart illustrates stock market trends and trading activity. Showcasing investment dynamics with percentage
Free with trial Abstract 3D bar chart with a downward trending arrow, representing financial data and market decline, set against a neutral background. Chart financial growth decrease illustrations 3D bar chart showing financial decline with downward trend. Abstract 3D bar chart with a downward trending arrow, representing financial data and market decline, set against a neutral background
Free with trial Financial chart arrows. Colored trend lines. Market direction indicators. Vector graph elements. EPS 10. Chart financial growth decrease vectors Financial chart arrows. Colored trend lines. Market direction indicators. Vector graph elements
Free with trial A minimalist black bar chart icon isolated on a clean white background. This simple graphic features three vertical bars of different heights resting on a horizontal axis, visually representing data, statistics, and comparative information. Ideal for illustrating business performance, financial reports, market trends, analytics, or any concept related to growth, decline, and quantitative analysis in presentations, websites, applications, and infographics. Its clean, flat design makes it versatile for various digital and print media. Chart financial growth decrease vectors Minimalist Bar Chart Icon for Data Analysis and Statistics. A minimalist black bar chart icon isolated on a clean white background. This simple graphic features. A minimalist black bar chart icon isolated on a clean white background. This simple graphic features three vertical bars of different heights resting on a horizontal axis, visually representing data, statistics, and comparative information. Ideal for illustrating business performance, financial reports, market trends, analytics, or any concept related to growth, decline, and quantitative analysis in presentations, websites, applications, and infographics. Its clean, flat design makes it versatile for various digital and print media.
Free with trial The image shows two bar charts side by side, each representing different financial trends. The chart on the left, depicted in green, shows an upward trend with increasing bar heights and an upward-pointing arrow, indicating growth. The chart on the right, depicted in red, shows a downward trend with decreasing bar heights and a downward-pointing arrow, indicating decline. Both charts use a 3D. Chart financial growth decrease illustrations Contrasting trends in financial growth and decline charts. The image shows two bar charts side by side, each representing different financial trends. The chart on the left, depicted in green, shows an upward trend with increasing bar heights and an upward-pointing arrow, indicating growth. The chart on the right, depicted in red, shows a downward trend with decreasing bar heights and a downward-pointing arrow, indicating decline. Both charts use a 3D
Free with trial Bar graph showing a downward trend, business decline, economic decrease, market analysis, financial chart. Chart financial growth decrease vectors Bar chart with downward trend arrow business decline graph. Bar graph showing a downward trend, business decline, economic decrease, market analysis, financial chart
Free with trial Easel holds a financial chart showing upward green and downward red arrows. Chart financial growth decrease vectors Easel Displaying Financial Chart With Green And Red Arrows. Easel holds a financial chart showing upward green and downward red arrows
Free with trial Icons representing financial growth, decline, and trends. Perfect for business presentations and data visualization design. Chart financial growth decrease illustrations Four business growth and decline bar chart icons with arrows. Icons representing financial growth, decline, and trends. Perfect for business presentations and data visualization design
Free with trial Financial growth and decline icon set with stacked coins and arrows design. Chart financial growth decrease illustrations Financial growth and decline icon set with stacked coins and arrows
Free with trial A business report illustration featuring a graph and chart, ideal for presentations and documents, conveying financial data and analysis in a clear and concise manner. Chart financial growth decrease vectors Illustration of business report with graph and chart, showcasing financial data and analysis for presentations and documents. A business report illustration featuring a graph and chart, ideal for presentations and documents, conveying financial data and analysis in a clear and concise manner
Free with trial A 3D illustration of a stack of golden coins with an decrease and increase arrow graph, symbolizing financial growth and success. financial freedom, wealth management, economic growth, Financial Growth, Growing Wealth. Chart financial growth decrease vectors Ggrowing wealth financial success, rising profits investment. A 3D illustration of a stack of golden coins with an decrease and increase arrow graph, symbolizing financial growth and success. financial freedom, wealth management, economic growth, Financial Growth, Growing Wealth
Free with trial A stock market chart analysis with a downward trend arrow, illustrating financial decline, economic downturn, and investment risk in a clear visual manner. Chart financial growth decrease vectors Vector art of stock market chart analysis with downward trend arrow indicating financial decline and economic downturn. A stock market chart analysis with a downward trend arrow, illustrating financial decline, economic downturn, and investment risk in a clear visual manner
Free with trial Colorful line chart is fluctuating, showing market volatility and growth. Chart financial growth decrease vectors Gradient line chart showing market volatility and growth. Colorful line chart is fluctuating, showing market volatility and growth
Free with trial Colorful bar chart visualizing business data, financial growth, and market analysis with a retro aesthetic. Chart financial growth decrease illustrations Colorful geometric bar chart displaying data visualization progress. Colorful bar chart visualizing business data, financial growth, and market analysis with a retro aesthetic
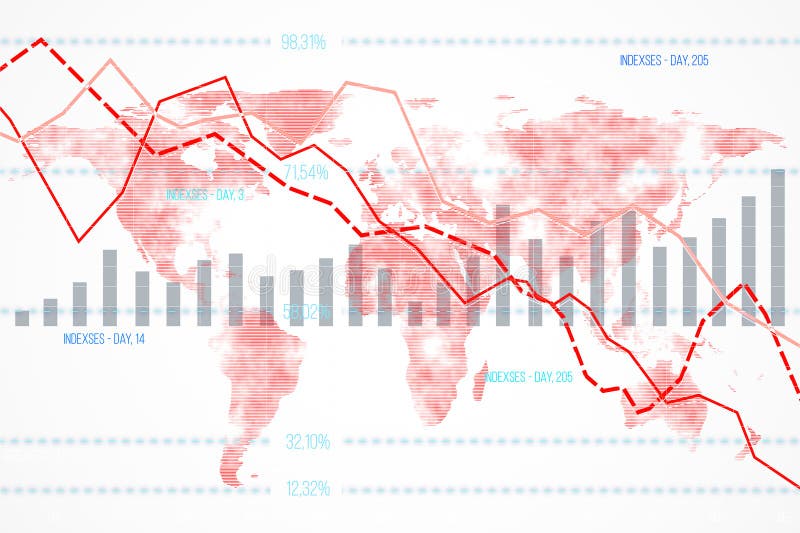
Free with trial Financial data chart featuring declining indexes and bar graphs overlaid on a world map background. Concept of global economic downturn. 3D Rendering. Chart financial growth decrease illustrations Financial data chart with declining indexes on a world map background. 3D Rendering. Financial data chart featuring declining indexes and bar graphs overlaid on a world map background. Concept of global economic downturn. 3D Rendering
Free with trial This creative image features a tilted angle view of coins stacked to depict financial growth while a businessman rushes past, reflecting the dynamic nature of the economy. Chart financial growth decrease illustrations Financial Growth Concept with Coins and Businessman on Tilted Angle. This creative image features a tilted angle view of coins stacked to depict financial growth while a businessman rushes past, reflecting the dynamic nature of the economy
Free with trial An abstract 3D bar chart showing growth and decline trend in silver and yellow colors. Chart financial growth decrease illustrations Growth and decline concept using 3D bar chart in silver and yellow colors. An abstract 3D bar chart showing growth and decline trend in silver and yellow colors
Free with trial Indian economy recession concept with a falling graph and chart. financial crisis and market crash. business downturn and economic decline. india rupee symbol. investment loss and risk. Chart financial growth decrease illustrations India economy recession concept falling graph chart indian rupee symbol financial crisis market crash business down turn. indian economy recession concept with a falling graph and chart. financial crisis and market crash. business downturn and economic decline. india rupee symbol. investment loss and risk
Free with trial A vertical bar graph displays monthly service reach statistics with six colored sections representing different months, showing service growth from approximately $20,000 to $30,000 in the first quarter, fluctuations between 1,500 and 2,500 in the second quarter, a decrease followed by slight recovery in service requests during the third quarter, and a significant increase from around 3,500 to 4,. Chart financial growth decrease illustrations Business growth bar chart showing monthly service reach statistics with colorful data visualization and performance metrics. A vertical bar graph displays monthly service reach statistics with six colored sections representing different months, showing service growth from approximately $20,000 to $30,000 in the first quarter, fluctuations between 1,500 and 2,500 in the second quarter, a decrease followed by slight recovery in service requests during the third quarter, and a significant increase from around 3,500 to 4,
Free with trial Financial graph with candlestick chart and world map on a light background. Concept of global business and finance. 3D Rendering. Chart financial growth decrease illustrations Financial graph with candlestick chart and world map on light background. 3D Rendering. Financial graph with candlestick chart and world map on a light background. Concept of global business and finance. 3D Rendering
Free with trial Financial concept with upward and downward arrows and stock chart background. Chart financial growth decrease illustrations Financial concept with upward and downward arrows and stock chart background
Free with trial A person in a blue shirt is analyzing cost reduction strategies using a laptop computer A financial chart highlights decreasing costs symbolized by a downward trending red line and green bars indicating financial performance The image conveys themes of business success financial efficiency and strategic cost management in a digital age The focus on technology and financial analysis is evident. Chart financial growth decrease illustrations Analyzing Cost Reduction Strategy with Laptop and Financial Chart Showing Decreasing Costs for Business Success and Efficiency. A person in a blue shirt is analyzing cost reduction strategies using a laptop computer A financial chart highlights decreasing costs symbolized by a downward trending red line and green bars indicating financial performance The image conveys themes of business success financial efficiency and strategic cost management in a digital age The focus on technology and financial analysis is evident
Free with trial Red bars drop steadily, showing sharp decrease in values.. Ends with money pouch symbol, hinting at spending cuts or loss.. Clean, bold design emphasizes downward financial trend. Chart financial growth decrease vectors Declining bar chart with money bag icon illustrating financial downturn or budget reduction concept. Red bars drop steadily, showing sharp decrease in values.. Ends with money pouch symbol, hinting at spending cuts or loss.. Clean, bold design emphasizes downward financial trend
Free with trial A vibrant and detailed bar chart with a line graph overlay, showcasing financial data trends over time. The chart features a variety of colors, including shades of green, purple, and blue, with data points marked by small diamond shapes. The background is a dark blue grid, providing a stark contrast to the colorful data visualization. Chart financial growth decrease illustrations Colorful bar chart and line graph representing financial data trends. A vibrant and detailed bar chart with a line graph overlay, showcasing financial data trends over time. The chart features a variety of colors, including shades of green, purple, and blue, with data points marked by small diamond shapes. The background is a dark blue grid, providing a stark contrast to the colorful data visualization
Free with trial This image features neon icons representing financial news, investment growth, stock market trends, and credit card transactions, ideal for business and finance themes. Chart financial growth decrease vectors Vector art of neon icons representing financial news, investment growth, stock market trends, and credit card transactions on a. This image features neon icons representing financial news, investment growth, stock market trends, and credit card transactions, ideal for business and finance themes
Free with trial A businessman interacting with a digital interface showing financial growth, time management, and investment strategies. It represents wealth management and business success. Time is money, invest wisely. Chart financial growth decrease illustrations Business investment strategy time is money financial growth and wealth management concept illustration. a businessman interacting with a digital interface showing financial growth, time management, and investment strategies. It represents wealth management and business success. Time is money, invest wisely.
Free with trial Line chart with bars and a red arrow going downwards to signify a financial decrease. Chart financial growth decrease vectors Declining stock market chart with red arrow indicating loss, economy crisis. Line chart with bars and a red arrow going downwards to signify a financial decrease.
Free with trial This 3D illustration depicts a financial report represented by a document with a bar chart and a line graph. The bar chart shows alternating red and blue bars, while a blue line graph with an upward arrow indicates a positive trend. A yellow and purple magnifying glass is positioned over the chart, suggesting analysis and scrutiny. The artwork is set against a subtle light purple background. Chart financial growth decrease illustrations 3D illustration of a financial report with a magnifying glass and bar chart on a light purple background. This 3D illustration depicts a financial report represented by a document with a bar chart and a line graph. The bar chart shows alternating red and blue bars, while a blue line graph with an upward arrow indicates a positive trend. A yellow and purple magnifying glass is positioned over the chart, suggesting analysis and scrutiny. The artwork is set against a subtle light purple background
Free with trial Growth and decline bar chart icon illustration. Upward and downward arrow graph symbol. Business up and down trend concept. Chart financial growth decrease vectors Growth and decline bar chart icon. Upward and downward arrow graph symbol. Business up and down trend concept
Free with trial Modern icon set featuring financial growth and decline symbols for business analysis. Chart financial growth decrease vectors Modern icon set featuring financial growth and decline symbols for business analysis
Free with trial The image shows an easel holding a white poster with a blue bar and line chart. The chart depicts a series of vertical bars that gradually decrease in height, accompanied by a line graph that rises initially and then declines. The easel is positioned on a plain, light-colored background, emphasizing the visual data presentation on the poster. Chart financial growth decrease illustrations Easel displaying a bar and line chart illustrating financial or data trends. The image shows an easel holding a white poster with a blue bar and line chart. The chart depicts a series of vertical bars that gradually decrease in height, accompanied by a line graph that rises initially and then declines. The easel is positioned on a plain, light-colored background, emphasizing the visual data presentation on the poster
Free with trial A dramatic red stock market chart showing a significant downturn. it illustrates a financial crisis, economic recession, or a major market crash. a visual representation of loss and investment risk. Chart financial growth decrease illustrations Stock market crash financial crisis economic recession downtrend chart red graph business loss investment. a dramatic red stock market chart showing a significant downturn. it illustrates a financial crisis, economic recession, or a major market crash. a visual representation of loss and investment risk.
Free with trial This vector illustration shows a financial chart with green bar graphs, arrows indicating downfalls, a dollar coin and money bag. It conveys a financial concept. Chart financial growth decrease vectors Financial Chart Showing Market Trends with Dollar Signs and Green Arrows. This vector illustration shows a financial chart with green bar graphs, arrows indicating downfalls, a dollar coin and money bag. It conveys a financial concept.
Free with trial The image depicts two sets of bar graphs with upward and downward arrows, illustrating contrasting financial trends. The left side shows a positive growth trend with increasing green bars and upward arrows, while the right side displays a mix of declining and rising red bars with both downward and upward arrows, indicating volatility or mixed performance in financial metrics. Chart financial growth decrease illustrations Contrasting trends in financial growth and decline through bar and arrow graphics. The image depicts two sets of bar graphs with upward and downward arrows, illustrating contrasting financial trends. The left side shows a positive growth trend with increasing green bars and upward arrows, while the right side displays a mix of declining and rising red bars with both downward and upward arrows, indicating volatility or mixed performance in financial metrics
Free with trial The image shows a striking red zigzag arrow pointing downward, symbolizing a sharp decline or downward trend. The arrow is bold and visually emphasizes the concept of a decrease, often used in financial, economic, or performance contexts to represent falling values, losses, or negative growth. Chart financial growth decrease illustrations A bold downward zigzag arrow indicating a significant decline or decrease trend. The image shows a striking red zigzag arrow pointing downward, symbolizing a sharp decline or downward trend. The arrow is bold and visually emphasizes the concept of a decrease, often used in financial, economic, or performance contexts to represent falling values, losses, or negative growth
Free with trial A financial graph displays growth using stacked segments made from black tire treads. The graph is on a dark, textured surface that enhances the design. Chart financial growth decrease illustrations Financial graph made of black rubber tire treads shows growth trend on a dark surface. A financial graph displays growth using stacked segments made from black tire treads. The graph is on a dark, textured surface that enhances the design
Free with trial Growth and decline bar chart icon illustration. Upward and downward arrow graph symbol. Business up and down trend concept in black circle. Chart financial growth decrease vectors Growth and decline bar chart icon. Upward and downward arrow graph symbol. Business up and down trend concept in black circle
Free with trial This image depicts a central golden dollar sign symbolizing financial aspects, flanked by a red downward arrow indicating a decline and a green upward arrow showing growth. Additionally, a pie chart with three segments in different colors suggests analysis or distribution of financial data. Chart financial growth decrease illustrations Visual representation of economic fluctuations and financial performance metrics. This image depicts a central golden dollar sign symbolizing financial aspects, flanked by a red downward arrow indicating a decline and a green upward arrow showing growth. Additionally, a pie chart with three segments in different colors suggests analysis or distribution of financial data
Free with trial Colorful bar chart analysis: growth, trends, and data visualization on a wooden table ,Generative ai. Chart financial growth decrease illustrations Colorful bar chart data analysis, visualizing growth trends and performance on a wooden table. Colorful bar chart analysis: growth, trends, and data visualization on a wooden table ,Generative ai
Free with trial 3D bar and line chart showing stock market performance with percentage gains and candlestick patterns. Chart financial growth decrease vectors Financial stock market growth chart with percentage gains and candlestick indicators. 3D bar and line chart showing stock market performance with percentage gains and candlestick patterns
Free with trial A 3D bar chart and a partial pie chart illustrating data and growth, with percentage labels, on a white background. Chart financial growth decrease illustrations 3D Bar Chart and Pie Chart Showing Growth and Data Analysis on White Background graph statistics. A 3D bar chart and a partial pie chart illustrating data and growth, with percentage labels, on a white background
Free with trial Colorful business charts and graphs showing financial growth, data analysis, and stock market trends, ideal for corporate presentations and reports. Chart financial growth decrease illustrations Business data analysis charts graphs financial growth stock market trend generative ai. colorful business charts and graphs showing financial growth, data analysis, and stock market trends, ideal for corporate presentations and reports.
Free with trial Person analyzes growth chart, market trends, financial data, stock exchange, investment portfolio,Generative AI. Chart financial growth decrease illustrations Business person analyzes growth charts, market trends, and financial data on an interactive screen. Person analyzes growth chart, market trends, financial data, stock exchange, investment portfolio,Generative AI
Free with trial This image depicts a bar chart transitioning from green to red bars, representing a shift from positive growth to decline. Overlaid green and red line graphs emphasize the upward trend followed by a downward trend, symbolizing financial success turning into loss, often seen in market analysis or business performance evaluations. Chart financial growth decrease vectors Graphic illustration of financial growth and subsequent decline using bar and line charts. This image depicts a bar chart transitioning from green to red bars, representing a shift from positive growth to decline. Overlaid green and red line graphs emphasize the upward trend followed by a downward trend, symbolizing financial success turning into loss, often seen in market analysis or business performance evaluations
Free with trial The image shows a person holding a tablet displaying a bar chart with two distinct data sets, one in red and one in blue, indicating a comparison of metrics or trends. The person appears to be in an office environment, possibly analyzing financial or business data, suggesting a focus on performance metrics or market analysis. Chart financial growth decrease illustrations Professional analyzing financial growth trends on a digital tablet in an office setting. The image shows a person holding a tablet displaying a bar chart with two distinct data sets, one in red and one in blue, indicating a comparison of metrics or trends. The person appears to be in an office environment, possibly analyzing financial or business data, suggesting a focus on performance metrics or market analysis
Free with trial This is an detailed collection of financial icons depicting various stock market trends, growth curves, and data analysis patterns. Chart financial growth decrease vectors Financial data and stock market trend line icons set showing growth and volatility curves. This is an detailed collection of financial icons depicting various stock market trends, growth curves, and data analysis patterns
Free with trial Man pointing at declining chart in office symbolizing loss and economic downturn in business strategy a man pointing at a declining chart ,Generative ai. Chart financial growth decrease illustrations Businessman Pointing at Declining Chart Showing Negative Growth in Financial Analysis Presentation Businessman. Man pointing at declining chart in office symbolizing loss and economic downturn in business strategy a man pointing at a declining chart ,Generative ai
Free with trial Financial chart with bull and bear in stock market on white color background. Chart financial growth decrease illustrations Financial chart with bull and bear in stock market
Free with trial This vector illustration shows icons representing financial growth and decline concepts such as profits, losses, success, and failure using coins, arrows, and people with clear black shapes. The style is simple and effective, conveying economic mood. Generative AI. Chart financial growth decrease vectors Financial growth decline icons economic success failure money coins profits losses vector illustration. This vector illustration shows icons representing financial growth and decline concepts such as profits, losses, success, and failure using coins, arrows, and people with clear black shapes. The style is simple and effective, conveying economic mood. Generative AI
Free with trial A 3D render of several red and green Japanese candlestick chart bars arranged in a staggered pattern against a white background. The red bars represent a decrease in value, while the green bars indicate an increase. This visual metaphor is commonly used in financial markets to depict price movements and trading trends. Chart financial growth decrease illustrations Red and Green Japanese Candlestick Chart Bars Representing Financial Market Trends stock market. A 3D render of several red and green Japanese candlestick chart bars arranged in a staggered pattern against a white background. The red bars represent a decrease in value, while the green bars indicate an increase. This visual metaphor is commonly used in financial markets to depict price movements and trading trends
Free with trial A grid of thin line icons illustrating business growth and financial concepts, featuring charts, graphs, money symbols, and people. Chart financial growth decrease illustrations Business Growth and Financial Analytics Icon Collection with Charts and Money Keywords: business, growth, finance, analytics. A grid of thin line icons illustrating business growth and financial concepts, featuring charts, graphs, money symbols, and people
Free with trial Financial Data Chart Analysis with Glowing Stock Market Uptrend Graph in Blue and Orange Colors, Generated by AI. Chart financial growth decrease illustrations Financial Data Chart Analysis with Glowing Stock Market Uptrend Graph in Blue and Orange Colors
Free with trial Stack of coins with upward arrow, symbolizing growth, savings, investment, and financial success ,Generative ai. Chart financial growth decrease illustrations Ascending arrow on coin stack, visualizing financial growth, investment, savings, and wealth building. Stack of coins with upward arrow, symbolizing growth, savings, investment, and financial success ,Generative ai
Free with trial A stack of gold bars against a stock market chart, symbolizing investment opportunities, financial trading, and wealth creation in a volatile market. Chart financial growth decrease illustrations Gold bars and stock market chart showing investment opportunity and financial trading strategy insight. A stack of gold bars against a stock market chart, symbolizing investment opportunities, financial trading, and wealth creation in a volatile market.
Free with trial Dynamic stock market chart illuminates dark trading room reflects financial volatility. Red line graph shows fluctuations. Trader analyzes data on multiple screens. Global financial. Chart financial growth decrease illustrations Dynamic stock market chart illuminates dark trading room, reflects financial volatility. Red line graph shows fluctuations. Dynamic stock market chart illuminates dark trading room reflects financial volatility. Red line graph shows fluctuations. Trader analyzes data on multiple screens. Global financial.
Free with trial Line art business trend icons set featuring growth and decline bar charts for financial data visualization. Chart financial growth decrease vectors Line art business trend icons set featuring growth and decline bar charts for financial data visualization
Free with trial Minimal black and white financial loss icon with stacked coins, dollar symbol, and downward arrow representing revenue decline, business loss, and market downturn. Ideal for fintech apps, analytics dashboards, and financial UI. Chart financial growth decrease illustrations Financial Loss Icon Vector, Business Decline and Revenue Drop, Money Decrease Chart with Coins and Dollar Symbol, Market Downtrend. Minimal black and white financial loss icon with stacked coins, dollar symbol, and downward arrow representing revenue decline, business loss, and market downturn. Ideal for fintech apps, analytics dashboards, and financial UI
Free with trial Line art business graphs set featuring financial growth and decline with dollar signs for economic performance. Chart financial growth decrease vectors Line art business graphs set featuring financial growth and decline with dollar signs for economic performance
Free with trial Hand drawn line art illustration of financial analysis depicting growth and market trends for business strategy. Chart financial growth decrease vectors Hand drawn line art illustration of financial analysis depicting growth and market trends for business strategy
Free with trial Visualizing india's economic downturn with a stock market crash chart. the red graph highlights financial recession, data analysis, and downward trends on the map, indicating a crisis situation. Chart financial growth decrease illustrations India economic crisis stock market crash concept financial recession chart graph down trend analysis data map. visualizing india's economic downturn with a stock market crash chart. the red graph highlights financial recession, data analysis, and downward trends on the map, indicating a crisis situation.
Free with trial Three dimensional blue arrows and plus sign representing growth, progress, increase, decrease, statistics, data analysis, business, finance, charts, and trends. Chart financial growth decrease vectors Three dimensional blue arrows and plus sign symbolizing growth progress increase decrease statistics data analysis. Three dimensional blue arrows and plus sign representing growth, progress, increase, decrease, statistics, data analysis, business, finance, charts, and trends
Free with trial A professional set of icons depicting various data chart types, including exponential growth, volatility, and linear trends for business analytics and reporting. Chart financial growth decrease illustrations Collection of professional data graph icons illustrating different growth patterns and financial statistics trends. a professional set of icons depicting various data chart types, including exponential growth, volatility, and linear trends for business analytics and reporting
Free with trial Metallic percentage symbol resting atop financial charts. Evokes concepts of interest, discounts, growth, or decline. Great for business, finance, or sales themes. Chart financial growth decrease illustrations Metallic percentage symbol resting atop financial charts. Evokes concepts of interest, discounts, growth, or decline. Great for
Free with trial Visualize complex market trends and strategy using this metallic, AI-generated bar chart illustration. Perfect for financial reports, planning presentations, and investor materials that require a sophisticated, high-impact visual representation of business growth, decline, and future success. Chart financial growth decrease illustrations Conceptual 3D business bar chart illustrating market performance, showing initial decline followed by upward growth. Visualize complex market trends and strategy using this metallic, AI-generated bar chart illustration. Perfect for financial reports, planning presentations, and investor materials that require a sophisticated, high-impact visual representation of business growth, decline, and future success.
Free with trial Business analytics icon depicting price fluctuations in economic market data, financial growth concept. Chart financial growth decrease vectors Financial candlestick chart illustrating market trend for investment, stock trading data analysis. Isolated digital graphic. Business analytics icon depicting price fluctuations in economic market data, financial growth concept.
Free with trial A close up view of golden digital currency coins on a financial candlestick chart. this image represents the volatility and trading patterns of the modern cryptocurrency market and global economy. Chart financial growth decrease vectors Golden digital currency coins placed over a financial candlestick chart showing market volatility and trading trends. a close up view of golden digital currency coins on a financial candlestick chart. this image represents the volatility and trading patterns of the modern cryptocurrency market and global economy
Free with trial Business hand touching the turning point from growth to crash on a digital stock market graph, financial crisis concept. Generative AI. Chart financial growth decrease illustrations Business hand touching the turning point from growth to crash on a digital stock market graph financial crisis concept
Free with trial Golden coin stacks decrease in height. Red arrow shows downward trend. Financial loss and economic downturn illustration. Minimalist design depicts, budget cut. Chart financial growth decrease illustrations Golden coin stacks decrease in height. Red arrow shows downward trend. Financial loss and economic downturn illustration.
Free with trial Simple icon of a businessman analyzing a falling financial graph with a pie chart. Chart financial growth decrease illustrations Businessman analyzing falling financial graph with pie chart icon. Simple icon of a businessman analyzing a falling financial graph with a pie chart
Free with trial Falling red arrow superimposed on a bar graph showing business decline negative growth insolvency financial crisis Can be used as a banner or header image. Chart financial growth decrease illustrations Falling red arrow superimposed on a bar graph showing business decline , negative growth, insolvency, financial crisis. Falling red arrow superimposed on a bar graph showing business decline negative growth insolvency financial crisis Can be used as a banner or header image
Free with trial This image showcases a businessman illustrating the concept of cost reduction and profit growth holding graphic elements that represent financial data analysis market performance and strategic planning The composition suggests a focus on improving business outcomes through careful financial management and investment decisions leading to increased profitability and overall success in competitive. Chart financial growth decrease illustrations Cost reduction and profit growth strategy depicted by businessman with graphic elements indicating financial performance and. This image showcases a businessman illustrating the concept of cost reduction and profit growth holding graphic elements that represent financial data analysis market performance and strategic planning The composition suggests a focus on improving business outcomes through careful financial management and investment decisions leading to increased profitability and overall success in competitive
Free with trial Striking AI-generated visualization of a sharp financial crisis. This 3D render, featuring a bar chart and a glowing downward arrow, clearly communicates economic distress and market volatility, providing essential data imagery for investors and businesses tracking performance decline. Chart financial growth decrease illustrations Conceptual 3D bar chart illustrating drastic market collapse and financial loss with a glowing downward arrow on a neutral backgro. Striking AI-generated visualization of a sharp financial crisis. This 3D render, featuring a bar chart and a glowing downward arrow, clearly communicates economic distress and market volatility, providing essential data imagery for investors and businesses tracking performance decline.
Free with trial Graphic representation of declining business. Bar chart shows falling trend. Arrow points downwards. Silhouettes of people signify workforce reduction. Concept for economic downturn, negative growth, or company challenges. Chart financial growth decrease illustrations Declining bar chart with downward arrow and silhouettes of people representing decrease in workforce or business performance loss. Graphic representation of declining business. Bar chart shows falling trend. Arrow points downwards. Silhouettes of people signify workforce reduction. Concept for economic downturn, negative growth, or company challenges
Free with trial A clean, minimalist bar chart displays a gradual decline in financial performance, with rising bars depicted in soft blue against a serene teal background. Chart financial growth decrease illustrations Minimalist financial bar chart illustrating gradual decline in economic performance. A clean, minimalist bar chart displays a gradual decline in financial performance, with rising bars depicted in soft blue against a serene teal background.
Free with trial This image features colorful 3D bar graphs representing both growth and decline trends, ideal for business analytics and financial performance visualizations. Chart financial growth decrease illustrations Colorful 3D Bar Graphs Displaying Growth and Decline Trends in Business Analytics and Financial Performance on a Clean White. This image features colorful 3D bar graphs representing both growth and decline trends, ideal for business analytics and financial performance visualizations
Free with trial A vibrant 3D bar graph illustration shows financial growth trends with colorful bars. Perfect for business presentations, analytics, and creative projects. Chart financial growth decrease illustrations Colorful 3D bar graph illustration depicting financial growth and performance trends with vibrant hues and clean modern design for. A vibrant 3D bar graph illustration shows financial growth trends with colorful bars. Perfect for business presentations, analytics, and creative projects
Free with trial Description: This abstract image depicts a financial stock market trading chart with a gold arrow pointing downwards on a blue background. The downtrend of the arrow symbolizes a decrease in stock prices or market performance. The contrasting colors and geometric shapes convey a sense of complexity and volatility in the financial market. This image can be used to represent concepts such as market analysis, investment strategies, and economic trends. Chart financial growth decrease illustrations Abstract Financial Stock Market Trading Chart with Gold Arrow Downtrend on Blue Background. Description: This abstract image depicts a financial stock market trading chart with a gold arrow pointing downwards on a blue background. The downtrend of the arrow symbolizes a decrease in stock prices or market performance. The contrasting colors and geometric shapes convey a sense of complexity and volatility in the financial market. This image can be used to represent concepts such as market analysis, investment strategies, and economic trends.