Free with trial No decline icon. Prohibition symbol with graph. Red and black warning. Financial growth concept. EPS 10. Chart financial growth decrease vectors No decline icon. Prohibition symbol with graph. Red and black warning. Financial growth concept.
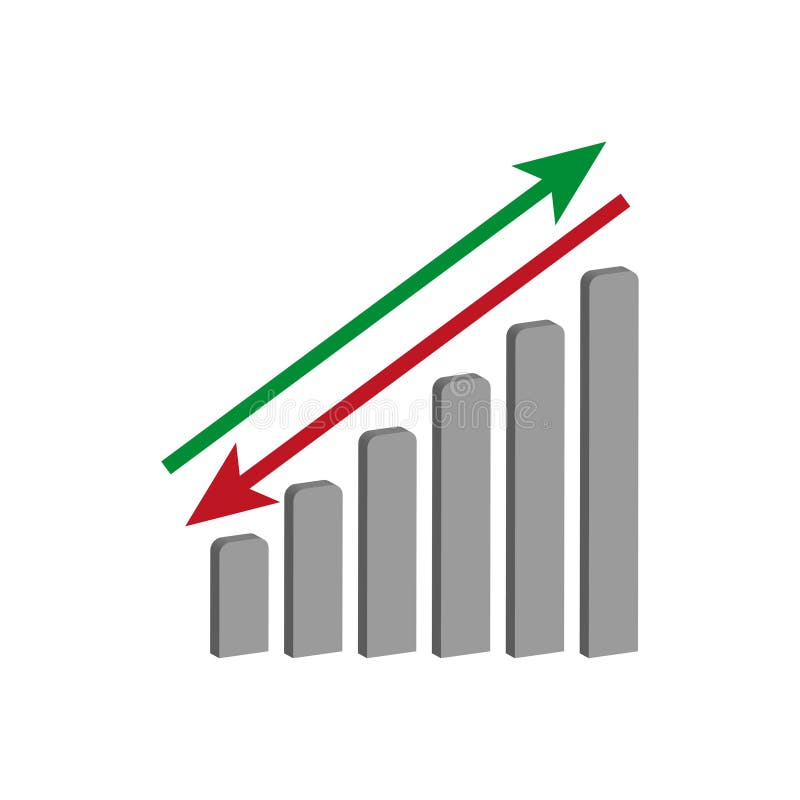
Free with trial Uptrend and downtrend business chart icon. Economic growth and decline symbol with green up and red down arrow vector. Chart financial growth decrease vectors Uptrend and downtrend business chart icon. Economic growth and decline symbol with green up and red down arrow
Free with trial Trend chart icon in circular outline. Growth and decline symbol. Up and down arrow with bar graph illustration. Chart financial growth decrease vectors Trend chart icon in circular outline. Growth and decline symbol. Up and down arrow with bar graph
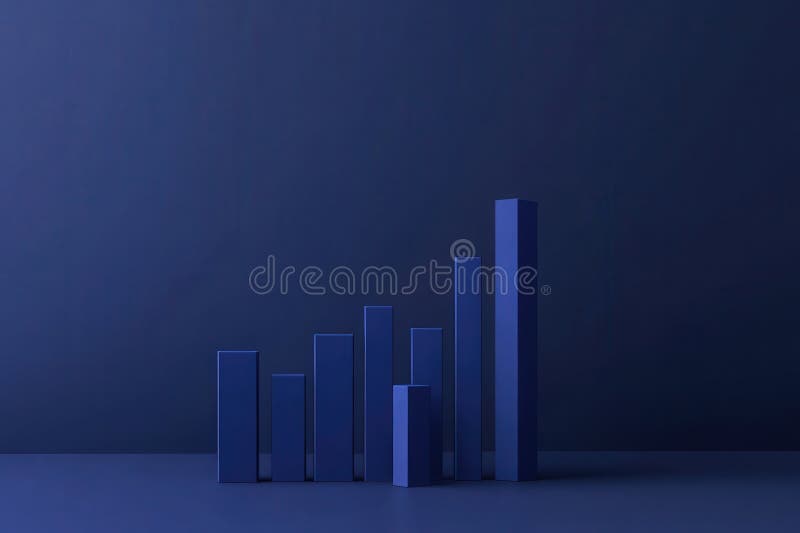
Free with trial The visual displays a clean and minimalist bar chart, illustrating a notable decrease in financial performance over a recent quarter, with a focus on dark blue tones to enhance impact. Chart financial growth decrease illustrations Minimalist financial bar chart showing significant decline in earnings over the past quarter. The visual displays a clean and minimalist bar chart, illustrating a notable decrease in financial performance over a recent quarter, with a focus on dark blue tones to enhance impact.
Free with trial Abstract green dotted financial graph chart sparkling background. Vector minimal tech design. Chart financial growth decrease vectors Abstract green dotted financial graph chart sparkling background
Free with trial Clean animated bar chart visualizing rising and falling market trends with green bars representing growth, profit, and positive performance, and red bars indicating decline, loss, and negative movement. Symbolizes financial volatility, stock market cycles, economic fluctuations, investment performance, and business analytics. Ideal for illustrating bullish and bearish phases, economic indicators, trading activity, and financial data visualization. Chart financial growth decrease illustrations Financial Market Trend Animation Showing Upturn and Downturn Phases. Clean animated bar chart visualizing rising and falling market trends with green bars. Clean animated bar chart visualizing rising and falling market trends with green bars representing growth, profit, and positive performance, and red bars indicating decline, loss, and negative movement. Symbolizes financial volatility, stock market cycles, economic fluctuations, investment performance, and business analytics. Ideal for illustrating bullish and bearish phases, economic indicators, trading activity, and financial data visualization.
Free with trial Abstract dotted financial graph chart sparkling background. Vector minimal tech design. Chart financial growth decrease vectors Abstract dotted financial graph chart sparkling background
Free with trial Stacks of golden coins arranged in ascending order, representing financial growth and investment. The background features a blurred stock market graph, symbolizing market trends and investment opportunities. The image conveys concepts of wealth accumulation, financial planning, and economic prosperity. Suitable for illustrating articles, presentations, or advertisements related to finance, investment, and business. Chart financial growth decrease illustrations Financial Growth and Investment
Free with trial Analyzing the business failure and decline. White magnifying glass analyzing a growth chart on a blue background, representing market analysis and business growth. 3D render. Chart financial growth decrease illustrations Magnifying glass analyzing growth chart on blue background. Analyzing the business failure and decline. White magnifying glass analyzing a growth chart on a blue background, representing market analysis and business growth. 3D render
Free with trial A 3D rendered illustration depicting business growth. The image showcases two upward-trending arrow charts, one in gold and the other in blue, representing positive trends, progress, and success. The charts are set against a clean, light background, emphasizing the upward movement and potential for financial gain. Suitable for illustrating economic growth, investment strategies, and business performance. Chart financial growth decrease illustrations Growth Chart with Arrows. A 3D rendered illustration depicting business growth. The image showcases two upward-trending arrow charts, one in gold and the other in blue, representing positive trends, progress, and success. The charts are set against a clean, light background, emphasizing the upward movement and potential for financial gain. Suitable for illustrating economic growth, investment strategies, and business performance.
Free with trial An abstract financial chart with a downward trend in blue, representing market decline, economic downturn, and potential investment risks in the stock market. Chart financial growth decrease illustrations Abstract financial chart with downward trend in blue. An abstract financial chart with a downward trend in blue, representing market decline, economic downturn, and potential investment risks in the stock market
Free with trial Hand of businessman point to the screen show financial market chart graphic. Stock market concept. By generative Ai. Chart financial growth decrease illustrations Hand of businessman point to the screen show financial market chart graphic. By generative Ai. Hand of businessman point to the screen show financial market chart graphic. Stock market concept. By generative Ai
Free with trial A 3D bar chart illustrating financial data with green bars indicating growth and red bars indicating decline, presented in a clean visual format for analysis. Chart financial growth decrease illustrations Bar chart growth and decline on. A 3D bar chart illustrating financial data with green bars indicating growth and red bars indicating decline, presented in a clean visual format for analysis
Free with trial A conceptual illustration showing a financial bar chart in a steep decline. Chart financial growth decrease vectors Declining Green Growth Bar Chart. A conceptual illustration showing a financial bar chart in a steep decline
Free with trial A clean, minimalist 3D render of a blue bar chart with a blue trend line connecting circular data points. The bars vary in height, illustrating growth and fluctuations. The background is a bright, clean white, emphasizing the chart's elements. This graphic is ideal for representing financial data, business growth, market trends, statistics, and performance analysis in a modern and professional style. Chart financial growth decrease illustrations 3D Blue Bar Chart with Trend Line. A clean, minimalist 3D render of a blue bar chart with a blue trend line connecting circular data points. The bars vary in height, illustrating growth and fluctuations. The background is a bright, clean white, emphasizing the chart's elements. This graphic is ideal for representing financial data, business growth, market trends, statistics, and performance analysis in a modern and professional style.
Free with trial A stylized illustration depicts a bar chart with blue bars of varying heights against a dark blue grid background. A prominent red and yellow arrow, symbolizing a downward trend, dramatically descends across the chart. This graphic represents financial decline, market crash, economic recession, or negative growth. Its clean, vector-style design makes it suitable for presentations, reports, and articles on business, finance, and economics. Chart financial growth decrease illustrations Declining Bar Chart with Red Arrow. A stylized illustration depicts a bar chart with blue bars of varying heights against a dark blue grid background. A prominent red and yellow arrow, symbolizing a downward trend, dramatically descends across the chart. This graphic represents financial decline, market crash, economic recession, or negative growth. Its clean, vector-style design makes it suitable for presentations, reports, and articles on business, finance, and economics.
Free with trial Economics Financial Loss Analytics chart vector illustration. Chart financial growth decrease vectors Economics Financial Loss Analytics chart
Free with trial A modern flat design icon representing financial data analysis and market trends. This vector illustration features a combination of a green bar chart and a dark grey line graph, showing fluctuations in performance. An upward arrow indicates initial growth, followed by a volatile trend line symbolizing concepts like market instability, economic changes, profit and loss, or business analytics. This versatile graphic is perfect for infographics, financial reports, presentations, websites, and applications related to business, finance, statistics, and economics. Isolated on a white background for easy use. Chart financial growth decrease vectors Financial Market Fluctuation Graph Icon. A modern flat design icon representing financial data analysis and market trends. This vector illustration features a combination of a green bar chart and a dark grey line graph, showing fluctuations in performance. An upward arrow indicates initial growth, followed by a volatile trend line symbolizing concepts like market instability, economic changes, profit and loss, or business analytics. This versatile graphic is perfect for infographics, financial reports, presentations, websites, and applications related to business, finance, statistics, and economics. Isolated on a white background for easy use.
Free with trial Abstract digital illustration of a financial chart. A glowing white line graph rises and falls against a blue background with a grid pattern made of dots. The image conveys concepts of market trends, stock analysis, investment, and economic fluctuations. Suitable for illustrating financial reports, business presentations, and technology-related articles. Chart financial growth decrease illustrations Abstract Financial Chart with Glowing Line. Abstract digital illustration of a financial chart. A glowing white line graph rises and falls against a blue background with a grid pattern made of dots. The image conveys concepts of market trends, stock analysis, investment, and economic fluctuations. Suitable for illustrating financial reports, business presentations, and technology-related articles.
Free with trial A clean, minimalist bar chart illustration set against a solid green background. The chart features three white vertical bars of different heights, representing data points or progress over time. A simple white grid and axes are visible, indicating a clear visual representation of statistics. This versatile graphic is ideal for conveying concepts of business growth, financial analysis, market trends, statistical reporting, or educational content in a modern, easy-to-understand format. Perfect for presentations, infographics, websites, and applications. Chart financial growth decrease vectors Minimalist Bar Chart Icon on Green Background. A clean, minimalist bar chart illustration set against a solid green background. The chart features three white vertical bars of different heights, representing data points or progress over time. A simple white grid and axes are visible, indicating a clear visual representation of statistics. This versatile graphic is ideal for conveying concepts of business growth, financial analysis, market trends, statistical reporting, or educational content in a modern, easy-to-understand format. Perfect for presentations, infographics, websites, and applications.
Free with trial A 3D render illustrating the concept of financial decline and economic crisis. The image features a bar chart with progressively smaller bars and a prominent red arrow pointing downwards, signifying a sharp downturn. This visual metaphor represents a stock market crash, business failure, investment loss, or recession. The minimalist design on a yellow background is perfect for financial reports, business presentations, economic news articles, and web graphics discussing negative growth, losses, or bankruptcy. A small stack of coins reinforces the monetary theme. Chart financial growth decrease illustrations 3D Financial Decline Graph with Downward Arrow. A 3D render illustrating the concept of financial decline and economic crisis. The image features a bar chart with progressively smaller bars and a prominent red arrow pointing downwards, signifying a sharp downturn. This visual metaphor represents a stock market crash, business failure, investment loss, or recession. The minimalist design on a yellow background is perfect for financial reports, business presentations, economic news articles, and web graphics discussing negative growth, losses, or bankruptcy. A small stack of coins reinforces the monetary theme.
Free with trial Financial chart against urban cityscape background ,Generative AI. Chart financial growth decrease illustrations Financial chart against urban cityscape background
Free with trial A 3D white bar chart shows a significant downward trend indicated by a sharp, angled arrow pointing downwards. The bars decrease in height from left to right, illustrating a concept of decline or loss. The clean white background emphasizes the minimalist design and the stark visual representation of negative growth. Chart financial growth decrease illustrations 3D White Bar Chart with Downward Trending Arrow on White Background graph decline. A 3D white bar chart shows a significant downward trend indicated by a sharp, angled arrow pointing downwards. The bars decrease in height from left to right, illustrating a concept of decline or loss. The clean white background emphasizes the minimalist design and the stark visual representation of negative growth
Free with trial A clean and simple vector illustration of a bar chart isolated on a white background. This minimalist graphic features three vertical bars in varying shades of blue, representing data, statistics, or progress. Ideal for business reports, financial presentations, infographics, websites, and educational materials. The flat design symbolizes concepts like growth, analysis, market research, and performance comparison, offering a modern and clear way to visualize information. Ample copy space is available. Chart financial growth decrease illustrations Simple Blue Bar Chart Vector Icon for Business Data. A clean and simple vector illustration of a bar chart isolated on a white background. This minimalist graphic features three vertical bars in varying shades of blue, representing data, statistics, or progress. Ideal for business reports, financial presentations, infographics, websites, and educational materials. The flat design symbolizes concepts like growth, analysis, market research, and performance comparison, offering a modern and clear way to visualize information. Ample copy space is available.
Free with trial This vector icon set features graph diagrams with arrows indicating growth and decline. The icons represent business metrics and financial performance, with arrows pointing upward for growth and downward for decline. These symbols are ideal for visualizing trends, success, and changes in finance reports or business charts. The clean, simple design ensures clarity, making these icons suitable for use in presentations, reports, or dashboards to effectively communicate financial or business performance. Chart financial growth decrease vectors Growing up and down vector icon set. Graph diagram with arrow. Business growth success chart. Finance report symbol. This vector icon set features graph diagrams with arrows indicating growth and decline. The icons represent business metrics and financial performance, with arrows pointing upward for growth and downward for decline. These symbols are ideal for visualizing trends, success, and changes in finance reports or business charts. The clean, simple design ensures clarity, making these icons suitable for use in presentations, reports, or dashboards to effectively communicate financial or business performance.
Free with trial This image showcases a striking 3D rendering featuring two sets of colorful bar graphs, one in shades of pink and the other in orange. These graphs are artfully embedded within wave-like, layered forms, creating a visually interesting contrast between the rigid geometry of the bars and the fluidity of the surrounding shapes. The graphs are positioned on separate, circular platforms, and a small, idyllic island with several evergreen trees sits between them, adding a touch of nature to the otherwise abstract composition. The overall aesthetic is minimalist and modern, suggesting a conceptual representation of financial growth within a natural context. Chart financial growth decrease illustrations Abstract 3D Render of Financial Growth Represented by Colorful Bar Graphs Nestled in Stylized Landscapes. This image showcases a striking 3D rendering featuring two sets of colorful bar graphs, one in shades of pink and the other in orange. These graphs are artfully embedded within wave-like, layered forms, creating a visually interesting contrast between the rigid geometry of the bars and the fluidity of the surrounding shapes. The graphs are positioned on separate, circular platforms, and a small, idyllic island with several evergreen trees sits between them, adding a touch of nature to the otherwise abstract composition. The overall aesthetic is minimalist and modern, suggesting a conceptual representation of financial growth within a natural context.
Free with trial A futuristic concept of financial trading and data analysis. A glowing holographic stock market chart, with candlesticks and graphs, is projected onto a modern office desk. The scene includes a laptop and coffee, set against a large window with a blurry night city skyline. This image represents concepts like fintech, investment, big data, economic growth, and innovative business technology. Ideal for illustrating topics on digital finance, stock exchange, forex trading, and corporate strategy in a high-tech world. Chart financial growth decrease illustrations Futuristic Financial Trading Hologram on Office Desk. A futuristic concept of financial trading and data analysis. A glowing holographic stock market chart, with candlesticks and graphs, is projected onto a modern office desk. The scene includes a laptop and coffee, set against a large window with a blurry night city skyline. This image represents concepts like fintech, investment, big data, economic growth, and innovative business technology. Ideal for illustrating topics on digital finance, stock exchange, forex trading, and corporate strategy in a high-tech world.
Free with trial This image showcases a vibrant 3D rendering of various financial charts, including bar graphs, pie charts, and a rising arrow, symbolizing growth and profitability. Ideal for presentations, reports, and financial articles. Chart financial growth decrease illustrations Colorful 3D Financial Charts Showing Growth and Profit. This image showcases a vibrant 3D rendering of various financial charts, including bar graphs, pie charts, and a rising arrow, symbolizing growth and profitability. Ideal for presentations, reports, and financial articles.
Free with trial A collection of twelve black and white vector icons representing various financial concepts. The set includes bar charts and line graphs illustrating growth and trends, a piggy bank for savings, bank buildings symbolizing financial institutions, a safe for security, currency symbols (dollar, euro, yen), and credit debit cards for payments. These icons are ideal for websites, presentations, and applications related to finance, economics, business, and personal money management. Chart financial growth decrease vectors Financial Icons Set: Growth, Savings, Banking, and Payments. A collection of twelve black and white vector icons representing various financial concepts. The set includes bar charts and line graphs illustrating growth and trends, a piggy bank for savings, bank buildings symbolizing financial institutions, a safe for security, currency symbols (dollar, euro, yen), and credit debit cards for payments. These icons are ideal for websites, presentations, and applications related to finance, economics, business, and personal money management.
Free with trial A detailed financial chart is presented with numerous vertical bars and multiple overlapping line graphs in blue, white, and orange. Red and green arrows indicate downward and upward movements, respectively, with specific numerical data points displayed. The overall trend shows fluctuations but a general upward trajectory towards the right. Chart financial growth decrease illustrations Detailed Financial Chart with Upward and Downward Trends. A detailed financial chart is presented with numerous vertical bars and multiple overlapping line graphs in blue, white, and orange. Red and green arrows indicate downward and upward movements, respectively, with specific numerical data points displayed. The overall trend shows fluctuations but a general upward trajectory towards the right
Free with trial Description: A 3D rendering of a businessman figure presenting a bar chart showing upward growth trend on a whiteboard. The chart illustrates business success and progress. Chart financial growth decrease illustrations Businessman Presenting Positive Growth Chart on Whiteboard. Description: A 3D rendering of a businessman figure presenting a bar chart showing upward growth trend on a whiteboard. The chart illustrates business success and progress.
Free with trial This set of icons shows different aspects of money circulation, investment, financial growth and profit. Chart financial growth decrease vectors Money circulation, investment, financial growth and profit flat icons set. This set of icons shows different aspects of money circulation, investment, financial growth and profit
Free with trial Visualizing a sharp downward trend, this graphic powerfully represents financial downturns and declining business performance, ideal for economic analyses and cautionary tales. Chart financial growth decrease vectors Dynamic chart shows steep decline impacting business growth and financial performance. Visualizing a sharp downward trend, this graphic powerfully represents financial downturns and declining business performance, ideal for economic analyses and cautionary tales
Free with trial A collection of hand-drawn bar chart icons with upward and downward arrows, representing financial growth and decline. Chart financial growth decrease vectors Hand-drawn bar chart with up and down arrows .Vector illustration. A collection of hand-drawn bar chart icons with upward and downward arrows, representing financial growth and decline
Free with trial This image displays a dynamic business analytics dashboard featuring both bar and line graphs. The bar chart illustrates varying percentages (15%, 50%, 75%, 85%), suggesting performance metrics or growth stages. The line chart, with its intersecting blue lines and data points, represents trends, fluctuations, and comparisons over time or across different categories. The clean, modern design makes it ideal for financial reports, business presentations, and data visualization concepts. Chart financial growth decrease illustrations Business Growth and Performance Analysis with Bar and Line Charts. This image displays a dynamic business analytics dashboard featuring both bar and line graphs. The bar chart illustrates varying percentages (15%, 50%, 75%, 85%), suggesting performance metrics or growth stages. The line chart, with its intersecting blue lines and data points, represents trends, fluctuations, and comparisons over time or across different categories. The clean, modern design makes it ideal for financial reports, business presentations, and data visualization concepts.
Free with trial This 3D illustration shows a colorful bar graph with pastel-colored cylinders on a white circular base, representing upward business growth trends. The chart includes a line graph illustrating various data points. Chart financial growth decrease illustrations 3D Colorful Cylindrical Bar Graph Chart Showing Business Growth. This 3D illustration shows a colorful bar graph with pastel-colored cylinders on a white circular base, representing upward business growth trends. The chart includes a line graph illustrating various data points.
Free with trial Creative security padlock on red forex chart background. Financial recess and data protection concept. 3D Rendering. Chart financial growth decrease illustrations Creative security padlock on forex chart background. Financial recess and data protection concept. 3D Rendering
Free with trial Decreasing bar chart diagram with down arrow showing negative growth. Chart financial growth decrease vectors Decreasing bar chart diagram with down arrow showing negative growth
Free with trial Simple, bold line icon of a platform displaying a dynamic financial market chart with currency trading ups and downs. Chart financial growth decrease vectors Platform showing dynamic up and down financial market currency trading chart icon. Simple, bold line icon of a platform displaying a dynamic financial market chart with currency trading ups and downs
Free with trial Chart with growth red arrow and crash in the end, 3D rendering isolated on white background. Chart financial growth decrease illustrations Chart with growth red arrow and crash in the end, 3D rendering
Free with trial This 3D rendering depicts financial growth, showcasing stacks of gold coins and black bars representing a rising graph. A golden pen rests on a sleek base, symbolizing the precision and detail involved in financial planning. This image was generated by AI and is perfect for illustrating financial s. Chart financial growth decrease illustrations Financial Growth Visualization. This 3D rendering depicts financial growth, showcasing stacks of gold coins and black bars representing a rising graph. A golden pen rests on a sleek base, symbolizing the precision and detail involved in financial planning. This image was generated by AI and is perfect for illustrating financial s
Free with trial Curved growth and decline chart icon in flat design. Business trend arrow symbol illustration. Chart financial growth decrease vectors Curved growth and decline chart icon in flat design. Business trend arrow symbol
Free with trial Financial arrow up and down icon on circle line. Growth and decline graph sign symbol illustration. Chart financial growth decrease vectors Financial arrow up and down icon on circle line. Growth and decline graph sign symbol
Free with trial Growth and decline chart. Market trend analysis. Vector illustration. EPS 10. Stock image. Chart financial growth decrease vectors Growth and decline chart. Market trend analysis. Vector illustration. EPS 10.
Free with trial A 3D bar chart with red and green bars representing financial data trends, isolated on white background. Chart financial growth decrease illustrations 3d bar chart showing financial data trends isolated on white background. A 3D bar chart with red and green bars representing financial data trends, isolated on white background
Free with trial Financial arrows up and down icon in flat design. Growth and decline graph sign symbol illustration. Chart financial growth decrease vectors Financial arrows up and down icon in flat design. Growth and decline graph sign symbol
Free with trial Analyze Gold Coins and Economic Growth with Magnifying Glass on Stock Chart , stunning visual effect. Chart financial growth decrease illustrations Analyze Gold Coins and Economic Growth with Magnifying Glass on Stock Chart
Free with trial A detailed blue candlestick chart depicting stock market price fluctuations and trends over time Ideal for illustrating financial concepts market analysis and investment strategies The graphic is clean modern and visually engaging. Chart financial growth decrease illustrations Blue Financial Chart Candlestick Graph Showing Stock Market Trend Analysis. A detailed blue candlestick chart depicting stock market price fluctuations and trends over time Ideal for illustrating financial concepts market analysis and investment strategies The graphic is clean modern and visually engaging
Free with trial A human hand is shown presenting a vivid, glowing yellow percentage symbol, radiating light and prominence. In the background, a digital bar chart visually represents growth and data analysis, set against a dark, abstract backdrop with subtle bokeh lights. This image powerfully conveys concepts related to finance, interest rates, discounts, business growth, profit, and investment. It's perfect for illustrating financial reports, economic articles, banking promotions, or investment strategy presentations. Chart financial growth decrease illustrations Financial Growth and Interest Rates Concept with Glowing Percentage Symbol. A human hand is shown presenting a vivid, glowing yellow percentage symbol, radiating light and prominence. In the background, a digital bar chart visually represents growth and data analysis, set against a dark, abstract backdrop with subtle bokeh lights. This image powerfully conveys concepts related to finance, interest rates, discounts, business growth, profit, and investment. It's perfect for illustrating financial reports, economic articles, banking promotions, or investment strategy presentations.
Free with trial A 3D illustration featuring a bar chart with four ascending blue bars of varying heights, representing data growth. To the right of the chart are two white arrows, one pointing upwards and the other downwards, symbolizing increase and decrease respectively. The entire graphic is presented on a clean white background. Chart financial growth decrease illustrations 3D Bar Chart with Up and Down Arrows on White Background graph statistics. A 3D illustration featuring a bar chart with four ascending blue bars of varying heights, representing data growth. To the right of the chart are two white arrows, one pointing upwards and the other downwards, symbolizing increase and decrease respectively. The entire graphic is presented on a clean white background
Free with trial Growth and decline. Business chart icon. Profit loss symbol. Vector illustration. EPS 10. Chart financial growth decrease vectors Growth and decline. Business chart icon. Profit loss symbol. Vector illustration.
Free with trial A simple line drawing of a decreasing chart with an arrow pointing downwards, depicting negative growth or decline. Useful for presentations, infographics, and reports. Chart financial growth decrease vectors Minimalist Line Style Decreasing Chart Arrow Down Financial Graphic Element. A simple line drawing of a decreasing chart with an arrow pointing downwards, depicting negative growth or decline. Useful for presentations, infographics, and reports.
Free with trial A grid of 16 black and white icons representing financial growth, currency, and directional arrows, isolated on a transparent background. Chart financial growth decrease vectors Collection of financial and growth icons isolated on transparent background. A grid of 16 black and white icons representing financial growth, currency, and directional arrows, isolated on a transparent background
Free with trial Falling bar chart with a downward trending line and arrow indicating decrease. Chart financial growth decrease vectors Falling bar chart with a downward trending line and arrow indicating decrease
Free with trial Hand drawn bar chart illustration showing data statistics and business growth. Chart financial growth decrease vectors Hand drawn bar chart illustration showing data statistics and business growth
Free with trial An abstract digital rendering of a financial market chart with a prominent red line indicating fluctuations in a stock market or trading scenario, set against a background of data streams and numerical information. It can be used for visualizing economic trends or for representing financial analytics. Chart financial growth decrease illustrations Abstract financial chart depicting market trends and data analysis interface. An abstract digital rendering of a financial market chart with a prominent red line indicating fluctuations in a stock market or trading scenario, set against a background of data streams and numerical information. It can be used for visualizing economic trends or for representing financial analytics
Free with trial A 3d stylized financial chart displays a downward red arrow over blue and orange bars. Two gold coins with dollar signs flank the chart. Chart financial growth decrease illustrations 3d stylized financial chart with downward red arrow and gold coins illustration. A 3d stylized financial chart displays a downward red arrow over blue and orange bars. Two gold coins with dollar signs flank the chart
Free with trial Trend chart icon set. Growth and decline symbol. Up and down arrow with bar graph illustration. Chart financial growth decrease vectors Trend chart icon set. Growth and decline symbol. Up and down arrow with bar graph
Free with trial This 3D rendering showcases colorful bar graphs, pie charts, and a calculator, vividly illustrating concepts of business growth, financial success, and data analysis. The upward-trending arrow emphasizes positive progress. Chart financial growth decrease illustrations Colorful 3D Charts and Calculator Illustrating Business Growth and Financial Success. This 3D rendering showcases colorful bar graphs, pie charts, and a calculator, vividly illustrating concepts of business growth, financial success, and data analysis. The upward-trending arrow emphasizes positive progress.
Free with trial Red Stock Market Chart Showing Loss, Downward Trend, and Bear Market, Financial Crisis Concept. , Generated by AI. Chart financial growth decrease illustrations Red Stock Market Chart Showing Loss, Downward Trend, and Bear Market, Financial Crisis Concept.
Free with trial Magnifying glass analyzing candlestick chart showing stock market crash, concept of financial crisis, investment and trading. Chart financial growth decrease illustrations Magnifying glass analyzing stock market candlestick chart displaying financial crisis. Magnifying glass analyzing candlestick chart showing stock market crash, concept of financial crisis, investment and trading
Free with trial A digital illustration depicting a financial chart with blue and red bars and lines. Neon glows accentuate the data points. The style is abstract and modern. Chart financial growth decrease illustrations Abstract Blue Red Financial Data Chart Graph Digital Illustration Neon Glow business. A digital illustration depicting a financial chart with blue and red bars and lines. Neon glows accentuate the data points. The style is abstract and modern
Free with trial A 3D illustration depicting financial concepts. A purple rectangular bar shows a sharp red downward trending arrow. Below it, another purple bar displays a candlestick chart with red and blue bars. To the right, a magnifying glass with an orange handle and turquoise lens hovers, suggesting analysis. A small, colorful pie chart with red, yellow, and blue segments is positioned to the left. The. Chart financial growth decrease illustrations 3D Financial Downward Trend Chart with Magnifying Glass and Pie Chart finance stock market. A 3D illustration depicting financial concepts. A purple rectangular bar shows a sharp red downward trending arrow. Below it, another purple bar displays a candlestick chart with red and blue bars. To the right, a magnifying glass with an orange handle and turquoise lens hovers, suggesting analysis. A small, colorful pie chart with red, yellow, and blue segments is positioned to the left. The
Free with trial Set pop art Coal mine trolley, Data analysis, and Financial growth decrease icon. Vector. Chart financial growth decrease illustrations Set pop art Coal mine trolley, Data analysis, and Financial growth decrease icon. Vector
Free with trial Declining graph showing a financial or business downturn, with bar chart and arrow down. Chart financial growth decrease vectors Declining graph showing a financial or business downturn, with bar chart and arrow down
Free with trial Bar chart graph. Colorful falling arrow. Financial data analysis. Vector business symbol. EPS 10. Chart financial growth decrease vectors Bar chart graph. Colorful falling arrow. Financial data analysis. Vector business symbol.
Free with trial Declining Bar Chart with Downward Arrow Representing Economic Downturn and Financial Loss. Chart financial growth decrease vectors Declining Bar Chart with Downward Arrow Representing Economic Downturn and Financial Loss
Free with trial Blue Toned Financial Chart With Pen, Showing Downward Trend, Illustrating Market Volatility. , Generated by AI. Chart financial growth decrease illustrations Blue Toned Financial Chart With Pen, Showing Downward Trend, Illustrating Market Volatility.
Free with trial Financial chart displaying a series of candlestick patterns on a digital screen, used for stock data analysis. The chart features vertical bars in orange against a blue background with grid lines. Each candlestick represents price movements within a specific time frame, showcasing market trends. The background includes a blurred assortment of lights and other graphical elements, indicating a financial data interface, likely used for investment portfolio analysis and trading activities. Chart financial growth decrease illustrations Financial Chart And Stock Data Analysis For Investment Portfolio. Candle Stick Graph For Trade. Financial chart displaying a series of candlestick patterns on a digital screen, used for stock data analysis. The chart features vertical bars in orange against a blue background with grid lines. Each candlestick represents price movements within a specific time frame, showcasing market trends. The background includes a blurred assortment of lights and other graphical elements, indicating a financial data interface, likely used for investment portfolio analysis and trading activities.
Free with trial Financial Capability Month Financial chart with 3d bar graph and line plot illustrating market trends. Chart financial growth decrease illustrations Financial Capability Month Financial chart with 3d bar graph and line plot illustrating market trends
Free with trial Trend chart icon in black circle. Growth and decline symbol. Up and down arrow with bar graph illustration. Chart financial growth decrease vectors Trend chart icon in black circle. Growth and decline symbol. Up and down arrow with bar graph
Free with trial Up and down trend chart icon in black circle. Business growth and decline symbol illustration. Chart financial growth decrease vectors Up and down trend chart icon in black circle. Business growth and decline symbol
Free with trial Stacks of gold coins sit before a fluctuating red arrow graph illustrating concepts of financial growth market trends investment risk and economic change The image depicts uncertainty and the potential for both profit and loss. Chart financial growth decrease illustrations Financial Growth Stock Market Coins Red Arrow Investment Business Economy Finance Money Success. Stacks of gold coins sit before a fluctuating red arrow graph illustrating concepts of financial growth market trends investment risk and economic change The image depicts uncertainty and the potential for both profit and loss
Free with trial A financial illustration shows coins decreasing in size along a horizontal axis, representing devaluation. An upward-pointing arrow indicates increasing inflation percentages, with labels of "4%", "20%", and "50%". The chart is labeled "INFLATION" at the top, with percentages scattered around. Broken pieces from a large coin suggest fragmentation and loss of value. The background features a subtle line graph, reinforcing the economic theme. Chart financial growth decrease illustrations Inflation increasing and devaluing money, showing a financial chart with coins and an arrow going up. A financial illustration shows coins decreasing in size along a horizontal axis, representing devaluation. An upward-pointing arrow indicates increasing inflation percentages, with labels of "4%", "20%", and "50%". The chart is labeled "INFLATION" at the top, with percentages scattered around. Broken pieces from a large coin suggest fragmentation and loss of value. The background features a subtle line graph, reinforcing the economic theme.
Free with trial A man standing in front of a chart with an arrow pointing to it, analyzing sales growth data, Worker analyzes sales growth graph, Simple and minimalist flat Vector Illustration. Chart financial growth decrease vectors A man standing in front of a chart with an arrow pointing to it, analyzing sales growth data, Worker analyzes sales growth graph
Free with trial This vibrant 3D bar chart illustrates upward trending data, perfect for presentations or reports on financial growth, market analysis, or business success. The colorful blocks represent different data points. Chart financial growth decrease illustrations Colorful 3D Bar Chart Showing Business Growth and Success. This vibrant 3D bar chart illustrates upward trending data, perfect for presentations or reports on financial growth, market analysis, or business success. The colorful blocks represent different data points.
Free with trial Candlestick chart graph for stock market, financial investment, forex trading and business report concept. Vector illustration. Chart financial growth decrease vectors Candlestick chart graph for stock market, financial investment
Free with trial Stock market chart analysis displayed on computer screen showing growth and performance ,Generative ai. Chart financial growth decrease illustrations Stock market analysis chart displayed on computer screen showing growth and investment performance. Stock market chart analysis displayed on computer screen showing growth and performance ,Generative ai
Free with trial Stock market chart displaying a transition from a downturn to a bullish trend. Red candlesticks indicate a declining phase, followed by green candlesticks showing upward movement. The grid and digital interface feature blue and orange function buttons surrounding the chart. The setup appears designed for financial analysis, illustrating market behavior for reports or presentations. Chart financial growth decrease illustrations Dynamic stock market chart showing bullish trend after downturn for financial analysis reports and presentations. Stock market chart displaying a transition from a downturn to a bullish trend. Red candlesticks indicate a declining phase, followed by green candlesticks showing upward movement. The grid and digital interface feature blue and orange function buttons surrounding the chart. The setup appears designed for financial analysis, illustrating market behavior for reports or presentations.
Free with trial Iced over business graph or chart, visualizing declining winter season sales trends A business financial chart or graph, rendered as if made of ice or heavily frosted. The lines of the graph are. Chart financial growth decrease illustrations Iced over business graph or chart, visualizing declining winter season sales trends A business financial chart or graph, rendered