Free with trial Report statistics line icon. Neumorphic, Green gradient, 3d pin buttons. Column graph sign. Growth diagram symbol. Line icons. Neumorphic buttons with outline signs. Vector. Decrease bar chart icon vectors Report statistics line icon. Column graph sign. Line icons. Vector. Report statistics line icon. Neumorphic, Green gradient, 3d pin buttons. Column graph sign. Growth diagram symbol. Line icons. Neumorphic buttons with outline signs. Vector
Free with trial Set of Chart presentation, Report, Increase growth graph icons. Design shape elements. Graph line icons. Analytics testing, Falling demand, Pie chart report. Calendar statistics, Stats. Vector. Decrease bar chart icon vectors Graph line icons. Set of Chart presentation, Report and Increase growth graph icons. Design elements. Vector. Set of Chart presentation, Report, Increase growth graph icons. Design shape elements. Graph line icons. Analytics testing, Falling demand, Pie chart report. Calendar statistics, Stats. Vector
Free with trial Report, 3D Chart, Block diagram and Dot Plot graph linear icons. Design shape elements. Charts and Diagrams line icons. Trend, Pyramid and Pie chart report symbols. Vector. Decrease bar chart icon vectors Charts and Diagrams line icons. Set of 3D Chart, Block diagram and Dot Plot graph icons. Design elements. Vector. Report, 3D Chart, Block diagram and Dot Plot graph linear icons. Design shape elements. Charts and Diagrams line icons. Trend, Pyramid and Pie chart report symbols. Vector
Free with trial A 3D render illustrating the concept of financial decline and economic crisis. The image features a bar chart with progressively smaller bars and a prominent red arrow pointing downwards, signifying a sharp downturn. This visual metaphor represents a stock market crash, business failure, investment loss, or recession. The minimalist design on a yellow background is perfect for financial reports, business presentations, economic news articles, and web graphics discussing negative growth, losses, or bankruptcy. A small stack of coins reinforces the monetary theme. Decrease bar chart icon illustrations 3D Financial Decline Graph with Downward Arrow. A 3D render illustrating the concept of financial decline and economic crisis. The image features a bar chart with progressively smaller bars and a prominent red arrow pointing downwards, signifying a sharp downturn. This visual metaphor represents a stock market crash, business failure, investment loss, or recession. The minimalist design on a yellow background is perfect for financial reports, business presentations, economic news articles, and web graphics discussing negative growth, losses, or bankruptcy. A small stack of coins reinforces the monetary theme.
Free with trial Red and Green Candlestick Chart vector Crypto Trading and Price Action concept colored seamless pattern. Decrease bar chart icon vectors Red and Green Candlestick Chart vector Crypto Trading and Price Action colored seamless pattern
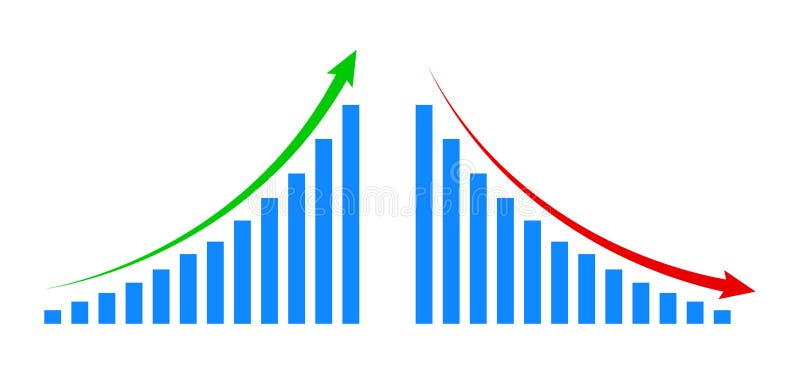
Free with trial A simple graphic showing a downward trend with a red line graph and several vertical bars of varying heights and colors. Decrease bar chart icon vectors Downward trending bar and line graph chart data. A simple graphic showing a downward trend with a red line graph and several vertical bars of varying heights and colors
Free with trial Purple gradient bar graph is showing a negative trend with a downward arrow. Decrease bar chart icon vectors Purple gradient bar graph showing negative trend with downward arrow
Free with trial Red bar graph with decreasing values. Generative AI. Decrease bar chart icon illustrations Red bar graph with decreasing values
Free with trial Business graphic chart line, round and candlestick graph trend with glassmorphism effect. Transparent blur glass on gradient arrow vector set. Financial diagram on black. Marketing analytics. Decrease bar chart icon illustrations Business graphic chart line round and candlestick graph trend with glassmorphism effect vector set, arrows on black. Business graphic chart line, round and candlestick graph trend with glassmorphism effect. Transparent blur glass on gradient arrow vector set. Financial diagram on black. Marketing analytics
Free with trial Business Bar Graph Downturn Arrow Icon Trend Falling. Decrease bar chart icon vectors Business Bar Graph Downturn Arrow Icon Trend Falling
Free with trial Economy crisis icon Vector symbol or sign set collection in black and white outline. Decrease bar chart icon vectors Economy crisis flat line icon set. Economy crisis Thin line illustration vector. Economy crisis icon Vector symbol or sign set collection in black and white outline
Free with trial This simple bar graph is depicting market analysis with colorful bars. Decrease bar chart icon vectors Colorful bar graph showing market growth and success. This simple bar graph is depicting market analysis with colorful bars
Free with trial Dollar coin beside a bar graph showing downward trend under a cloud. Ideal for finance, economy, investment, loss, analytics, business performance, global market. Simple flat metaphor. Decrease bar chart icon vectors Dollar Coin and Declining Bar Graph Representing Financial Loss Concept. Dollar coin beside a bar graph showing downward trend under a cloud. Ideal for finance, economy, investment, loss, analytics, business performance, global market. Simple flat metaphor
Free with trial A stylized chart with bars and a line graph is displayed in a soft speech bubble against a simple background great for business or infographic presentations. Decrease bar chart icon illustrations Analyzing Data Chart in Speech Bubble for Presentation. A stylized chart with bars and a line graph is displayed in a soft speech bubble against a simple background great for business or infographic presentations
Free with trial Simple line art illustration of a bar graph with a downward trend, symbolizing negative growth. Decrease bar chart icon illustrations Declining bar graph showing negative trend with arrow pointing down. Simple line art illustration of a bar graph with a downward trend, symbolizing negative growth
Free with trial Arrow trend-down icon vector set on white background. EPS 10. Decrease bar chart icon vectors Arrow trend-down icon
Free with trial 3d cylinder chart showing downward trend. Business and finance decline vector illustration. Decrease bar chart icon vectors 3d cylinder chart showing downward trend. Business and finance decline illustration
Free with trial Data analytics icons set in duotone outline stroke design for web. Pack pictograms of search, mining, filter, pie chart, presentation, mind map, database, discover, flow, other. Vector illustration. Decrease bar chart icon illustrations Data analytics icons set in duotone outline stroke design for web. Pack pictograms of search, mining, filter, pie chart
Free with trial A simple graphic showing various data representation methods including bar, line, and pie charts in a monochrome style. Decrease bar chart icon vectors Black and White Data Visualization Charts Bar Graph, Line Graph, and Pie Charts. A simple graphic showing various data representation methods including bar, line, and pie charts in a monochrome style
Free with trial Presentation board line icon. Neumorphic, Purple gradient, 3d pin buttons. Column graph sign. Growth diagram symbol. Line icons. Neumorphic buttons with outline signs. Vector. Decrease bar chart icon illustrations Presentation board line icon. Column graph sign. Line icons. Vector. Presentation board line icon. Neumorphic, Purple gradient, 3d pin buttons. Column graph sign. Growth diagram symbol. Line icons. Neumorphic buttons with outline signs. Vector
Free with trial Presentation board line icon. Neumorphic, Purple gradient, 3d pin buttons. Column graph sign. Growth diagram symbol. Line icons. Neumorphic buttons with outline signs. Vector. Decrease bar chart icon illustrations Presentation board line icon. Column graph sign. Line icons. Vector. Presentation board line icon. Neumorphic, Purple gradient, 3d pin buttons. Column graph sign. Growth diagram symbol. Line icons. Neumorphic buttons with outline signs. Vector
Free with trial Open laptop showing line chart, bar chart, and trend analysis with arrow indicating sales decline. Ideal for analytics, e-commerce, business strategy, financial forecasting, market analysis, sales. Decrease bar chart icon vectors Laptop screen displaying charts, analytics, and sale trend with downward arrow. Open laptop showing line chart, bar chart, and trend analysis with arrow indicating sales decline. Ideal for analytics, e-commerce, business strategy, financial forecasting, market analysis, sales
Free with trial A grid of black icons representing various types of graphs and charts, including bar graphs and line graphs with upward arrows, on a white background. Decrease bar chart icon vectors Collection of Ai-Generated black and white graph and chart icons. A grid of black icons representing various types of graphs and charts, including bar graphs and line graphs with upward arrows, on a white background
Free with trial Red bar graph decreasing with blue arrow representing a loss in business, sales, jobs, or other financial loss. Decrease bar chart icon vectors Red bar graph decreasing with blue arrow representing a loss in business
Free with trial Presentation board line icon. Continuous line with share plane. Column graph sign. Growth diagram symbol. 3d star in speech bubble. Presentation board single line ribbon. Loop curve pattern. Vector. Decrease bar chart icon vectors Presentation board line icon. Column graph sign. Continuous line with plane. Vector. Presentation board line icon. Continuous line with share plane. Column graph sign. Growth diagram symbol. 3d star in speech bubble. Presentation board single line ribbon. Loop curve pattern. Vector
Free with trial Report statistics line icon. Halftone dotted pattern. Gradient icon with grain shadow. Column graph sign. Growth diagram symbol. Line report statistics icon. Various designs. Vector. Decrease bar chart icon vectors Report statistics line icon. Column graph sign. Halftone dotted pattern. Vector. Report statistics line icon. Halftone dotted pattern. Gradient icon with grain shadow. Column graph sign. Growth diagram symbol. Line report statistics icon. Various designs. Vector
Free with trial Declining bar chart with bold red fake label above a minimal cloud. Ideal for misinformation, fraud, analysis, skepticism, distrust, validation, critical thinking. Simple flat metaphor. Decrease bar chart icon vectors Data Misrepresentation Concept with Declining Graph and Fake Label in Simple Style. Declining bar chart with bold red fake label above a minimal cloud. Ideal for misinformation, fraud, analysis, skepticism, distrust, validation, critical thinking. Simple flat metaphor
Free with trial Graph line icons. Interest rate, AI generate, Inflation icons. Set of Chart presentation, Report, Increase growth graph icons. Analytics testing, Falling demand, Pie chart report. Vector. Decrease bar chart icon vectors Graph line icons. Set of Chart presentation, Report and Increase growth graph icons. App line icons. Vector. Graph line icons. Interest rate, AI generate, Inflation icons. Set of Chart presentation, Report, Increase growth graph icons. Analytics testing, Falling demand, Pie chart report. Vector
Free with trial Growth vector icon. Graph or diagram with arrow going up and down. Vector illustration. Decrease bar chart icon vectors Growth vector icon. Graph or diagram with arrow going up and down. Vector
Free with trial Sketchy bar graph illustration of financial decline and economic loss. Decrease bar chart icon vectors Sketchy bar graph illustration of financial decline and economic loss
Free with trial Growth vector icon. Graph or diagram with arrow going up and down. Vector illustration. Decrease bar chart icon vectors Growth vector icon. Graph or diagram with arrow going up and down. Vector
Free with trial Down graphic of business stats outline icon in white and black colors. down graphic of business stats flat vector icon from business collection for web, mobile apps and ui. Decrease bar chart icon vectors Down graphic of business stats outline icon in white and black colors. down graphic of business stats flat vector icon from
Free with trial Graph going Up and Down sign with green and red arrows. graph increase, decrease sign design. Decrease bar chart icon vectors Graph going Up and Down sign with green and red arrows. graph increase, decrease sign
Free with trial Growth vector icon. Graph or diagram with arrow going up and down. Vector illustration. Decrease bar chart icon vectors Growth vector icon. Graph or diagram with arrow going up and down. Vector
Free with trial Growth vector icon. Graph or diagram with arrow going up and down. Vector illustration. Decrease bar chart icon vectors Growth vector icon. Graph or diagram with arrow going up and down. Vector
Free with trial Growth vector icon. Graph or diagram with arrow going up and down. Vector illustration. Decrease bar chart icon vectors Growth vector icon. Graph or diagram with arrow going up and down. Vector
Free with trial Growth vector icon. Graph or diagram with arrow going up and down. Vector illustration. Decrease bar chart icon vectors Growth vector icon. Graph or diagram with arrow going up and down. Vector
Free with trial Growth vector icon. Graph or diagram with arrow going up and down. Vector illustration. Decrease bar chart icon vectors Growth vector icon. Graph or diagram with arrow going up and down. Vector
Free with trial Growth vector icon. Graph or diagram with arrow going up and down. Vector illustration. Decrease bar chart icon vectors Growth vector icon. Graph or diagram with arrow going up and down. Vector
Free with trial Growth vector icon. Graph or diagram with arrow going up and down. Vector illustration. Decrease bar chart icon vectors Growth vector icon. Graph or diagram with arrow going up and down. Vector
Free with trial Growth vector icon. Graph or diagram with arrow going up and down. Vector illustration. Decrease bar chart icon vectors Growth vector icon. Graph or diagram with arrow going up and down. Vector
Free with trial Growth vector icon. Graph or diagram with arrow going up and down. Vector illustration. Decrease bar chart icon vectors Growth vector icon. Graph or diagram with arrow going up and down. Vector
Free with trial Business decline icon with downward arrow. Loss, failure, or economic crisis symbol vector in black circle. Decrease bar chart icon vectors Business decline icon with downward arrow. Loss, failure, or economic crisis symbol in black circle
Free with trial Financial arrow up and down icon on circle line. Growth and decline graph sign symbol illustration. Decrease bar chart icon vectors Financial arrow up and down icon on circle line. Growth and decline graph sign symbol
Free with trial Report statistics line icon. Neumorphic, Flat shadow, 3d buttons. Column graph sign. Growth diagram symbol. Line report statistics icon. Social media icons. Vector. Decrease bar chart icon illustrations Report statistics line icon. Column graph sign. Neumorphic buttons. Vector. Report statistics line icon. Neumorphic, Flat shadow, 3d buttons. Column graph sign. Growth diagram symbol. Line report statistics icon. Social media icons. Vector
Free with trial Report statistics line icon. Neumorphic, Flat shadow, 3d buttons. Column graph sign. Growth diagram symbol. Line report statistics icon. Social media icons. Vector. Decrease bar chart icon illustrations Report statistics line icon. Column graph sign. Neumorphic buttons. Vector. Report statistics line icon. Neumorphic, Flat shadow, 3d buttons. Column graph sign. Growth diagram symbol. Line report statistics icon. Social media icons. Vector
Free with trial Financial arrows up and down icon in flat design. Growth and decline graph sign symbol illustration. Decrease bar chart icon vectors Financial arrows up and down icon in flat design. Growth and decline graph sign symbol
Free with trial Charts and Diagrams line icons. Interest rate, AI generate, Inflation icons. Report, 3D Chart, Block diagram and Dot Plot graph linear icons. Trend, Pyramid and Pie chart report symbols. Vector. Decrease bar chart icon vectors Charts and Diagrams line icons. Set of 3D Chart, Block diagram and Dot Plot graph icons. App line icons. Vector. Charts and Diagrams line icons. Interest rate, AI generate, Inflation icons. Report, 3D Chart, Block diagram and Dot Plot graph linear icons. Trend, Pyramid and Pie chart report symbols. Vector
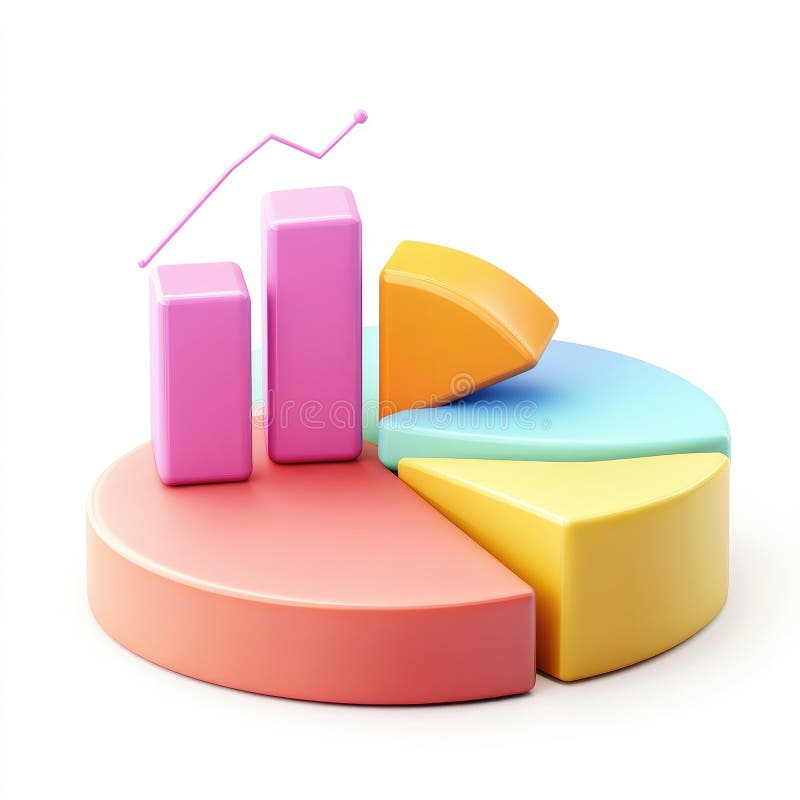
Free with trial This 3D rendering shows vibrant bar and pie charts illustrating business growth, data analysis, and statistical visualization. Perfect for presentations, reports, or marketing materials. Decrease bar chart icon illustrations Colorful 3D Bar and Pie Charts Representing Business Growth and Data Analysis. This 3D rendering shows vibrant bar and pie charts illustrating business growth, data analysis, and statistical visualization. Perfect for presentations, reports, or marketing materials.
Free with trial Prohibition sign with declining bar chart and people icons. No decline concept. EPS 10. Decrease bar chart icon vectors Prohibition sign with declining bar chart and people icons. No decline concept.
Free with trial CO2 inside cloud shape with blue downward arrows indicating reduction, next to bar chart and small cloud. Ideal for sustainability, environment, data, carbon reduction, climate change, eco-friendly. Decrease bar chart icon vectors Reducing Carbon Emissions with Data Analysis Highlighted by Cloud Imagery and Downward Arrows. CO2 inside cloud shape with blue downward arrows indicating reduction, next to bar chart and small cloud. Ideal for sustainability, environment, data, carbon reduction, climate change, eco-friendly
Free with trial Business performance decline icon in black circle. Productivity drop and process efficiency loss symbol vector. Decrease bar chart icon vectors Business performance decline icon in black circle. Productivity drop and process efficiency loss symbol
Free with trial Bar graph with downward trend, arrows indicating loss, and coins falling. Ideal for finance, economics, business, investment, budgeting revenue loss and decline concepts. Simple flat metaphor. Decrease bar chart icon illustrations Revenue Decline Illustration with Bar Graph, Arrows, and Falling Coins Symbolizing Financial Loss. Bar graph with downward trend, arrows indicating loss, and coins falling. Ideal for finance, economics, business, investment, budgeting revenue loss and decline concepts. Simple flat metaphor
Free with trial Top Position and Promotion Icon Line Style Design Simple Finance and Business Vector Symbol Perfect Illustration. Decrease bar chart icon vectors Top Position and Promotion Icon Line Style Design Simple Vector Perfect Illustration. Top Position and Promotion Icon Line Style Design Simple Finance and Business Vector Symbol Perfect Illustration
Free with trial Statistic graph progress, financial profit growth, increase and decrease line icons set. Infographic charts with arrow, circles and bars thin black and red outline symbols vector illustration. Decrease bar chart icon vectors Statistic graph progress, financial profit growth, increase and decrease line icons set
Free with trial Decreasing graph icon vector illustration on circle line. Company bankruptcy report vector. Market crash concept. Decrease bar chart icon vectors Decreasing graph icon vector on circle line. Company bankruptcy report vector. Market crash concept
Free with trial A 3D graphic shows a gold Bitcoin coin next to a blue bar graph with a red downward arrow indicating a trend. Decrease bar chart icon illustrations 3 D Bitcoin coin with blue bar graph and red downward arrow cryptocurrency finance. A 3D graphic shows a gold Bitcoin coin next to a blue bar graph with a red downward arrow indicating a trend
Free with trial Decreasing graph icon set collection. Arrow going down sign symbol vector illustration. Market crash concept. Decrease bar chart icon vectors Decreasing graph icon set collection. Arrow going down sign symbol vector. Market crash concept
Free with trial Cylinder objects pattern. Stacked bar elements. Data visualization Vector. Storage capacity illustration. EPS 10. Decrease bar chart icon vectors Cylinder objects pattern. Stacked bar elements. Data visualization Vector. Storage capacity illustration.
Free with trial A 3D illustration depicting financial concepts. A purple rectangular bar shows a sharp red downward trending arrow. Below it, another purple bar displays a candlestick chart with red and blue bars. To the right, a magnifying glass with an orange handle and turquoise lens hovers, suggesting analysis. A small, colorful pie chart with red, yellow, and blue segments is positioned to the left. The. Decrease bar chart icon illustrations 3D Financial Downward Trend Chart with Magnifying Glass and Pie Chart finance stock market. A 3D illustration depicting financial concepts. A purple rectangular bar shows a sharp red downward trending arrow. Below it, another purple bar displays a candlestick chart with red and blue bars. To the right, a magnifying glass with an orange handle and turquoise lens hovers, suggesting analysis. A small, colorful pie chart with red, yellow, and blue segments is positioned to the left. The
Free with trial Descending data analytics line graphic outline icon in white and black colors. descending data analytics line graphic flat vector icon from business collection for web, mobile apps and ui. Decrease bar chart icon vectors Descending data analytics line graphic outline icon in white and black colors. descending data analytics line graphic flat vector
Free with trial Decreasing graph icon set. Arrow going down sign symbol vector illustration. Market crash concept. Decrease bar chart icon vectors Decreasing graph icon set. Arrow going down sign symbol vector. Market crash concept
Free with trial Arrow trend-down icon vector set on white background. EPS 10. Decrease bar chart icon vectors Arrow trend-down icon isolated on white background. Arrow trend-down icon vector set on white background. EPS 10
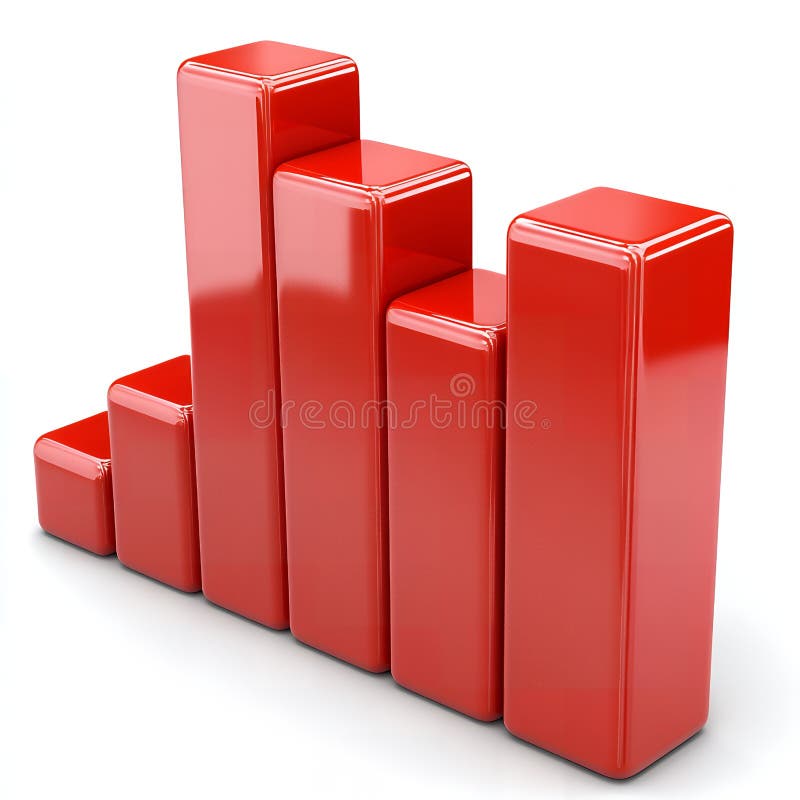
Free with trial A 3D bar chart displays four bars in descending order of height: green, purple, blue, and pink, set against a white background. Clear details and vibrant colors enhance visual appeal. Decrease bar chart icon illustrations 3D Bar Chart With Green Purple Blue And Pink Bars In Descending Order graph decrease. A 3D bar chart displays four bars in descending order of height: green. A 3D bar chart displays four bars in descending order of height: green, purple, blue, and pink, set against a white background. Clear details and vibrant colors enhance visual appeal
Free with trial Arrow trend-down icon vector set on white background. EPS 10. Decrease bar chart icon vectors Arrow trend-down icon isolated on white background. Arrow trend-down icon vector set on white background. EPS 10
Free with trial Arrow trend-down icon vector set on white background. EPS 10. Decrease bar chart icon vectors Arrow trend-down icon isolated on white background. Arrow trend-down icon vector set on white background. EPS 10
Free with trial Arrow trend-down icon vector set on white background. EPS 10. Decrease bar chart icon vectors Arrow trend-down icon isolated on white background. Arrow trend-down icon vector set on white background. EPS 10
Free with trial Arrow trend-down icon vector set on white background. EPS 10. Decrease bar chart icon vectors Arrow trend-down icon isolated on white background. Arrow trend-down icon vector set on white background. EPS 10
Free with trial Arrow trend-down icon vector set on white background. EPS 10. Decrease bar chart icon vectors Arrow trend-down icon isolated on white background. Arrow trend-down icon vector set on white background. EPS 10
Free with trial Arrangement shows white squares with bar charts, green and red squares with arrows indicating positive and negative trends, and a question mark, on a white background. Decrease bar chart icon illustrations Bar charts show mixed trends with positive and negative arrows beside a question mark. Arrangement shows white squares with bar charts, green and red squares with arrows indicating positive and negative trends, and a question mark, on a white background
Free with trial Graph icon indicating growth and data analysis, perfect for business presentations and financial reports. visual representation of progress ,Generative ai. Decrease bar chart icon illustrations Graph icon, a comprehensive symbol of data analysis, growth, and business trends for effective presentations. Graph icon indicating growth and data analysis, perfect for business presentations and financial reports. visual representation of progress ,Generative ai
Free with trial Declining bar graph on a trolley, showing a downward arrow, stock market trend, loss illustration. Decrease bar chart icon vectors Declining bar graph on a trolley, showing a downward arrow, stock market trend, loss illustration
Free with trial Web report line icon. Continuous one line with curl. Column graph sign. Growth diagram symbol. Web report single outline ribbon. Loop curve pattern. Vector. Decrease bar chart icon vectors Web report line icon. Column graph sign. Continuous line with curl. Vector. Web report line icon. Continuous one line with curl. Column graph sign. Growth diagram symbol. Web report single outline ribbon. Loop curve pattern. Vector
Free with trial Web report line icon. Continuous one line with curl. Column graph sign. Growth diagram symbol. Web report single outline ribbon. Loop curve pattern. Vector. Decrease bar chart icon illustrations Web report line icon. Column graph sign. Continuous line with curl. Vector. Web report line icon. Continuous one line with curl. Column graph sign. Growth diagram symbol. Web report single outline ribbon. Loop curve pattern. Vector
Free with trial Graph and diagram from boats with decrease. Finance and business concepts. 3D Illustration isolated. 3D rendering on blue background. Decrease bar chart icon illustrations Graph and diagram from boats with decrease. Finance and business concepts. 3D Illustration isolated.
Free with trial Minimal set of Wholesale goods, Graph chart and Credit card line icons. Phone, cellphone ui interface mockup. Work home icons. For web development. Vector. Decrease bar chart icon vectors Minimal set of Wholesale goods, Graph chart and Credit card line icons. For web development. Vector. Minimal set of Wholesale goods, Graph chart and Credit card line icons. Phone, cellphone ui interface mockup. Work home icons. For web development. Vector
Free with trial Business Analytics And Data Visualization Line Icon Set. Financial Growth, Market Trends, And Performance Analysis Outline Symbol Collection. Editable Stroke. Isolated Vector Illustration. Decrease bar chart icon vectors Business Analytics And Data Visualization Line Icon Set. Financial Growth, Market Trends, And Performance Analysis
Free with trial Minimalist graph icon showing growth and fluctuation. Perfect for finance, business reports, market analysis, and data presentation projects. Decrease bar chart icon vectors Minimalist graph icon showing growth and fluctuation. Perfect for finance, business reports, market analysis, and data
Free with trial This image showcases vibrant 3D bar and pie charts, illustrating growth and statistical data. Perfect for presentations or reports on financial success. Decrease bar chart icon illustrations Colorful 3D Bar and Pie Charts Showing Business Growth and Statistics. This image showcases vibrant 3D bar and pie charts, illustrating growth and statistical data. Perfect for presentations or reports on financial success.
Free with trial Young businessman analyzing a descending financial candlestick chart on a computer screen. Financial Instability concept. trend modern vector flat illustration. Decrease bar chart icon vectors Young businessman analyzing a descending financial candlestick chart on a computer screen. Financial Instability concept.