Free with trial A cheerful 3D-rendered cartoon businessman sits confidently beside a rising bar graph, holding a pie chart, symbolizing successful business growth and financial planning. He appears relaxed and optimistic, suggesting achievement and future prosperity. Decrease bar chart icon illustrations Smiling 3D Cartoon Businessman Analyzing Financial Growth Charts. A cheerful 3D-rendered cartoon businessman sits confidently beside a rising bar graph, holding a pie chart, symbolizing successful business growth and financial planning. He appears relaxed and optimistic, suggesting achievement and future prosperity.
Free with trial Vector graphic showing business profit and loss statement with green upward trends, red declines, percentages, calculator, and money icons. Decrease bar chart icon illustrations Illustrated Profit and Loss Financial Report with Charts and Graphs. Vector graphic showing business profit and loss statement with green upward trends, red declines, percentages, calculator, and money icons
Free with trial Elevate your everyday style with Abu Taher's collection of Typography T-Shirt Designs, where words meet artistry. Decrease bar chart icon vectors Collection of 32 icons representing increase and decrease in business and finance. Elevate your everyday style with Abu Taher's collection of Typography T-Shirt Designs, where words meet artistry
Free with trial A collection of nine simple, solid black icons on a white background, illustrating concepts of decline, loss, and negative trends using various charts like bar graphs, line graphs, and pie charts with downward pointing arrows. Decrease bar chart icon vectors Set of black icons representing financial decrease and downward trends. A collection of nine simple, solid black icons on a white background, illustrating concepts of decline, loss, and negative trends using various charts like bar graphs, line graphs, and pie charts with downward pointing arrows
Free with trial A clean, minimalist smartphone app interface displays a spending tracker. A bar graph shows spending increase, highlighting financial growth. The design is black and white, emphasizing data clarity. Decrease bar chart icon illustrations Smartphone App UI: Minimalist Black & White Spending Tracker with Rising Graph. A clean, minimalist smartphone app interface displays a spending tracker. A bar graph shows spending increase, highlighting financial growth. The design is black and white, emphasizing data clarity
Free with trial An illustration showing a decreasing bar graph and a warning sign indicating financial loss. Flat style with vibrant colors on a black background. Decrease bar chart icon vectors Financial Downturn Warning: Declining Chart and Alert Symbol on Black Background. An illustration showing a decreasing bar graph and a warning sign indicating financial loss. Flat style with vibrant colors on a black background.
Free with trial A minimalist teal illustration shows a declining bar graph with a downward arrow against a stark black background. Indicating negative trend and recession. Decrease bar chart icon vectors Downward trend graph illustration indicating loss or decline in a minimalist style. A minimalist teal illustration shows a declining bar graph with a downward arrow against a stark black background. Indicating negative trend and recession.
Free with trial A chart with a growing trend. Financial Flat vector illustration isolated on white background. Decrease bar chart icon illustrations A graph with a dollar sign. A chart with a growing trend. Financial Flat vector illustration isolated on white background.
Free with trial A set of nine minimalist vector icons depicting various types of charts and graphs including bar charts, progress bars, and trend lines for data visualization and analytics. Decrease bar chart icon vectors Collection of simple black glyph icons representing business charts graphs and data analysis. A set of nine minimalist vector icons depicting various types of charts and graphs including bar charts, progress bars, and trend lines for data visualization and analytics
Free with trial Simple icon representing a bar graph losing value, with four black bars getting smaller. Decrease bar chart icon vectors Graph showing market crash with big arrow pointing down. Simple icon representing a bar graph losing value, with four black bars getting smaller
Free with trial A minimalist illustration showing a decreasing bar graph with an arrow, and a magnifying glass over a dollar sign. Flat style with grey and orange. Decrease bar chart icon vectors Economic Downturn and Financial Analysis: Decrease Graph with Magnifying Glass Over Dollar Sign. A minimalist illustration showing a decreasing bar graph with an arrow, and a magnifying glass over a dollar sign. Flat style with grey and orange.
Free with trial Collection of black flat design icons illustrating downward trending graphs, magnifying glass analysis, broken server, report documents, and gear with bar chart, used for business and finance visuals. Generative AI. Decrease bar chart icon vectors Black flat design icons set showing declining business graphs charts magnifying glass office documents computer screen and. Collection of black flat design icons illustrating downward trending graphs, magnifying glass analysis, broken server, report documents, and gear with bar chart, used for business and finance visuals. Generative AI
Free with trial The worldwide market is currently facing a financial slowdown, marked by a decrease in currency value, increasing inflation rates, and an economic recession that is moving in a negative direction. Decrease bar chart icon vectors Global market experiencing financial downturn, showing a currency decline, rising inflation, and economic recession with a. The worldwide market is currently facing a financial slowdown, marked by a decrease in currency value, increasing inflation rates, and an economic recession that is moving in a negative direction
Free with trial Document is being analyzed with a bar graph and pie chart representing market data. Decrease bar chart icon vectors Document with charts showing market analysis and financial report. Document is being analyzed with a bar graph and pie chart representing market data
Free with trial Colorful bar charts illustrating positive and negative business trends from january to may provide a clear visual representation of performance. Decrease bar chart icon vectors Colorful bar charts illustrating positive and negative business trends from january to may provide a clear visual
Free with trial Colorful bar charts illustrating positive and negative business trends from january to may provide a clear visual representation of performance. Decrease bar chart icon illustrations Colorful bar charts illustrating positive and negative business trends from january to may provide a clear visual
Free with trial Reduce energy usage, in line design, green. Reduce, energy, usage, conservation, efficiency, sustainable, power on white background vector. Reduce energy usage editable stroke icon. Decrease bar chart icon vectors Reduce energy usage, in line design, green. Reduce, energy, usage, conservation, efficiency, sustainable, power on white
Free with trial Reduce energy usage, in line design. Reduce, energy, usage, conservation, efficiency, sustainable, power on white background vector. Reduce energy usage editable stroke icon. Decrease bar chart icon vectors Reduce energy usage, in line design. Reduce, energy, usage, conservation, efficiency, sustainable, power on white
Free with trial This image shows a declining bar graph and a person reacting to a financial crisis. Vector illustration design using ai tool. Decrease bar chart icon vectors Economic collapse is coming. This image shows a declining bar graph and a person reacting to a financial crisis. Vector illustration design using ai tool.
Free with trial High-Quality Vector Icons. Decrease bar chart icon vectors Rise icon vector, filled. High-Quality Vector Icons
Free with trial This image showcases six vibrant icons representing various data visualization methods, including pie charts, bar graphs, and gauges. These colorful and engaging visuals are perfect for presentations or reports and were generated by AI. They offer a quick and easy way to represent data in a clear a. Decrease bar chart icon illustrations Colorful Data Visualization Icons. This image showcases six vibrant icons representing various data visualization methods, including pie charts, bar graphs, and gauges. These colorful and engaging visuals are perfect for presentations or reports and were generated by AI. They offer a quick and easy way to represent data in a clear a
Free with trial Wooden blocks with arrow up and down with percentage icon. Business planning for target achievement. Measure of performance for a specific objective. 3d render. Decrease bar chart icon illustrations Wooden blocks with arrow up and down with percentage icon
Free with trial Wooden blocks with arrow up and down on Balance scale of percentage icon. Business planning for target achievement. Measure of performance for a specific objective. 3d render. Decrease bar chart icon illustrations Wooden blocks with arrow up and down on Balance scale of percentage icon
Free with trial Business graph is being drawn on a piece of paper with a pencil. Decrease bar chart icon illustrations Pencil drawing business graph on paper with pie chart. Business graph is being drawn on a piece of paper with a pencil
Free with trial A cheerful cartoon businessman in a suit stands proudly beside a rising bar graph, illustrating positive financial growth and business success. Decrease bar chart icon illustrations Smiling Businessman Presenting Financial Growth Chart. A cheerful cartoon businessman in a suit stands proudly beside a rising bar graph, illustrating positive financial growth and business success.
Free with trial This image showcases a vibrant 3D rendering of various financial charts, including bar graphs, pie charts, and a rising arrow, symbolizing growth and profitability. Ideal for presentations, reports, and financial articles. Decrease bar chart icon illustrations Colorful 3D Financial Charts Showing Growth and Profit. This image showcases a vibrant 3D rendering of various financial charts, including bar graphs, pie charts, and a rising arrow, symbolizing growth and profitability. Ideal for presentations, reports, and financial articles.
Free with trial A 3D figure sits on a platform reviewing financial data, using a laptop to analyze bar graphs, pie charts and line graphs representing business performance and growth. Decrease bar chart icon illustrations 3D Character Analyzing Business Charts and Graphs on Laptop. A 3D figure sits on a platform reviewing financial data, using a laptop to analyze bar graphs, pie charts and line graphs representing business performance and growth.
Free with trial Set of twelve colorful line icons representing various types of data visualization methods, including bar charts, line graphs, pie charts, and more. Perfect for presentations, reports, or websites. Decrease bar chart icon illustrations Data Visualization Icons. Set of twelve colorful line icons representing various types of data visualization methods, including bar charts, line graphs, pie charts, and more. Perfect for presentations, reports, or websites.
Free with trial Declining Bar Graph with Arrow Showing Increase and Downward Trend. Decrease bar chart icon vectors Declining Bar Graph with Arrow Showing Increase and Downward Trend
Free with trial Hourglass with sand flowing, a lightning bolt, and bar chart aligned as decreasing bars. Ideal for time management, efficiency, productivity, energy flow, deadlines, data analysis simple flat. Decrease bar chart icon vectors Hourglass with Lightning Bolt and Graph Bars Representing Time, Energy, and Productivity. Hourglass with sand flowing, a lightning bolt, and bar chart aligned as decreasing bars. Ideal for time management, efficiency, productivity, energy flow, deadlines, data analysis simple flat
Free with trial Presentation board with decreasing bar graph for business statistics. Decrease bar chart icon vectors Presentation board with decreasing bar graph for business statistics
Free with trial This image depicts a vibrant and modern representation of financial success, featuring 3D bar graphs, pie charts, and a calculator, all set against a clean white background. The upward-trending graph showcases growth and progress. Decrease bar chart icon illustrations Colorful 3D Financial Charts and Calculator Showing Business Growth. This image depicts a vibrant and modern representation of financial success, featuring 3D bar graphs, pie charts, and a calculator, all set against a clean white background. The upward-trending graph showcases growth and progress.
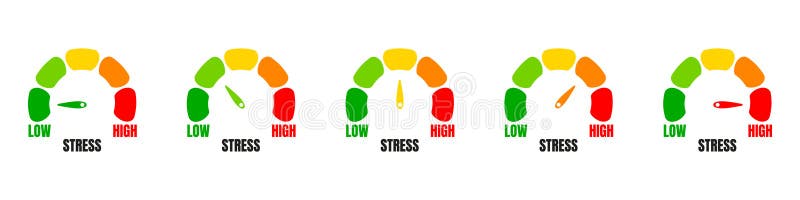
Free with trial Stress level meter, progress bar gauge isolated over white background, stress meter vector medical illustration. vector. Decrease bar chart icon vectors Stress level meter, progress bar gauge isolated over white background, stress meter vector medical illustration
Free with trial Declining bar graph illustration, business, financial, and economic data. Decrease bar chart icon vectors Declining bar graph illustration, business, financial, and economic data
Free with trial This image shows a calculator next to colorful 3D bar charts and pie charts illustrating business growth and financial success. The vibrant colors and upward-trending graph create a visually appealing representation of positive financial results. Decrease bar chart icon illustrations Colorful Calculator and 3D Charts Showing Business Growth. This image shows a calculator next to colorful 3D bar charts and pie charts illustrating business growth and financial success. The vibrant colors and upward-trending graph create a visually appealing representation of positive financial results.
Free with trial Detailed 3D rendering of colorful bar charts, pie charts, line graphs, and calculator showcasing financial data analysis and business growth. Decrease bar chart icon illustrations Colorful 3D Business Charts, Graphs, and Calculator for Financial Success. Detailed 3D rendering of colorful bar charts, pie charts, line graphs, and calculator showcasing financial data analysis and business growth.
Free with trial This 3D rendering showcases colorful bar graphs, pie charts, and a calculator, vividly illustrating concepts of business growth, financial success, and data analysis. The upward-trending arrow emphasizes positive progress. Decrease bar chart icon illustrations Colorful 3D Charts and Calculator Illustrating Business Growth and Financial Success. This 3D rendering showcases colorful bar graphs, pie charts, and a calculator, vividly illustrating concepts of business growth, financial success, and data analysis. The upward-trending arrow emphasizes positive progress.
Free with trial This vibrant image showcases a collection of colorful 3D charts and graphs, including bar graphs, pie charts, and a line graph, all illustrating positive growth. A calculator and pencil are included, emphasizing the analytical and planning aspects of business success. Perfect for illustrating finan. Decrease bar chart icon illustrations Colorful 3D Financial Charts and Graphs with Calculator for Business Growth Presentation. This vibrant image showcases a collection of colorful 3D charts and graphs, including bar graphs, pie charts, and a line graph, all illustrating positive growth. A calculator and pencil are included, emphasizing the analytical and planning aspects of business success. Perfect for illustrating finan
Free with trial Business bar graph with decreasing bars and a downward arrow representing economic loss and market fall. Decrease bar chart icon vectors Business bar graph with decreasing bars and a downward arrow representing economic loss and market fall
Free with trial A grid of 28 simple black line art icons on a white background depicting various financial charts graphs and business related symbols including bar charts pie charts computers and money. Decrease bar chart icon vectors Collection of 28 minimalist line art icons representing financial data charts and business concepts graph. A grid of 28 simple black line art icons on a white background depicting various financial charts graphs and business related symbols including bar charts pie charts computers and money
Free with trial Hand drawn declining bar graph with a downward arrow illustrating a financial recession and business failure. Decrease bar chart icon vectors Hand drawn declining bar graph with a downward arrow illustrating a financial recession and business failure
Free with trial Hand drawn bar graph showing a downward trend with a sale tag for discounts price reductions and market decline. Decrease bar chart icon vectors Hand drawn bar graph showing a downward trend with a sale tag for discounts price reductions and market decline
Free with trial Stairway symbol to reach achievement. Staircase vector icon isolated on white background. The step up to be successful of business. Decrease bar chart icon vectors Stairway symbol to reach achievement. Staircase vector icon isolated on white background
Free with trial Stairway symbol to reach achievement. Staircase vector icon isolated on white background. The step up to be successful of business. Decrease bar chart icon vectors Stairway symbol to reach achievement. Staircase vector icon isolated on white background
Free with trial Stairway symbol to reach achievement. Staircase vector icon isolated on white background. The step up to be successful of business. Decrease bar chart icon vectors Stairway symbol to reach achievement. Staircase vector icon isolated on white background
Free with trial Set line Website with stocks market Search engine Browser setting Financial growth increase window Photo retouching and mail and icon. Vector. Decrease bar chart icon vectors Set line Website with stocks market, Search engine, Browser setting, Financial growth increase, window, Photo retouching. Set line Website with stocks market Search engine Browser setting Financial growth increase window Photo retouching and mail and icon. Vector.
Free with trial Business Icons Set isolated on black background. Simple vector logo. Decrease bar chart icon vectors Business Icons Set isolated on black background
Free with trial Business performance, negative trends, data analysis, economic decline, search results, user concerns. Sad emoticon, graph with downward trend magnifying glass. Business and negative trends. Decrease bar chart icon vectors Declining Graph with Sad Face and Search Bar Negative Trends and Analysis. Business performance, negative trends, data analysis, economic decline, search results, user concerns. Sad emoticon, graph with downward trend magnifying glass. Business and negative trends
Free with trial Flat design illustration showing downward trend with graph, coins and descending arrow. Demonstrates financial loss and market decline. Decrease bar chart icon vectors Declining financial graph with downward trend and currency. Flat design illustration showing downward trend with graph, coins and descending arrow. Demonstrates financial loss and market decline.
Free with trial Business finance and growth icons illustrating statistics charts trends progress and success. Decrease bar chart icon vectors Finance and growth icons showing progress and business performance blue navy. Business finance and growth icons illustrating statistics charts trends progress and success
Free with trial This image showcases a large collection of minimalist, line-style icons representing various charts and graphs. These icons depict data visualization elements commonly used in business, analytics, and reporting. high-quality professional. Decrease bar chart icon vectors Collection of diverse line style charts and graphs icons displayed neatly. This image showcases a large collection of minimalist, line-style icons representing various charts and graphs. These icons depict data visualization elements commonly used in business, analytics, and reporting. high-quality professional
Free with trial Dollar Coins with Upward Arrows Representing Financial Growth in Minimalist Flat Style. Decrease bar chart icon vectors Dollar Coins with Upward Arrows Representing Financial Growth in Minimalist Flat Style
Free with trial A comprehensive collection of flat line design icons representing key concepts in business, finance, and data analytics. The set includes various charts (bar, line, pie), a speedometer, a magnifying glass with a graph, financial documents with checkmarks, a target with an arrow, a dollar sign, a percentage symbol, and directional arrows for growth and decline. These versatile vector elements are ideal for presentations, reports, websites, and applications focused on statistics, performance, strategy, and financial insights. Decrease bar chart icon illustrations Business and Data Analytics Flat Line Icons Set. A comprehensive collection of flat line design icons representing key concepts in business, finance, and data analytics. The set includes various charts (bar, line, pie), a speedometer, a magnifying glass with a graph, financial documents with checkmarks, a target with an arrow, a dollar sign, a percentage symbol, and directional arrows for growth and decline. These versatile vector elements are ideal for presentations, reports, websites, and applications focused on statistics, performance, strategy, and financial insights.
Free with trial Vector illustration of a downward arrow symbolizing economic decline, recession, and financial downturn. Decrease bar chart icon vectors Vector illustration of a downward arrow symbolizing economic decline, recession
Free with trial Dollar and bitcoin Coins with Upward Arrows Representing Financial Growth in Minimalist Flat Style. Decrease bar chart icon vectors Dollar and bitcoin Coins with Upward Arrows Representing Financial Growth in Minimalist Flat Style
Free with trial A black and white line drawing depicts a magnifying glass focusing on a gear, a descending bar graph, and a. Decrease bar chart icon illustrations Decline Analysis Magnifying Glass, Gear, and Downward Graph. A black and white line drawing depicts a magnifying glass focusing on a gear, a descending bar graph, and a.
Free with trial Graph Declining with Arrow Line Art Minimalist Representation. Decrease bar chart icon vectors Graph Declining with Arrow Line Art Minimalist Representation
Free with trial Dollar Coins with Upward and Downward Arrows Representing Financial Growth and Decline in Minimalist Flat Style. Decrease bar chart icon vectors Dollar Coins with Upward and Downward Arrows Representing Financial Growth and Decline in Minimalist Flat Style.
Free with trial Business graph with up arrow down arrow logo template. Decrease bar chart icon vectors Business graph with up arrow down arrow logo template
Free with trial This vector illustration shows a set of black graph icons with rising and falling charts indicated by arrows showing trends in data with clear simple design and sharp edges calm. Generative AI. Decrease bar chart icon vectors Black graph icons set rising and falling charts with arrows vector illustration simple design. This vector illustration shows a set of black graph icons with rising and falling charts indicated by arrows showing trends in data with clear simple design and sharp edges calm. Generative AI
Free with trial Green up and red down 3d arrow graph showing rising, descending trend, business result, profit or loss symbol symbol. Business arrow, goals concept. 3d world money symbols. Financial growth. Decrease bar chart icon illustrations Green up and red down 3d arrow graph showing rising, descending trend, business result, 3d world money symbols. Financial growth. Green up and red down 3d arrow graph showing rising, descending trend, business result, profit or loss symbol symbol. Business arrow, goals concept. 3d world money symbols. Financial growth
Free with trial Green up and red down 3d arrow graph showing rising, descending trend, business result, profit or loss symbol symbol. Business arrow, goals concept. 3d world money symbols. Financial growth. Decrease bar chart icon illustrations Green up and red down 3d arrow graph showing rising, descending trend, business result, 3d world money symbols. Financial growth. Green up and red down 3d arrow graph showing rising, descending trend, business result, profit or loss symbol symbol. Business arrow, goals concept. 3d world money symbols. Financial growth