Free with trial Green up and red down 3d arrow graph showing rising, descending trend, business result, profit or loss symbol symbol. Business arrow, goals concept. 3d world money symbols. Financial growth. Decrease bar chart icon illustrations Green up and red down 3d arrow graph showing rising, descending trend, business result, 3d world money symbols. Financial growth. Green up and red down 3d arrow graph showing rising, descending trend, business result, profit or loss symbol symbol. Business arrow, goals concept. 3d world money symbols. Financial growth
Free with trial Graphic diagram illustration taken down and cut using scissors. loss or decline. flat design style. Suitable for use in reports, illustrations, presentations, etc. vector design template. Decrease bar chart icon vectors Graphic diagram illustration taken down and cut using scissors. loss or decline. flat design style. Suitable for use in reports
Free with trial Declining bar graph, decrease bar chart solid icon, diagram concept, graph down vector sign on white background, glyph style icon for mobile concept and web design. Vector graphics. Decrease bar chart icon vectors Declining bar graph, decrease bar chart solid icon, diagram concept, graph down vector sign on white background, glyph
Free with trial Green up and red down 3d arrow graph showing rising, descending trend, business result, profit or loss symbol symbol. Business arrow, goals concept. 3d world money symbols. Financial growth. Decrease bar chart icon illustrations Green up and red down 3d arrow graph showing rising, descending trend, business result, 3d world money symbols. Financial growth. Green up and red down 3d arrow graph showing rising, descending trend, business result, profit or loss symbol symbol. Business arrow, goals concept. 3d world money symbols. Financial growth
Free with trial Green up and red down 3d arrow graph showing rising, descending trend, business result, profit or loss symbol symbol. Business arrow, goals concept. 3d world money symbols. Financial growth. Decrease bar chart icon illustrations Green up and red down 3d arrow graph showing rising, descending trend, business result, 3d world money symbols. Financial growth. Green up and red down 3d arrow graph showing rising, descending trend, business result, profit or loss symbol symbol. Business arrow, goals concept. 3d world money symbols. Financial growth
Free with trial Green up and red down 3d arrow graph showing rising, descending trend, business result, profit or loss symbol symbol. Business arrow, goals concept. 3d world money symbols. Financial growth. Decrease bar chart icon illustrations Green up and red down 3d arrow graph showing rising, descending trend, business result, 3d world money symbols. Financial growth. Green up and red down 3d arrow graph showing rising, descending trend, business result, profit or loss symbol symbol. Business arrow, goals concept. 3d world money symbols. Financial growth
Free with trial Financial crisis concept. Decreasing graph with falling columns. Vector illustration showing recession, bankruptcy, and economic decline. Decrease bar chart icon vectors Financial crisis concept. Decreasing graph with falling columns. Vector illustration showing recession, bankruptcy
Free with trial Economy growth arrow icons on white. Decrease bar chart icon illustrations Economy growth arrow icons
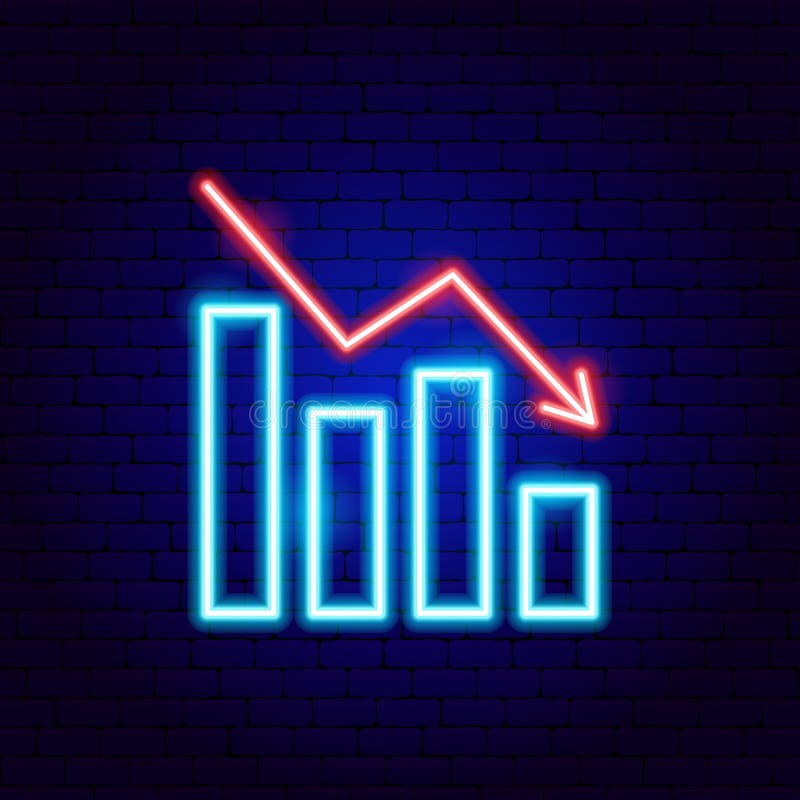
Free with trial Loss Graph Neon Sign. Vector Illustration of Analytics Data Symbol. Decrease bar chart icon vectors Loss Graph Neon Sign
Free with trial Line graph with a green line and a red dot on top. The red dot is located at the top left corner of the graph. Decrease bar chart icon illustrations Graph with a green line and a red dot
Free with trial This image showcases a collection of finance and government icons, generated by AI, perfect for use in presentations, reports, or websites related to business, economics, or politics. The stylized monochrome design provides a professional and consistent aesthetic. Decrease bar chart icon illustrations Finance and Government Icons
Free with trial Business data is visually represented in black and white through various charts and graphs illustrating growth analysis and strategic planning for financial reporting showing a clear picture of market. Decrease bar chart icon vectors Black and white business data visualization with charts and graphs showing growth and analysis for financial reporting and. Business data is visually represented in black and white through various charts and graphs illustrating growth analysis and strategic planning for financial reporting showing a clear picture of market
Free with trial Graph showing a line that is green and has a black background. The line is going up and to the right. Decrease bar chart icon illustrations Graph showing a line that is green and has a black background
Free with trial Graph with a green arrow pointing upwards. The graph is labeled with numbers and the numbers are increasing. Decrease bar chart icon illustrations Graph with a green arrow pointing upwards
Free with trial A seamless pattern featuring various business and finance-related doodles, including graphs, charts, currencies, and other financial symbols. The doodles are drawn in a simple line style on a white background. This image can be used as a background or texture for presentations, reports, or websites related to business, finance, and economics. Decrease bar chart icon vectors Business finance doodle pattern. A seamless pattern featuring various business and finance-related doodles, including graphs, charts, currencies, and other financial symbols. The doodles are drawn in a simple line style on a white background. This image can be used as a background or texture for presentations, reports, or websites related to business, finance, and economics.
Free with trial A comprehensive set of minimalist linear icons depicting financial analytics and business trends, featuring stacks of coins and both upward and downward trending bar charts. Decrease bar chart icon vectors Linear Business and Financial Growth Icon Set for Analytics, Investment, and Economic Trend Visualization. A comprehensive set of minimalist linear icons depicting financial analytics and business trends, featuring stacks of coins and both upward and downward trending bar charts.
Free with trial Two different graphs with a downward trend. One is red and the other is white. Decrease bar chart icon illustrations Two different graphs with a downward trend
Free with trial A minimalist, flat design illustration featuring a simple line graph. The graph has a blue, curved line representing data that initially dips and then rises, with a prominent blue dot marking a key point. It is presented against a clean white background with a black coordinate system, including axes labeled with 'x' and tick marks. This graphic is ideal for representing concepts related to data analysis, growth, trends, statistics, and mathematical functions. Decrease bar chart icon vectors Abstract Graph Curve with Axes and Data Point. A minimalist, flat design illustration featuring a simple line graph. The graph has a blue, curved line representing data that initially dips and then rises, with a prominent blue dot marking a key point. It is presented against a clean white background with a black coordinate system, including axes labeled with 'x' and tick marks. This graphic is ideal for representing concepts related to data analysis, growth, trends, statistics, and mathematical functions.
Free with trial This image contains a collection of 16 line icons representing various data visualization and time-related concepts. The icons are circular and use a consistent color scheme, making them suitable for use in presentations, reports, or websites. The style is clean and modern. Decrease bar chart icon illustrations Data Visualization Icons. This image contains a collection of 16 line icons representing various data visualization and time-related concepts. The icons are circular and use a consistent color scheme, making them suitable for use in presentations, reports, or websites. The style is clean and modern.
Free with trial Set of 16 line icons representing various types of charts, graphs, clocks, and data-related symbols. Perfect for business presentations, reports, or website design. Clean and modern style. Decrease bar chart icon illustrations Data Visualization Icons. Set of 16 line icons representing various types of charts, graphs, clocks, and data-related symbols. Perfect for business presentations, reports, or website design. Clean and modern style.
Free with trial This 3D illustration features a series of vertical bars arranged in a descending sequence, representing a decline in data. A smooth, continuous line graph follows the top of the bars, emphasizing the negative trajectory. The color palette uses shades of blue and light gray against a clean white background, creating a professional and minimalist aesthetic suitable for financial or analytical. Decrease bar chart icon vectors A three dimensional bar chart showing a downward trend with a line graph overlay. This 3D illustration features a series of vertical bars arranged in a. This 3D illustration features a series of vertical bars arranged in a descending sequence, representing a decline in data. A smooth, continuous line graph follows the top of the bars, emphasizing the negative trajectory. The color palette uses shades of blue and light gray against a clean white background, creating a professional and minimalist aesthetic suitable for financial or analytical
Free with trial A grid of various icons related to business technology and data analysis. Generative AI. Decrease bar chart icon illustrations Collection of Business and Technology Icons Set. A grid of various icons related to business technology and data analysis. Generative AI
Free with trial A set of sixteen modern line icons depicting various business and finance concepts, including graphs, charts, planning, ideas, and global connectivity. Perfect for presentations, reports, and websites. Decrease bar chart icon vectors Collection of Business and Finance Line Icons Set. A set of sixteen modern line icons depicting various business and finance concepts, including graphs, charts, planning, ideas, and global connectivity. Perfect for presentations, reports, and websites.
Free with trial A stylized image depicts a magnifying glass focusing on a declining bar graph being passed from one hand to another. Decrease bar chart icon illustrations Declining Market Analysis Magnifying Glass, Graph, Hands. A stylized image depicts a magnifying glass focusing on a declining bar graph being passed from one hand to another.
Free with trial A graph with two lines, one red and one blue. The red line is higher than the blue line, indicating a positive trend. Decrease bar chart icon vectors A graph with a red line and a blue line. A graph with two lines, one red and one blue. The red line is higher than the blue line, indicating a positive trend
Free with trial A magnifying glass focuses on a declining bar graph and an exclamation point, symbolizing a potential problem or risk. Decrease bar chart icon illustrations Declining Sales Alert Magnifying Glass on Downward Graph. A magnifying glass focuses on a declining bar graph and an exclamation point, symbolizing a potential problem or risk.
Free with trial A diverse set of icons representing financial growth, market trends, and business analytics, including line graphs, bar charts, pie charts, and currency symbols. Decrease bar chart icon vectors Collection of Financial and Business Growth Icons and Charts. A diverse set of icons representing financial growth, market trends, and business analytics, including line graphs, bar charts, pie charts, and currency symbols
Free with trial Conceptual image depicting job loss and economic downturn. Decrease bar chart icon illustrations Job Loss Analysis Magnifying Glass on Downward Trend, Layoffs. Conceptual image depicting job loss and economic downturn.
Free with trial A simple line drawing shows a magnifying glass focused on a declining bar graph with a downward arrow and a star. Decrease bar chart icon illustrations Declining Graph Analysis Magnifying Glass, Star, Downward Trend. A simple line drawing shows a magnifying glass focused on a declining bar graph with a downward arrow and a star.
Free with trial A minimalistic line art image depicting a magnifying glass focused on a credit card and a declining bar graph with a. Decrease bar chart icon illustrations Credit Card Debt Analysis Magnifying Glass on Declining Graph. A minimalistic line art image depicting a magnifying glass focused on a credit card and a declining bar graph with a.
Free with trial A comprehensive set of various arrow icons in blue and black, offering a wide range of styles and directions. Perfect for presentations, websites, infographics, and user interfaces needing clear directional cues. Includes straight, curved, and double arrows, providing versatile options for design projects. Decrease bar chart icon illustrations Collection of Diverse Arrows: Blue and Black Directional Icons. A comprehensive set of various arrow icons in blue and black, offering a wide range of styles and directions. Perfect for presentations, websites, infographics, and user interfaces needing clear directional cues. Includes straight, curved, and double arrows, providing versatile options for design projects.
Free with trial A vibrant infographic illustrating business growth, financial analysis, and data visualization with charts, graphs, and icons. Decrease bar chart icon vectors Infographic of Business Growth and Financial Analysis with Charts and Icons. A vibrant infographic illustrating business growth, financial analysis, and data visualization with charts, graphs, and icons
Free with trial Nine flat design icons depict various data charts and graphs in muted blue and teal tones. Decrease bar chart icon vectors Collection of nine flat design data charts and graphs analysis statistics. Nine flat design icons depict various data charts and graphs in muted blue and teal tones.
Free with trial A set of hand drawn black and white graphs and charts for business analysis. Decrease bar chart icon illustrations A collection of six hand drawn graphs and charts in black and white .ai generate. a set of hand drawn black and white graphs and charts for business analysis.
Free with trial This stylized illustration depicts a stock market downturn with a descending arrow and falling graph, symbolizing financial losses and economic recession in a flat style. Decrease bar chart icon vectors Stock Market Downturn and Financial Loss Visualized Through a Graphic Depiction. This stylized illustration depicts a stock market downturn with a descending arrow and falling graph, symbolizing financial losses and economic recession in a flat style.
Free with trial Crypto Triangle Pattern vector Red and Green Candlesticks concept colored seamless pattern. Decrease bar chart icon illustrations Crypto Triangle Pattern vector Red and Green Candlesticks colored seamless pattern
Free with trial A graph with a dollar sign. A growing trend. Financial Flat vector illustration isolated on white background. Decrease bar chart icon vectors A graph with a dollar sign
Free with trial Laptop Displaying Decreasing Graph, Business Downturn Visualization, Economic Recession Concept. Decrease bar chart icon vectors Laptop Displaying Decreasing Graph, Business Downturn Visualization, Economic Recession Concept
Free with trial Red downward trend graph with white falling blocks and coins on a dark red background. Concept of financial loss. 3D Rendering. Decrease bar chart icon illustrations Red downward trend graph with falling blocks and coins. 3D Rendering. Red downward trend graph with white falling blocks and coins on a dark red background. Concept of financial loss. 3D Rendering
Free with trial A collection of hand-drawn, black and white icons representing growth, decline, and financial concepts. The set includes upward and downward arrows, percentage symbols, and a bar graph illustrating trends. The simple line art style makes these icons versatile for various applications, including presentations, infographics, and website design. They convey concepts of progress, success, loss, and market fluctuations. Decrease bar chart icon illustrations Growth and Decline Icons Set. A collection of hand-drawn, black and white icons representing growth, decline, and financial concepts. The set includes upward and downward arrows, percentage symbols, and a bar graph illustrating trends. The simple line art style makes these icons versatile for various applications, including presentations, infographics, and website design. They convey concepts of progress, success, loss, and market fluctuations.
Free with trial A graph with a red arrow pointing upward. The graph is orange and blue. The graph is a representation of a trend or growth. Decrease bar chart icon vectors A graph with a red arrow pointing upward
Free with trial A modern 3D rendered abstract illustration featuring a prominent light blue downward-pointing arrow as its base. On top, a geometric structure is composed of a rectangular block, two stylized bar chart-like elements, and a central dark grey multifaceted polyhedron. Set against a clean white background, this graphic symbolizes concepts like data analysis, business trends, financial decline, foundational structures, or urban development. Its minimalist and digital aesthetic makes it suitable for technology, finance, and corporate presentations, infographics, and web design. Decrease bar chart icon vectors Abstract 3D Data Structure with Downward Arrow. A modern 3D rendered abstract illustration featuring a prominent light blue downward-pointing arrow as its base. On top, a geometric structure is composed of a rectangular block, two stylized bar chart-like elements, and a central dark grey multifaceted polyhedron. Set against a clean white background, this graphic symbolizes concepts like data analysis, business trends, financial decline, foundational structures, or urban development. Its minimalist and digital aesthetic makes it suitable for technology, finance, and corporate presentations, infographics, and web design.
Free with trial A red background with red lines on it. The red lines are in different sizes and are arranged in a way that creates a sense of movement. The image conveys a feeling of energy and excitement. Decrease bar chart icon vectors A red background with red lines on it
Free with trial Collection of thirty charts and graphs icons in line style. Decrease bar chart icon vectors Collection of thirty charts and graphs icons in line style
Free with trial A set of twelve minimalist data visualization icons, featuring charts, graphs, and other data-related symbols. Perfect for presentations, reports, and dashboards, showcasing data analysis and growth trends. The clean design ensures readability and professional appeal. Decrease bar chart icon illustrations Data Visualization Icons
Free with trial Line graph icons set simple clean and smooth line and fill vector icons in black on a white background. Decrease bar chart icon vectors Line graph icons set simple clean and smooth line and fill vector icons in black
Free with trial This cheerful 3D rendered illustration depicts a friendly cartoon businessman confidently presenting positive business growth charts and data, showcasing key performance indicators and financial success. The image is ideal for business, finance, and marketing concepts. Decrease bar chart icon illustrations Charming 3D Cartoon Businessman Presenting Growth Charts and Data. This cheerful 3D rendered illustration depicts a friendly cartoon businessman confidently presenting positive business growth charts and data, showcasing key performance indicators and financial success. The image is ideal for business, finance, and marketing concepts.
Free with trial Dollar Vector illustration on a transparent background. Premium quality symmbols. Line Color vector icons for concept and graphic design. Decrease bar chart icon vectors Dollar network money banking investment. Dollar Vector illustration on a transparent background. Premium quality symmbols. Line Color vector icons for concept and graphic design
Free with trial A grid of 16 black and white icons representing financial growth, currency, and directional arrows, isolated on a transparent background. Decrease bar chart icon vectors Collection of financial and growth icons isolated on transparent background. A grid of 16 black and white icons representing financial growth, currency, and directional arrows, isolated on a transparent background
Free with trial This vibrant image showcases a 3D rendering of colorful cylinders arranged on a pink platform, overlaid with a rising line graph symbolizing upward trends and positive growth. Perfect for illustrating business success, financial progress, or marketing presentations. Decrease bar chart icon illustrations Colorful 3D Cylinders and Rising Line Graph on Pink Platform: Business Growth Concept. This vibrant image showcases a 3D rendering of colorful cylinders arranged on a pink platform, overlaid with a rising line graph symbolizing upward trends and positive growth. Perfect for illustrating business success, financial progress, or marketing presentations.
Free with trial A 3D rendered image of a businessman presenting financial data on a large screen, showing various charts and graphs. Decrease bar chart icon illustrations Businessman Presenting Financial Charts and Graphs. A 3D rendered image of a businessman presenting financial data on a large screen, showing various charts and graphs.
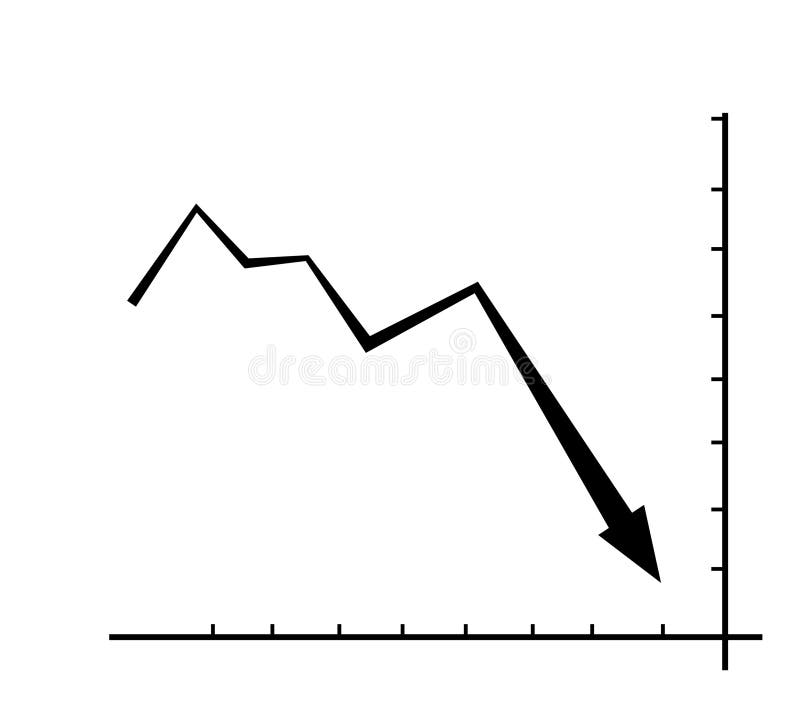
Free with trial Black and white descending graph diagram. loss or decline. flat design style. Suitable for use in reports, illustrations, presentations, etc. vector design template. Decrease bar chart icon vectors Black and white descending graph diagram. loss or decline. flat design style. Suitable for use in reports, illustrations
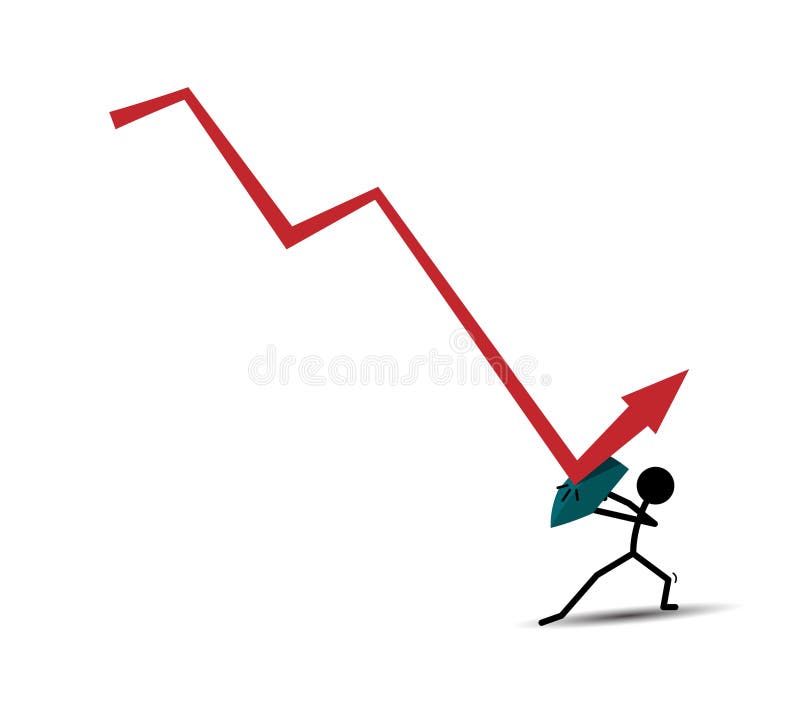
Free with trial Illustration of a graphic diagram going down and being reflected by a shield. . loss or decline. flat design style. Suitable for use in reports, illustrations, presentations, etc. vector design template. Decrease bar chart icon vectors Illustration of a graphic diagram going down and being reflected by a shield. . loss or decline. flat design style. Suitable for
Free with trial Green up and red down 3d arrow graph showing rising, descending trend, business result, profit or loss symbol symbol. Business arrow, goals concept. 3d world money symbols. Financial growth. Decrease bar chart icon illustrations Green up and red down 3d arrow graph showing rising, descending trend, business result, 3d world money symbols. Financial growth. Green up and red down 3d arrow graph showing rising, descending trend, business result, profit or loss symbol symbol. Business arrow, goals concept. 3d world money symbols. Financial growth
Free with trial Green up and red down 3d arrow graph showing rising, descending trend, business result, profit or loss symbol symbol. Business arrow, goals concept. 3d world money symbols. Financial growth. Decrease bar chart icon illustrations Green up and red down 3d arrow graph showing rising, descending trend, business result, 3d world money symbols. Financial growth. Green up and red down 3d arrow graph showing rising, descending trend, business result, profit or loss symbol symbol. Business arrow, goals concept. 3d world money symbols. Financial growth
Free with trial Green up and red down 3d arrow graph showing rising, descending trend, business result, profit or loss symbol symbol. Business arrow, goals concept. 3d world money symbols. Financial growth. Decrease bar chart icon illustrations Green up and red down 3d arrow graph showing rising, descending trend, business result, 3d world money symbols. Financial growth. Green up and red down 3d arrow graph showing rising, descending trend, business result, profit or loss symbol symbol. Business arrow, goals concept. 3d world money symbols. Financial growth
Free with trial Bar chart decrease mosaic of abrupt parts in different sizes and color tones, based on bar chart decrease icon. Vector tremulant parts are organized into collage. Decrease bar chart icon illustrations Bar chart decrease Mosaic Icon of Ragged Pieces. Bar chart decrease mosaic of abrupt parts in different sizes and color tones, based on bar chart decrease icon. Vector tremulant parts are organized into collage
Free with trial Decrease bar chart analytics icon isolated on white background , Decrease bar chart. Decrease bar chart icon illustrations Decrease bar chart analytics icon isolated on white background
Free with trial Declining bar graph, decrease bar chart thin line icon, diagram concept, graph down vector sign on white background, outline style icon for mobile concept and web design. Vector graphics. Decrease bar chart icon vectors Declining bar graph, decrease bar chart thin line icon, diagram concept, graph down vector sign on white background
Free with trial Declining bar graph, decrease bar chart line icon, diagram concept, graph down vector sign on white background, outline style icon for mobile concept and web design. Vector graphics. Decrease bar chart icon vectors Declining bar graph, decrease bar chart line icon, diagram concept, graph down vector sign on white background, outline
Free with trial Declining bar graph, decrease bar chart line and solid icon, diagram concept, graph down vector sign on white background, outline style icon for mobile concept and web design. Vector graphics. Decrease bar chart icon vectors Declining bar graph, decrease bar chart line and solid icon, diagram concept, graph down vector sign on white background
Free with trial Dash Mosaic based on bar chart decrease icon. Mosaic vector bar chart decrease is formed with scattered dash items. Bonus icons are added. Decrease bar chart icon illustrations Line Mosaic Bar Chart Decrease. Dash Mosaic based on bar chart decrease icon. Mosaic vector bar chart decrease is formed with scattered dash items. Bonus icons are added
Free with trial Mesh bar chart decrease web icon vector illustration. Carcass model is created from bar chart decrease flat icon. Network forms abstract bar chart decrease flat carcass. Decrease bar chart icon illustrations Bar Chart Decrease Web Vector Mesh Illustration. Mesh bar chart decrease web icon vector illustration. Carcass model is created from bar chart decrease flat icon. Network forms abstract bar chart decrease flat carcass
Free with trial Glowing mesh bar chart decrease icon with sparkle effect. Abstract illuminated model of bar chart decrease. Shiny wire carcass triangular mesh bar chart decrease icon. Decrease bar chart icon illustrations Flare Mesh 2D Bar Chart Decrease Icon with Flare Spots. Glowing mesh bar chart decrease icon with sparkle effect. Abstract illuminated model of bar chart decrease. Shiny wire carcass triangular mesh bar chart decrease icon
Free with trial Bar chart decrease composition of small circles in different sizes and color tints, based on bar chart decrease icon. Vector small circles are united into blue illustration. Decrease bar chart icon vectors Bar chart decrease Composition Icon of Round Dots. Bar chart decrease composition of small circles in different sizes and color tints, based on bar chart decrease icon. Vector small circles are united into blue illustration.
Free with trial Mosaic bar chart decrease icon and rectangular rubber prints. Flat bar chart decrease mosaic icon of random rotated rectangular elements. Blue caption seal stamps with grunge textures. Decrease bar chart icon illustrations Bar Chart Decrease Mosaic and Scratched Rectangle Stamps. Mosaic bar chart decrease icon and rectangular rubber prints. Flat bar chart decrease mosaic icon of random rotated rectangular elements. Blue caption seal stamps with grunge textures
Free with trial Decrease and Growing graph Icon. Chart with bars declining Raster icon. Finance graph symbol. Raster on white background. Decrease bar chart icon illustrations Decrease and Growing graph Icon. Chart with bars declining Raster icon. Finance graph symbol.
Free with trial Chart with bars declining raster icon. Decrease sign icon. Finance graph symbol. raster on white background. Decrease bar chart icon illustrations Chart with bars declining raster icon. Decrease sign icon. Finance graph symbol.
Free with trial Graph chart decline, fall market stock bar isometric icon. 3d vector illustration. Isolated line art technical drawing. Editable stroke. Decrease bar chart icon illustrations Graph chart decline, fall market stock bar isometric icon. 3d line art technical drawing. Editable stroke vector. graph chart decline, fall market stock bar isometric icon. 3d vector illustration. Isolated line art technical drawing. Editable stroke
Free with trial Graph chart decline, fall market stock bar isometric flat icon. 3d vector colorful illustration. Pictogram isolated on white background. Decrease bar chart icon vectors Graph chart decline, fall market stock bar isometric flat icon. 3d vector
Free with trial Decrease and Growing graph Icon. Chart with bars declining vector icon. Finance graph symbol. Vector on white background. Decrease bar chart icon vectors Decrease and Growing graph Icon. Chart with bars declining vector icon. Finance graph symbol.
Free with trial Down graph chart arrow drop icon. Decrease downward vector market decrease down trend. Decrease bar chart icon vectors Down graph chart arrow drop icon. Decrease downward vector market decrease down trend.
Free with trial Modern and various graph icons, bar chart, pie chart icon for indicating the progress. Decrease bar chart icon vectors Modern and various graph icons, bar chart, pie chart icon
Free with trial 3d colorful bar chart increase decrease sales or purchase diagram. statistic information chart diagrams. Decrease bar chart icon vectors 3D Vector Colorful Increase Decrease Bar Chart Diagram. 3d colorful bar chart increase decrease sales or purchase diagram . statistic information chart diagrams
Free with trial Decrease graph line icon, outline vector sign, linear style pictogram isolated on white. Business bar chart symbol, logo illustration. Editable stroke. Decrease bar chart icon vectors Decrease graph line icon
Free with trial Loss bar chart line icon, outline vector sign, linear style pictogram isolated on white. Symbol, logo illustration. Editable stroke. Decrease bar chart icon vectors Loss bar chart line icon
Free with trial Bar chart down vector sketch icon isolated on background. Hand drawn Bar chart down icon. Bar chart down sketch icon for infographic, website or app. Decrease bar chart icon vectors Bar chart down sketch icon. Bar chart down vector sketch icon isolated on background. Hand drawn Bar chart down icon. Bar chart down sketch icon for infographic, website or app.
Free with trial Bar chart down vector sketch icon isolated on background. Hand drawn Bar chart down icon. Bar chart down sketch icon for infographic, website or app. Decrease bar chart icon vectors Bar chart down sketch icon. Bar chart down vector sketch icon isolated on background. Hand drawn Bar chart down icon. Bar chart down sketch icon for infographic, website or app.
Free with trial Bitcoin board icon flat vector. Chart bar graph. Finance gain decline device. Decrease bar chart icon vectors Bitcoin board icon flat vector. Chart bar graph
Free with trial Bitcoin board icon outline vector. Chart bar graph. Finance gain decline device. Decrease bar chart icon illustrations Bitcoin board icon outline vector. Chart bar graph