Free with trial Vibrant data visualization featuring bar and line graphs, sun icon, and descending trend lines against a stark black background in a flat style. Decrease bar vectors Colorful data visualization with bar graphs, line graph, sun icon, and descending trends on a black background. Vibrant data visualization featuring bar and line graphs, sun icon, and descending trend lines against a stark black background in a flat style.
Free with trial Decreasing bar chart icon in generic style. Market crash sign symbol illustration. Decrease bar vectors Decreasing bar chart icon in generic style. Market crash sign symbol
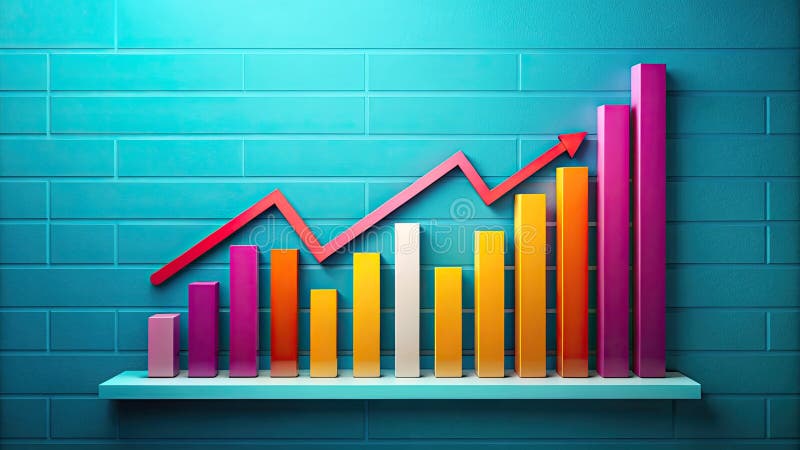
Free with trial Colorful bar chart with a line graph presenting trends and data growth over time, ideal for business analysis, marketing presentations, and financial reports. Decrease bar illustrations Colorful Bar Chart with Line Graph Illustrating Trends and Data Growth over Time For Business, Marketing, Finance and Analysis Use. Colorful bar chart with a line graph presenting trends and data growth over time, ideal for business analysis, marketing presentations, and financial reports
Free with trial Illustration symbolizing economic decline with a descending bar graph and dollar sign. Decrease bar vectors Economic downturn concept with bar chart. Illustration symbolizing economic decline with a descending bar graph and dollar sign
Free with trial A line art illustration shows a bar graph with arrows and a star on a purple background. It represents business growth, success, and achievement of goals. Decrease bar vectors Vector art of line art illustration of a bar graph with arrows and a star on a purple background business growth concept. A line art illustration shows a bar graph with arrows and a star on a purple background. It represents business growth, success, and achievement of goals
Free with trial Decrease vector icon on the white background. EPS 10. Decrease bar vectors Decrease thin line vector icon set. Decrease vector icon on the white background. EPS 10
Free with trial Decrease vector icon on the white background. EPS 10. Decrease bar vectors Decrease thin line vector icon set. Decrease vector icon on the white background. EPS 10
Free with trial Decrease vector icon on the white background. EPS 10. Decrease bar vectors Decrease thin line vector icon set. Decrease vector icon on the white background. EPS 10
Free with trial Decrease vector icon on the white background. EPS 10. Decrease bar vectors Decrease thin line vector icon set. Decrease vector icon on the white background. EPS 10
Free with trial Decrease vector icon on the white background. EPS 10. Decrease bar vectors Decrease thin line vector icon set. Decrease vector icon on the white background. EPS 10
Free with trial Decrease vector icon on the white background. EPS 10. Decrease bar vectors Decrease thin line vector icon set. Decrease vector icon on the white background. EPS 10
Free with trial Decrease vector icon on the white background. EPS 10. Decrease bar vectors Decrease thin line vector icon set. Decrease vector icon on the white background. EPS 10
Free with trial Decrease vector icon on the white background. EPS 10. Decrease bar vectors Decrease thin line vector icon set. Decrease vector icon on the white background. EPS 10
Free with trial Financial report with a declining bar graph, suggesting a negative trend in business performance. Decrease bar vectors Financial report showing declining bar graph and statistics. Financial report with a declining bar graph, suggesting a negative trend in business performance
Free with trial Economic critical crisis concept. The bar graph on red world map background. Recession financial, cryptocurrency, gold, and the stock market. Losing money and cash. Bearish. Decrease bar vectors Economic critical crisis concept. The bar graph on red world map background. Recession financial, cryptocurrency, gold, and the
Free with trial A set of twenty-two black chart icons, illustrating various graph types on a white background. The icons feature line graphs, bar graphs, and pie charts, each depicting trends such as growth, decline, and fluctuations. Magnifying glass icons are used to represent analysis. The charts convey concepts of data visualization, statistical analysis, and business metrics tracking. The minimalistic design is characterized by simple, clean lines and solid fill, suitable for use in reports, presentations, or digital interfaces. Decrease bar vectors Increase and decrease glyph solid icons collection. A set of twenty-two black chart icons, illustrating various graph types on a white background. The icons feature line graphs, bar graphs, and pie charts, each depicting trends such as growth, decline, and fluctuations. Magnifying glass icons are used to represent analysis. The charts convey concepts of data visualization, statistical analysis, and business metrics tracking. The minimalistic design is characterized by simple, clean lines and solid fill, suitable for use in reports, presentations, or digital interfaces.
Free with trial Businessman throwing red line graph arrow to target on falling gold coins bar graph for investment rebalancing and gold market risk management crisis concept. Decrease bar vectors Businessman throwing red line graph arrow to target on falling gold coins bar graph for investment rebalancing and gold market
Free with trial Graph going Up and Down sign with green and red arrows vector. Flat design vector illustration concept of sales bar chart symbol icon with arrow moving down and sales bar chart with arrow moving up. Decrease bar vectors Graph going Up and Down sign with green and red arrows vector. Flat design vector illustration concept of sales bar chart symbol. Graph going Up and Down sign with green and red arrows vector. Flat design vector illustration concept of sales bar chart symbol icon with arrow moving down and sales bar chart with arrow moving up.
Free with trial A colorful business bar graph illustration showing a downward trend and financial loss. The chart features a red arrow pointing down with dollar sign icons, symbolizing economic recession, bankruptcy, or decreasing revenue in a simple style. Decrease bar vectors Business bar chart showing financial decline and money loss with a downward red arrow isolated on white background. A colorful business bar graph illustration. A colorful business bar graph illustration showing a downward trend and financial loss. The chart features a red arrow pointing down with dollar sign icons, symbolizing economic recession, bankruptcy, or decreasing revenue in a simple style
Free with trial This image showcases a 3D bar chart with four distinct vertical bars. The bars vary in height, forming a pattern that. Decrease bar illustrations A 3D bar chart displays a downward trend on a smooth light surface suggesting diminishing returns or financial decline. This image showcases a 3D bar chart with four distinct vertical bars. The bars vary in height, forming a pattern that.
Free with trial A document with bar and line graphs is being examined with a magnifying glass. This suggests a detailed analysis of data, trends, and insights. It is isolated on white background. Decrease bar vectors Vector art of analyzing data with a magnifying glass on a report it shows bar graphs and a line graph indicating trends and. A document with bar and line graphs is being examined with a magnifying glass. This suggests a detailed analysis of data, trends, and insights. It is isolated on white background
Free with trial Line art declining coin bar chart with stack coin icon logo vector illustration design, for business and finance symbol. Decrease bar illustrations Line art declining coin bar chart with stack coin icon logo vector illustration design
Free with trial 3D isometric business chart showing a downward trend with a red arrow and colorful bar graphs on a grid background, isolated on white. Decrease bar illustrations 3D isometric business chart showing a downward trend with a red arrow and colorful bar graphs on a grid background, isolated on
Free with trial A close-up shot shows a businessman in a suit using a marker to draw a sharp downward trend line over a bar graph, symbolizing significant cost reduction and a decrease in percentage. Decrease bar illustrations Businessman drawing a downward trend graph indicating cost reduction and percentage decrease with a marker background image. A close-up shot shows a businessman in a suit using a marker to draw a sharp downward trend line over a bar graph, symbolizing significant cost reduction and a decrease in percentage
Free with trial This image shows a colorful bar graph with a downward trend line, symbolizing decline, loss, or negative performance in a business or financial context on a white background. Decrease bar vectors Vector art of colorful bar graph with downward trend line, depicting decline, loss, or negative performance in business or. This image shows a colorful bar graph with a downward trend line, symbolizing decline, loss, or negative performance in a business or financial context on a white background
Free with trial Colorful bar chart displayed on a polished wooden table, representing data analysis and visualization ,Generative ai. Decrease bar illustrations Colorful bar chart on wooden table, visualizing data analysis, trends, and performance metrics for business insights. Colorful bar chart displayed on a polished wooden table, representing data analysis and visualization ,Generative ai
Free with trial Bar chart showing decreasing bars, with silhouetted heads and a downward arrow. Represents decline, loss, negative trend, recession, or drop in performance. Useful for financial reports, business analysis, or social trends. Decrease bar illustrations Downward trending bar chart with silhouette heads and arrow signifying decline in economy or popularity vector graphic. Bar chart showing decreasing bars, with silhouetted heads and a downward arrow. Represents decline, loss, negative trend, recession, or drop in performance. Useful for financial reports, business analysis, or social trends
Free with trial Decrease vector icon on the white background. EPS 10. Decrease bar vectors Decrease thin line vector icon set. Decrease vector icon on the white background. EPS 10
Free with trial Decrease vector icon on the white background. EPS 10. Decrease bar vectors Decrease thin line vector icon set. Decrease vector icon on the white background. EPS 10
Free with trial Businessman throwing red line graph arrow to target on falling gold bars bar graph for precious metal investment rebalancing and risk management during market crash. Decrease bar vectors Businessman throwing red line graph arrow to target on falling gold bars bar graph for precious metal investment rebalancing and
Free with trial A red bar chart on a dark background symbolizes a stock market crash and financial crisis, indicating an economic downturn and potential losses. Decrease bar illustrations Red Stock Market Crash Depicts Financial Crisis with Declining Bar Chart on Dark Background. A red bar chart on a dark background symbolizes a stock market crash and financial crisis, indicating an economic downturn and potential losses
Free with trial The background is a grid with declining line and bar graphs. A 3D rendering is shown. Decrease bar illustrations The background is a grid with declining line and bar graphs. A 3D rendering is shown
Free with trial Falling red arrow superimposed on a bar graph showing business decline negative growth insolvency financial crisis Can be used as a banner or header image. Decrease bar illustrations Falling red arrow superimposed on a bar graph showing business decline , negative growth, insolvency, financial crisis. Falling red arrow superimposed on a bar graph showing business decline negative growth insolvency financial crisis Can be used as a banner or header image
Free with trial Businessman throwing red line graph arrow to target on falling banknotes bar graph for risk management investment rebalancing and financial loss prevention concept. Decrease bar vectors Businessman throwing red line graph arrow to target on falling banknotes bar graph for risk management investment rebalancing and
Free with trial A vibrant illustration of a bar graph with arrows, representing financial trends and market analysis. The image conveys economic performance and business insights. Decrease bar vectors Vector art of colorful bar graph with arrows indicating growth and decline, symbolizing financial trends, market analysis, and. A vibrant illustration of a bar graph with arrows, representing financial trends and market analysis. The image conveys economic performance and business insights
Free with trial A decreasing bar graph with a downward arrow and coin, symbolizing financial loss and economic decline. This image represents negative growth and market downturns. Decrease bar vectors Vector art of decreasing bar graph with a downward arrow and coin, symbolizing financial loss and economic decline, , indicating. A decreasing bar graph with a downward arrow and coin, symbolizing financial loss and economic decline. This image represents negative growth and market downturns
Free with trial Decreasing Bar Chart with Arrow: Economic Decline Visualization, Business Graph, Financial Performance Overview, Downward Trend Graphic. Decrease bar vectors Decreasing Bar Chart with Arrow: Economic Decline Visualization, Business Graph, Financial Performance Overview, Downward Trend
Free with trial Businessman Hunting Piggy Bank Jumping Down on Falling Stack of Gold Bars Bar Graph with Red Arrow Spear Representing Gold Market Crash Financial Loss and Asset Devaluation. Decrease bar vectors Businessman Hunting Piggy Bank Jumping Down on Falling Stack of Gold Bars Bar Graph with Red Arrow Spear Representing Gold Market
Free with trial Graph going Up and Down sign with green and red arrows vector set. Flat design vector set of a concept of sales bar chart symbol icon with arrow moving down and sales bar chart with arrow moving up. Decrease bar vectors Graph going Up and Down sign with green and red arrows vector set. Flat design vector set of a concept of sales bar chart arrows. Graph going Up and Down sign with green and red arrows vector set. Flat design vector set of a concept of sales bar chart symbol icon with arrow moving down and sales bar chart with arrow moving up.
Free with trial A detailed data visualization illustrating market trends over time. The infographic combines a line chart, which shows fluctuating values and percentages, with a bar chart representing data for specific time intervals. The line chart highlights key data points, such as peaks annotated with values like '1. 24%' and '500K'. The x-axis represents a timeline from January to March, while the y-axis. Decrease bar illustrations A modern market trend analysis visualization combining a bar and line chart for financial data isolated on white background. A detailed data visualization illustrating market trends over time. The infographic combines a line chart, which shows fluctuating values and percentages, with a bar chart representing data for specific time intervals. The line chart highlights key data points, such as peaks annotated with values like '1.24%' and '500K'. The x-axis represents a timeline from January to March, while the y-axis
Free with trial Abstract blue 3D bar chart with glowing line graph shows market growth. Digital data visualization indicates positive trend. Financial analysis graphic, with bokeh. Decrease bar illustrations Abstract blue 3D bar chart with glowing line graph shows market growth. Digital data visualization indicates positive trend.
Free with trial Red bar chart displays a stock market decline against a dark background, representing a financial crisis or economic downturn. This image highlights negative trends and losses in the market. Decrease bar illustrations Red Bar Chart Displaying Stock Market Decline on Dark Background for Financial Crisis Concept. Red bar chart displays a stock market decline against a dark background, representing a financial crisis or economic downturn. This image highlights negative trends and losses in the market
Free with trial 3D rendering of a bar graph illustrating a downward trend with blue bars decreasing in height and a red line graph charting the decline set against a dark backdrop signifying business loss economic downturn and financial risk. Decrease bar illustrations 3D Bar Chart Showing Downward Trend with Red Line Graph Illustrating Business Loss and Economic Decline on Dark Background. 3D rendering of a bar graph illustrating a downward trend with blue bars decreasing in height and a red line graph charting the decline set against a dark backdrop signifying business loss economic downturn and financial risk
Free with trial This vibrant image features a collection of colorful 3D bar graphs representing data trends, perfect for visualizing statistics in business presentations and analyses. Decrease bar illustrations Colorful Bar Graph with 3D Shapes Representing Data Trends and Visualizing Statistics in Business and Finance Environments. This vibrant image features a collection of colorful 3D bar graphs representing data trends, perfect for visualizing statistics in business presentations and analyses
Free with trial Businessman Hunting Piggy Bank Jumping Down on Falling Stack of Gold Coins Bar Graph with Red Arrow Spear Representing Savings Depletion Financial Loss and Economic Downturn. Decrease bar vectors Businessman Hunting Piggy Bank Jumping Down on Falling Stack of Gold Coins Bar Graph with Red Arrow Spear Representing Savings
Free with trial This image features an intricate bar graph displaying colorful statistical data trends, perfect for business reports and presentations. Analyze metrics effectively. Decrease bar illustrations Colorful Data Visualization with Bar Graphs and Trends Displaying Statistical Information on a White Background. This image features an intricate bar graph displaying colorful statistical data trends, perfect for business reports and presentations. Analyze metrics effectively
Free with trial Economic critical crisis concept. The bar garph with dropdown arrow on red table background. Recession financial, cryptocurrency, gold, and the stock market. Losing money and cash. Bearish. Decrease bar vectors Economic critical crisis concept. The bar garph with dropdown arrow on red table background. Recession financial, cryptocurrency
Free with trial A colorful bar chart overlays blueprint showcasing data visualization for business analysis colorful on top of blueprinted paper ,Generative ai. Decrease bar illustrations A vibrant and informative colorful bar chart displayed on top of detailed blueprinted paper for comprehensive data analysis. A colorful bar chart overlays blueprint showcasing data visualization for business analysis colorful on top of blueprinted paper ,Generative ai
Free with trial Businessman Hunting Piggy Bank Jumping Down on Falling Stack of Banknotes Bar Graph with Red Arrow Spear Representing Cash Flow Loss Economic Recession and Financial Crisis. Decrease bar vectors Businessman Hunting Piggy Bank Jumping Down on Falling Stack of Banknotes Bar Graph with Red Arrow Spear Representing Cash Flow
Free with trial Businessman riding piggy bank jumping down on falling money banknotes bar graph staircase escaping red arrow spear during stock market crash and financial investment loss. Decrease bar vectors Businessman riding piggy bank jumping down on falling money banknotes bar graph staircase escaping red arrow spear during stock
Free with trial Economic critical crisis concept. The bar graph with a down arrow on red world map background. Recession financial, cryptocurrency, gold, and the stock market. Losing money and cash. Bearish. Decrease bar vectors Economic critical crisis concept. The bar graph with a down arrow on red world map background. Recession financial, cryptocurrency
Free with trial Businessman riding piggy bank jumping down on falling gold bars bar graph staircase escaping red arrow spear during stock market crash and precious metal investment loss. Decrease bar vectors Businessman riding piggy bank jumping down on falling gold bars bar graph staircase escaping red arrow spear during stock market
Free with trial Businessman riding piggy bank jumping down on falling gold coins bar graph staircase escaping red arrow spear during stock market crash and gold price decline concept. Decrease bar vectors Businessman riding piggy bank jumping down on falling gold coins bar graph staircase escaping red arrow spear during stock market
Free with trial This illustration features two colorful bar graphs on a white background, showcasing data comparison with distinct color palettes for engaging visual analysis and presentations. Decrease bar illustrations Colorful Bar Graphs on White Background Representing Data Comparison and Growth with Different Color Schemes for Visual Analysis. This illustration features two colorful bar graphs on a white background, showcasing data comparison with distinct color palettes for engaging visual analysis and presentations
Free with trial This vibrant bar graph displays data trends through colorful segments, ideal for marketing and business presentations. Utilize this minimalistic design for impactful insights. Decrease bar illustrations Colorful Bar Graph Showing Data Trends with Various Heights and Colors in a Minimalistic Style for Business and Marketing. This vibrant bar graph displays data trends through colorful segments, ideal for marketing and business presentations. Utilize this minimalistic design for impactful insights
Free with trial The visual depicts a financial bar chart in a minimalist style, showcasing a decline with bars in gradient hues, creating a striking contrast against a dark background. Decrease bar illustrations A minimalist representation of a collapsing financial bar chart with vibrant colors. The visual depicts a financial bar chart in a minimalist style, showcasing a decline with bars in gradient hues, creating a striking contrast against a dark background.
Free with trial A modern data visualization featuring a line graph and bar chart, ideal for illustrating business trends and performance metrics in reports and presentations. Decrease bar illustrations Data visualization with a line graph and bar chart representing trends and comparisons in a clear and modern style for business. A modern data visualization featuring a line graph and bar chart, ideal for illustrating business trends and performance metrics in reports and presentations
Free with trial This vibrant image features a collection of colorful 3D bar graphs representing data trends, perfect for visualizing statistics in business presentations and analyses. Decrease bar illustrations Colorful Bar Graph with 3D Shapes Representing Data Trends and Visualizing Statistics in Business and Finance Environments. This vibrant image features a collection of colorful 3D bar graphs representing data trends, perfect for visualizing statistics in business presentations and analyses
Free with trial This monochromatic bar graph illustrates data trends over time, showcasing variations in performance and metrics, ideal for presentations and business reports. Decrease bar illustrations Black and White Bar Graph with Trend Line Showing Data Variations Over Time for Analysis and Reporting Purposes in Business. This monochromatic bar graph illustrates data trends over time, showcasing variations in performance and metrics, ideal for presentations and business reports
Free with trial A clean, minimalist bar chart displays a gradual decline in financial performance, with rising bars depicted in soft blue against a serene teal background. Decrease bar illustrations Minimalist financial bar chart illustrating gradual decline in economic performance. A clean, minimalist bar chart displays a gradual decline in financial performance, with rising bars depicted in soft blue against a serene teal background.
Free with trial This illustration features two colorful bar graphs on a white background, showcasing data comparison with distinct color palettes for engaging visual analysis and presentations. Decrease bar illustrations Colorful Bar Graphs on White Background Representing Data Comparison and Growth with Different Color Schemes for Visual Analysis. This illustration features two colorful bar graphs on a white background, showcasing data comparison with distinct color palettes for engaging visual analysis and presentations
Free with trial This image features a conceptual bar graph, illustrating contrasting trends of growth and decline in business performance, ideal for data analysis presentations. Decrease bar illustrations Growth and Decline: Conceptual Bar Graph Illustrating Positive and Negative Trends in Business Performance Data Visualization. This image features a conceptual bar graph, illustrating contrasting trends of growth and decline in business performance, ideal for data analysis presentations
Free with trial This image features colorful 3D bar graphs representing both growth and decline trends, ideal for business analytics and financial performance visualizations. Decrease bar illustrations Colorful 3D Bar Graphs Displaying Growth and Decline Trends in Business Analytics and Financial Performance on a Clean White. This image features colorful 3D bar graphs representing both growth and decline trends, ideal for business analytics and financial performance visualizations
Free with trial Statistic graph progress, financial profit growth, increase, and decrease line icons set. Infographic charts with arrows, circles, and bars thin black outline symbols vector illustration. Decrease bar vectors Statistic graph progress, financial profit growth, increase and decrease line icons set. Statistic graph progress, financial profit growth, increase, and decrease line icons set. Infographic charts with arrows, circles, and bars thin black outline symbols vector illustration.
Free with trial Red arrow going down stock icon on white background. Decrease, Bankruptcy, financial market crash icon for your web site design, logo, app, UI. graph chart downtrend symbol. chart going down sign. Decrease bar vectors Red arrow going down stock icon on white background. Decrease, Bankruptcy, financial market crash icon
Free with trial Man in blue shirt analyzing colorful bar chart, business performance review and data analysis,Generative AI. Decrease bar illustrations Man in blue shirt analyzing colorful bar chart, business performance review and data analysis
Free with trial Vibrant and colorful bar chart illustrating various data metrics, perfect for business or marketing use, highlighting trends and insights visually engaging for audiences. Decrease bar illustrations Colorful Bar Chart Showing Data Variations in a Bright and Engaging Style Suitable for Business Presentations or Marketing. Vibrant and colorful bar chart illustrating various data metrics, perfect for business or marketing use, highlighting trends and insights visually engaging for audiences
Free with trial This vibrant illustration features colorful bar graphs that visualize business growth and performance metrics, ideal for presentations, reports, and analysis. Decrease bar illustrations Colorful Bar Graphs Representing Business Growth and Performance Metrics in Vibrant Tones of Red, Orange, Yellow, White, and Green. This vibrant illustration features colorful bar graphs that visualize business growth and performance metrics, ideal for presentations, reports, and analysis
Free with trial Business and financial concept. Bar graph with upper and lower arrows to show low cost and high quality on black background. Decrease bar vectors Business and financial concept. Bar graph with upper and lower arrow to show low cost and high quality on black background
Free with trial This vibrant bar graph showcases varying heights for data visualization, perfect for representing trends in finance or business analysis against a clean white background. Decrease bar illustrations Colorful Bar Graph with Varying Heights Representing Data Trends and Insights in a Minimalist Art Style on White Background. This vibrant bar graph showcases varying heights for data visualization, perfect for representing trends in finance or business analysis against a clean white background
Free with trial A vibrant 3D bar graph illustration shows financial growth trends with colorful bars. Perfect for business presentations, analytics, and creative projects. Decrease bar illustrations Colorful 3D bar graph illustration depicting financial growth and performance trends with vibrant hues and clean modern design for. A vibrant 3D bar graph illustration shows financial growth trends with colorful bars. Perfect for business presentations, analytics, and creative projects
Free with trial Abstract 3D bar graph representation showcasing various data trends with vibrant colors and shadows. Ideal for presentations, reports, and analytics purposes. Decrease bar illustrations 3D Visualization of Colorful Bar Graph Illustrating Data Trends with Shadows and Depth in a Minimalistic Style for Data Analysis. Abstract 3D bar graph representation showcasing various data trends with vibrant colors and shadows. Ideal for presentations, reports, and analytics purposes
Free with trial Graph depicting 3D line and bar data visualization in red, white background, financial trends concept. Decrease bar illustrations Graph showing 3D line and bar data visualization in red, white background, financial trends concept
Free with trial Bright and colorful bar graph created with blocks illustrates data visualization in a contemporary business context. Ideal for finance and marketing materials. Decrease bar illustrations Colorful bar graph made of building blocks representing data visualization and analysis in modern business graphics on a clean. Bright and colorful bar graph created with blocks illustrates data visualization in a contemporary business context. Ideal for finance and marketing materials
Free with trial This vibrant 3D bar graph showcases data trends with a colorful aesthetic, perfect for presentations in business, finance, or technology sectors emphasizing analytics. Decrease bar illustrations Colorful Bar Graph Visualization of Data Trends in Modern Business Environment with 3D Perspective and Vibrant Gradient Colors. This vibrant 3D bar graph showcases data trends with a colorful aesthetic, perfect for presentations in business, finance, or technology sectors emphasizing analytics
Free with trial Productivity , diagram bar with gear icon symbol. Vector illustration. Decrease bar vectors Productivity , diagram bar with gear icon. Vector illustration
Free with trial The visualization displays a collapsing financial bar chart, illustrating a significant decrease in financial metrics with a clean, minimalist aesthetic. Decrease bar illustrations Visual representation of financial decline using a collapsing bar chart in a modern design. The visualization displays a collapsing financial bar chart, illustrating a significant decrease in financial metrics with a clean, minimalist aesthetic.
Free with trial 3d Up and Down sign with red arrows vector collection. Design vector illustration concept of sales bar chart symbol icon set with arrow moving down and sales bar chart with arrow moving up. Decrease bar vectors 3d Up and Down sign with red arrows vector collection. Design vector illustration concept of sales bar chart symbol icon set
Free with trial This sleek, minimalist linear bar graph is perfect for showcasing downward trends in your business data. Ideal for presentations, reports, and dashboards, this editable graphic allows you to easily customize stroke width and colors to match your brand. The clean design and simple layout make complex data easily digestible, highlighting key performance indicators and areas needing attention. Decrease bar illustrations Editable Linear Bar Graph Visualize Downward Trends for Powerful Business Analytics Reports and Presentations. This sleek, minimalist linear bar graph is perfect for showcasing downward trends in your business data. Ideal for presentations, reports, and dashboards, this editable graphic allows you to easily customize stroke width and colors to match your brand. The clean design and simple layout make complex data easily digestible, highlighting key performance indicators and areas needing attention.
Free with trial Stock market trading technical analysis bar chart fall banner. Business failure candlestick graph exchange down trend. Economic downturn and investment loss graph. Trader financial index crash. Eps. Decrease bar vectors Stock market trading technical analysis bar chart fall banner. Business failure candlestick graph exchange down trend