Free with trial The visual displays a clean and minimalist bar chart, illustrating a notable decrease in financial performance over a recent quarter, with a focus on dark blue tones to enhance impact. Decrease bar illustrations Minimalist financial bar chart showing significant decline in earnings over the past quarter. The visual displays a clean and minimalist bar chart, illustrating a notable decrease in financial performance over a recent quarter, with a focus on dark blue tones to enhance impact.
Free with trial A vibrant, 3D bar graph with colorful blocks rises against a white background. This modern infographic uses geometric shapes to represent data trends, making it a perfect visual for presentations, rep. Decrease bar illustrations Colorful Bar Graph. A vibrant, 3D bar graph with colorful blocks rises against a white background. This modern infographic uses geometric shapes to represent data trends, making it a perfect visual for presentations, rep
Free with trial Simple vector showing a decreasing bar graph with an earth icon, representing the concept of global recession. Decrease bar illustrations Global economy showing decreasing bar graph and earth icon. Simple vector showing a decreasing bar graph with an earth icon, representing the concept of global recession
Free with trial Colored outline declining coin bar chart with stack coin icon logo vector illustration design. Decrease bar vectors Colored outline declining coin bar chart with stack coin icon logo vector illustration design
Free with trial The decline in the bar graph is due to the stock market falling, economic crash, investing failure or mistake, price drop, recession, investment risk concept, stock price decline concept flat design. Decrease bar vectors The decline in the bar graph is due to the stock market falling, economic crash, investing failure or mistake, , price drop. The decline in the bar graph is due to the stock market falling, economic crash, investing failure or mistake, price drop, recession, investment risk concept, stock price decline concept flat design
Free with trial Flat Design Illustration of NPL Risk Analysis with Declining Bar Chart, Highlighting Financial Trends and Risks. Ideal. Decrease bar illustrations Flat Design Illustration of NPL Risk Analysis with Declining Bar Chart, Highlighting Financial Trends and Risks. Ideal
Free with trial Recession economic downturn falling graph coins declining bar chart arrow abstract geometric shapes modern finance banner Vector illustration. Decrease bar vectors Recession economic downturn falling graph coins declining bar chart arrow abstract geometric shapes modern finance banner
Free with trial Financial crisis recession falling graph chart warning declining bar and line graph red exclamation coins documents cityscape abstract background Vector illustration. Decrease bar illustrations Financial crisis recession falling graph chart warning declining bar and line graph red exclamation coins documents
Free with trial 3D rendering of a declining bar chart in red with a downward arrow and floating coins, on a red grid background, symbolizing financial loss. Decrease bar illustrations Declining Bar Chart on Red Background. 3D Rendering. 3D rendering of a declining bar chart in red with a downward arrow and floating coins, on a red grid background, symbolizing financial loss
Free with trial Open laptop displaying colorful bar graphs and data analysis on screen, representing growth and business analytics ,Generative AI. Decrease bar illustrations Open laptop displaying colorful bar graphs and data analysis on screen, representing growth and business analytics
Free with trial Gold bars on graph and arrow down, fall, chart gold with increase and decrease, gold profit and loss concept. Decrease bar vectors Gold bars on graph and arrow down, fall, chart gold with increase and decrease, gold profit and loss concept
Free with trial This image shows a 3D bar graph, generated by AI, depicting a rise and subsequent fall in values. The red bars illustrate a peak, followed by a sharp decline, possibly representing a trend in data or market fluctuations. The visual is clean and easy to understand, highlighting the dramatic change i. Decrease bar illustrations Red 3D Bar Graph. This image shows a 3D bar graph, generated by AI, depicting a rise and subsequent fall in values. The red bars illustrate a peak, followed by a sharp decline, possibly representing a trend in data or market fluctuations. The visual is clean and easy to understand, highlighting the dramatic change i
Free with trial A vibrant 3D bar chart icon isolated on a clean white background. This minimalist data visualization features five colorful bars in a soft, pastel palette of yellow, pink, and purple, arranged in descending order. The clean, modern render is perfect for illustrating concepts like business statistics, financial reports, market analysis, and performance metrics. An ideal graphic element for presentations, infographics, websites, and educational materials, symbolizing data, comparison, and analytics in a visually appealing way. 3D illustration. Decrease bar illustrations 3D Colorful Bar Chart for Business and Data Analysis. A vibrant 3D bar chart icon isolated on a clean white background. This minimalist data visualization. A vibrant 3D bar chart icon isolated on a clean white background. This minimalist data visualization features five colorful bars in a soft, pastel palette of yellow, pink, and purple, arranged in descending order. The clean, modern render is perfect for illustrating concepts like business statistics, financial reports, market analysis, and performance metrics. An ideal graphic element for presentations, infographics, websites, and educational materials, symbolizing data, comparison, and analytics in a visually appealing way. 3D illustration.
Free with trial A black and white line illustration features a speech bubble with a downward arrow and a dollar sign, indicating a decrease in value. Below, a stylized gold bar is depicted, flanked by two sparkles. The minimalistic design suggests an economic theme, likely related to changes in gold prices. Decrease bar vectors Gold Price Down. A black and white line illustration features a speech bubble with a downward arrow and a dollar sign, indicating a decrease in value. Below, a stylized gold bar is depicted, flanked by two sparkles. The minimalistic design suggests an economic theme, likely related to changes in gold prices.
Free with trial A graphic icon shows a stylized gold bar with two sparkle symbols on either side, suggesting value or shine. Above, a speech bubble contains a downward-facing arrow and a dollar sign, indicating a decrease or decline in value or price. The design uses a simple black and white color scheme, conveying information clearly and directly. Decrease bar vectors Gold Price Down. A graphic icon shows a stylized gold bar with two sparkle symbols on either side, suggesting value or shine. Above, a speech bubble contains a downward-facing arrow and a dollar sign, indicating a decrease or decline in value or price. The design uses a simple black and white color scheme, conveying information clearly and directly.
Free with trial This colorful bar graph, generated by AI, depicts a downward trend using vibrant red, green, and yellow paint. The melting paint adds a dynamic, visually engaging element to the standard bar chart format, showcasing data decline creatively. Decrease bar illustrations Melting Bar Graph. This colorful bar graph, generated by AI, depicts a downward trend using vibrant red, green, and yellow paint. The melting paint adds a dynamic, visually engaging element to the standard bar chart format, showcasing data decline creatively.
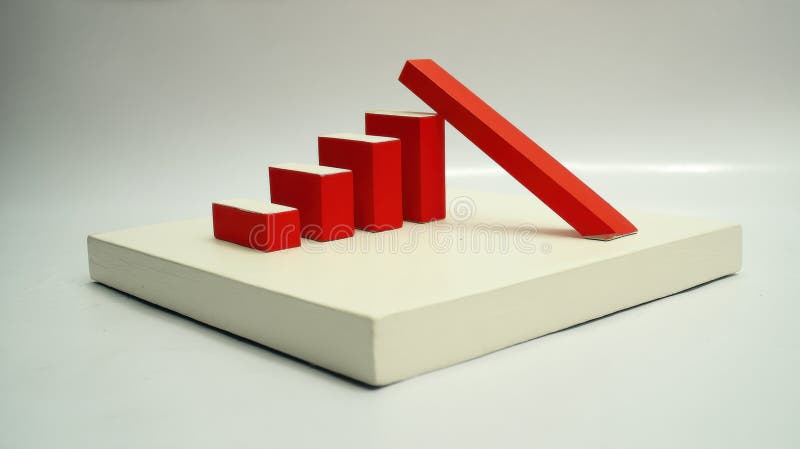
Free with trial This image shows a 3D model of a bar graph, where one bar is falling, symbolizing decline or failure. This striking visual representation was generated by AI, offering a unique perspective on downward trends and economic instability. The clean design makes it ideal for illustrating various concepts. Decrease bar illustrations Falling Bar Graph. This image shows a 3D model of a bar graph, where one bar is falling, symbolizing decline or failure. This striking visual representation was generated by AI, offering a unique perspective on downward trends and economic instability. The clean design makes it ideal for illustrating various concepts
Free with trial Illustration of a descending bar chart icon consisting of three bars of different heights, showing a gradual decrease in data from left to right. Decrease bar illustrations Bar Chart free icon. Illustration of a descending bar chart icon consisting of three bars of different heights, showing a gradual decrease in data from left to right
Free with trial Set Browser with shield, Financial growth decrease, window and Secure your site HTTPS, SSL icon. Vector. Decrease bar vectors Set Browser with shield, Financial growth decrease, window and Secure your site HTTPS, SSL icon. Vector
Free with trial A person is analyzing a bar graph with a downward trend line, indicating a decrease in stock value. Vector art design using ai tool. Decrease bar vectors Sell Stock Graph Illustration. A person is analyzing a bar graph with a downward trend line, indicating a decrease in stock value. Vector art design using ai tool.
Free with trial Candlestick chart showing a series of red and green bars representing price fluctuations over time. Each rectangular bar displays financial data, with green indicating an increase and red indicating a decrease. Thin vertical lines extend above and below the bars, illustrating price range. Numerical values such as 20. 800 and 213. 500 label specific points on the chart, judging stock or currency performance. Horizontal lines suggest moving averages, highlighting trends in the data. Decrease bar illustrations Candlestick chart showing a series of red and green bars representing price
Free with trial A minimalist bar chart with a descending line graph overlay, symbolizing financial loss, performance decline, or negative data trends. Ideal for presentations, dashboards, economic reports, and warning visuals. Decrease bar vectors Downward Trend Bar Chart Icon. A minimalist bar chart with a descending line graph overlay, symbolizing financial loss, performance decline, or negative data trends. Ideal for presentations, dashboards, economic reports, and warning visuals
Free with trial This image features two variations of a decreasing graph icon. One is an outline version, and the other is a solid black version. Both show a bar graph with descending bars and a curved arrow pointing downwards, symbolizing a decline or decrease. These icons are suitable for illustrating concepts like loss, recession, negative trends, or falling statistics in various contexts. Decrease bar illustrations Decreasing Graph Icon Set. This image features two variations of a decreasing graph icon. One is an outline version, and the other is a solid black version. Both show a bar graph with descending bars and a curved arrow pointing downwards, symbolizing a decline or decrease. These icons are suitable for illustrating concepts like loss, recession, negative trends, or falling statistics in various contexts.
Free with trial Descending bar chart or graph on white background. Economic crisis, declining profit, recession and bankruptcy. 3d render. Decrease bar illustrations Descending bar chart or graph on white background
Free with trial Decreasing bar graph in ice cube. 3d illustration. Decrease bar illustrations Decreasing bar graph in ice cube
Free with trial Oil gas refinery or petrochemical plant. Include arrow, graph or bar chart. Decrease trend or low of production, market price, demand, supply. Concept of business, industry, fuel, power energy. Decrease bar illustrations Oil gas refinery or petrochemical plant with concept of business. Oil gas refinery or petrochemical plant. Include arrow, graph or bar chart. Decrease trend or low of production, market price, demand, supply. Concept of business, industry, fuel, power energy
Free with trial A simple graphic illustration of a bar chart. The chart features four bars of varying heights, indicating growth or progress. The design is clean and minimalist, making it suitable for a wide range of applications such as presentations, reports, and infographics. The black bars stand out against the white background, providing a clear visual representation of data. Decrease bar illustrations Bar Chart Icon. A simple graphic illustration of a bar chart. The chart features four bars of varying heights, indicating growth or progress. The design is clean and minimalist, making it suitable for a wide range of applications such as presentations, reports, and infographics. The black bars stand out against the white background, providing a clear visual representation of data.
Free with trial A visual representation of data, showcasing trends and comparisons through a green bar chart. This graphic illustrates statistical information and growth patterns effectively. Decrease bar illustrations Bar chart data analysis on. A visual representation of data, showcasing trends and comparisons through a green bar chart. This graphic illustrates statistical information and growth patterns effectively
Free with trial Three orange bar graphs illustrating different data patterns increasing, decreasing, and varied. Ideal for presentations or data visualization. Simple and visually appealing design. Decrease bar illustrations Orange Bar Graph Variations. Three orange bar graphs illustrating different data patterns increasing, decreasing, and varied. Ideal for presentations or data visualization. Simple and visually appealing design.
Free with trial Bar graphs data illustration company year, color performance, categories trend bar graphs data. Decrease bar illustrations Bar graphs data
Free with trial Red bar graph on a dark background depicts a downward trend, highlighted by a descending arrow. Accompanied by bold text reading "ECONOMIC CRISIS" at the bottom. The bars decrease in height from left to right, illustrating a decline, with strong visual emphasis through the use of a vibrant red against a muted backdrop. The style is straightforward and impactful, conveying a sense of financial downturn or economic challenges. Decrease bar illustrations Economic Crisis Chart with Declining Bar Graph and Arrow. Red bar graph on a dark background depicts a downward trend, highlighted by a descending arrow. Accompanied by bold text reading "ECONOMIC CRISIS" at the bottom. The bars decrease in height from left to right, illustrating a decline, with strong visual emphasis through the use of a vibrant red against a muted backdrop. The style is straightforward and impactful, conveying a sense of financial downturn or economic challenges.
Free with trial Loss money arrow bar graph icon on white background depicting financial decline. Decrease bar illustrations Loss money arrow bar graph icon
Free with trial A 3D bar chart illustrating financial data with green bars indicating growth and red bars indicating decline, presented in a clean visual format for analysis. Decrease bar illustrations Bar chart growth and decline on. A 3D bar chart illustrating financial data with green bars indicating growth and red bars indicating decline, presented in a clean visual format for analysis
Free with trial This image shows a simple isometric bar graph, generated by AI. It features four black bars of varying heights against a white background, suitable for use as a minimalist graphic or logo. The clean design allows for versatile application in various contexts. Decrease bar illustrations AI-Generated Isometric Bar Graph. This image shows a simple isometric bar graph, generated by AI. It features four black bars of varying heights against a white background, suitable for use as a minimalist graphic or logo. The clean design allows for versatile application in various contexts.
Free with trial A minimalist, flat design illustration of a bar chart featuring three vertical bars of varying heights. The bars are colored in orange, teal, and a lighter orange, set against a clean white background. This graphic represents data visualization, trends, and comparisons, suitable for business reports, educational materials, or web design elements. Decrease bar illustrations Simple Bar Chart with Three Bars. A minimalist, flat design illustration of a bar chart featuring three vertical bars of varying heights. The bars are colored in orange, teal, and a lighter orange, set against a clean white background. This graphic represents data visualization, trends, and comparisons, suitable for business reports, educational materials, or web design elements.
Free with trial Downward arrow on blue bar chart. Decrease bar illustrations Downward arrow on blue bar chart
Free with trial A conceptual illustration showing a financial bar chart in a steep decline. Decrease bar vectors Declining Green Growth Bar Chart. A conceptual illustration showing a financial bar chart in a steep decline
Free with trial USD dollar value decline and devaluation. Bar graph made of holes in yellow paper is revealing us dollar banknotes of decreasing values. 3d render. Decrease bar illustrations Us dollar decreasing value concept with bar graph on yellow background. USD dollar value decline and devaluation. Bar graph made of holes in yellow paper is revealing us dollar banknotes of decreasing values. 3d render
Free with trial A clean, minimalist 3D render of a blue bar chart with a blue trend line connecting circular data points. The bars vary in height, illustrating growth and fluctuations. The background is a bright, clean white, emphasizing the chart's elements. This graphic is ideal for representing financial data, business growth, market trends, statistics, and performance analysis in a modern and professional style. Decrease bar illustrations 3D Blue Bar Chart with Trend Line. A clean, minimalist 3D render of a blue bar chart with a blue trend line connecting circular data points. The bars vary in height, illustrating growth and fluctuations. The background is a bright, clean white, emphasizing the chart's elements. This graphic is ideal for representing financial data, business growth, market trends, statistics, and performance analysis in a modern and professional style.
Free with trial Businessman Analyzing Declining Red Bar Chart. High quality illustration. Decrease bar illustrations Businessman Analyzing Declining Red Bar Chart
Free with trial A stylized illustration depicts a bar chart with blue bars of varying heights against a dark blue grid background. A prominent red and yellow arrow, symbolizing a downward trend, dramatically descends across the chart. This graphic represents financial decline, market crash, economic recession, or negative growth. Its clean, vector-style design makes it suitable for presentations, reports, and articles on business, finance, and economics. Decrease bar illustrations Declining Bar Chart with Red Arrow. A stylized illustration depicts a bar chart with blue bars of varying heights against a dark blue grid background. A prominent red and yellow arrow, symbolizing a downward trend, dramatically descends across the chart. This graphic represents financial decline, market crash, economic recession, or negative growth. Its clean, vector-style design makes it suitable for presentations, reports, and articles on business, finance, and economics.
Free with trial A simple and modern black silhouette icon of a business graph, isolated on a white background. This flat vector illustration combines a bar chart with an overlaid line graph, showing a fluctuating trend with a general decline. The graphic symbolizes concepts such as data analysis, financial reporting, market statistics, economic downturn, and business performance metrics. It's an ideal visual element for presentations, infographics, websites, and applications related to finance, economics, and analytics, representing concepts of decrease, loss, or market volatility. Decrease bar vectors Business Data Analytics Chart Icon. A simple and modern black silhouette icon of a business graph, isolated on a white background. This flat vector illustration combines a bar chart with an overlaid line graph, showing a fluctuating trend with a general decline. The graphic symbolizes concepts such as data analysis, financial reporting, market statistics, economic downturn, and business performance metrics. It's an ideal visual element for presentations, infographics, websites, and applications related to finance, economics, and analytics, representing concepts of decrease, loss, or market volatility.
Free with trial Decreasing bar graph behind magnifying glass. 3d render. Decrease bar illustrations Decreasing bar graph behind magnifying glass
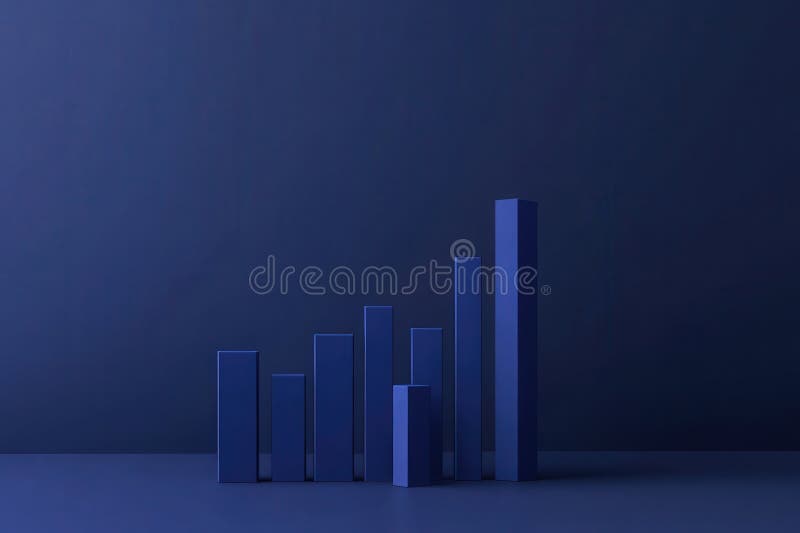
Free with trial Abstract 3D rendering of a blue bar chart receding into the distance. The bars are arranged in descending order, suggesting a decline or downward trend. The reflective surface adds depth and visual interest, creating a clean and modern aesthetic. This image can be used to illustrate concepts such as financial downturn, market analysis, or statistical data representation. Decrease bar illustrations Abstract Blue Bar Chart. Abstract 3D rendering of a blue bar chart receding into the distance. The bars are arranged in descending order, suggesting a decline or downward trend. The reflective surface adds depth and visual interest, creating a clean and modern aesthetic. This image can be used to illustrate concepts such as financial downturn, market analysis, or statistical data representation.
Free with trial Graphic illustration of a downward trending red arrow over blue and red vertical bar graph on a light grey background. Image. Decrease bar illustrations Bar Graph with Decreasing Trend Line. Graphic illustration of a downward trending red arrow over blue and red vertical bar graph on a light grey background. Image
Free with trial This image shows a whiteboard displaying a bar graph with a downward trend, generated by AI. The graph illustrates a clear decline in performance over time, potentially indicating financial losses or market setbacks. The simple, clean presentation highlights the severity of the decrease. Decrease bar illustrations Declining Business Graph. This image shows a whiteboard displaying a bar graph with a downward trend, generated by AI. The graph illustrates a clear decline in performance over time, potentially indicating financial losses or market setbacks. The simple, clean presentation highlights the severity of the decrease.
Free with trial A minimalist 3D rendering showcases a bar chart with an upward arrow and a diverging arrow on a round platform, symbolizing business growth and decline and is suitable for presentations or website graphics. Decrease bar illustrations 3d Bar Chart with Arrow, Growth Concept. A minimalist 3D rendering showcases a bar chart with an upward arrow and a diverging arrow on a round platform, symbolizing business growth and decline and is suitable for presentations or website graphics
Free with trial Arrows going Up and Down, green and red arrows. Concept of sales bar chart symbol icon with arrow moving down and sales. Decrease bar illustrations Arrows going Up and Down, green and red arrows. Concept of sales bar chart symbol icon with arrow moving down and sales
Free with trial Decreasing bar graph isolated on white background. Investment statistics. Economic data. Financial report. Interest rate. Business concept. Top view. 3d render. Decrease bar illustrations Decreasing bar graph isolated on white background
Free with trial A vibrant 3D bar chart featuring multiple colorful columns, including red, blue, green, yellow, and purple, set against a clean white background. The bars vary in height, representing different data points or categories, and are displayed on a reflective surface, adding depth to the visualization. Grid lines provide a clear scale for interpretation. This modern graphic is ideal for illustrating statistics, business growth, financial performance, market analysis, and educational concepts in presentations, reports, and digital media. Decrease bar illustrations Colorful 3D Bar Chart on White Background. A vibrant 3D bar chart featuring multiple colorful columns, including red, blue, green, yellow, and purple, set against a clean white background. The bars vary in height, representing different data points or categories, and are displayed on a reflective surface, adding depth to the visualization. Grid lines provide a clear scale for interpretation. This modern graphic is ideal for illustrating statistics, business growth, financial performance, market analysis, and educational concepts in presentations, reports, and digital media.
Free with trial Colourful decrease arrow chart icon template. Business icon. Decrease bar vectors Colourful decrease arrow chart icon template
Free with trial Simple vector icon representing a bar graph with a big arrow pointing down. Decrease bar illustrations Big arrow pointing down on a decreasing bar graph icon. Simple vector icon representing a bar graph with a big arrow pointing down
Free with trial Red decreasing bar graph on light gray background. Investment statistics. Economic data. Financial report. Interest rate. Business concept. Top view. 3d render. Decrease bar illustrations Red decreasing bar graph on light gray background
Free with trial A simple black and white graphic depicts a bar chart with decreasing bars and a downward trending arrow, indicating a decline. Decrease bar illustrations Bar chart showing downward trend and arrow. A simple black and white graphic depicts a bar chart with decreasing bars and a downward trending arrow, indicating a decline
Free with trial Decrease graph icon in generic style. Statistic illustration concept. Decrease bar vectors Decrease graph icon in generic style. Statistic concept. Decrease graph icon in generic style. Statistic illustration concept
Free with trial Statistics icon set, bar diagram illustration, business graph logo icon vector. Decrease bar vectors Statistics icon set, bar diagram illustration, business graph logo icon vector
Free with trial A clean, minimalist bar chart illustration set against a solid green background. The chart features three white vertical bars of different heights, representing data points or progress over time. A simple white grid and axes are visible, indicating a clear visual representation of statistics. This versatile graphic is ideal for conveying concepts of business growth, financial analysis, market trends, statistical reporting, or educational content in a modern, easy-to-understand format. Perfect for presentations, infographics, websites, and applications. Decrease bar vectors Minimalist Bar Chart Icon on Green Background. A clean, minimalist bar chart illustration set against a solid green background. The chart features three white vertical bars of different heights, representing data points or progress over time. A simple white grid and axes are visible, indicating a clear visual representation of statistics. This versatile graphic is ideal for conveying concepts of business growth, financial analysis, market trends, statistical reporting, or educational content in a modern, easy-to-understand format. Perfect for presentations, infographics, websites, and applications.
Free with trial A minimalist line drawing of a bar chart, representing data, statistics and growth. Simple, bold and clean graphic icon. Decrease bar vectors Simple Line Chart Bar Statistic Graphic Icon. A minimalist line drawing of a bar chart, representing data, statistics and growth. Simple, bold and clean graphic icon.
Free with trial White Bar Chart Decreasing on Blue Background. Decrease bar illustrations White Bar Chart Decreasing on Blue Background
Free with trial Green marble bar graph showing a downward trend. Created with the help of Generative AI tools. Decrease bar illustrations Green marble bar graph showing a downward trend.
Free with trial 3D colorful pie chart and bar graph on a stack of documents illustrating business data and financial analysis. Perfect for presentations or reports. Decrease bar illustrations Colorful 3D Pie Chart and Bar Graph on Documents. 3D colorful pie chart and bar graph on a stack of documents illustrating business data and financial analysis. Perfect for presentations or reports.
Free with trial Financial icon depicting money loss with a downward arrow and bar graph isolated on a white background. Decrease bar illustrations Loss money arrow bar graph icon isolated on white. Financial icon depicting money loss with a downward arrow and bar graph isolated on a white background
Free with trial Diagram icons set in outline stroke design for web. Pack line pictograms with growth bar chart, pie data, datum, marketing, analyzing finance, flow, infographic, statistic, other. Vector illustration. Decrease bar vectors Diagram icons set in outline stroke design for web. Pack line pictograms with growth bar chart, pie data, datum
Free with trial Purple gradient bar graph is showing a negative trend with a downward arrow. Decrease bar vectors Purple gradient bar graph showing negative trend with downward arrow
Free with trial Red bar graph with decreasing values. Generative AI. Decrease bar illustrations Red bar graph with decreasing values
Free with trial A group of the red bar and the line graph shows feelings that fall down, lower, losing, downward, and bear stock market. Background for the economy and data analysis. Decrease bar vectors Red Bar Chart and Graph downtrend abstract background. A group of the red bar and the line graph shows feelings that fall down, lower, losing, downward, and bear stock market. Background for the economy and data analysis
Free with trial Bar chart in blue circle alongside minimal cloud shapes and dark horizontal lines. Ideal for analytics, data trends, business insight, environment, forecast, comparison, technology, simple flat. Decrease bar illustrations Minimalist Data Visualization with Bar Chart and Cloudy Sky Elements. Bar chart in blue circle alongside minimal cloud shapes and dark horizontal lines. Ideal for analytics, data trends, business insight, environment, forecast, comparison, technology, simple flat
Free with trial Colorful bar and pie charts illustrate data analysis white background. Decrease bar illustrations Colorful bar and pie charts illustrate data analysis
Free with trial A clean and simple vector illustration of a bar chart isolated on a white background. This minimalist graphic features three vertical bars in varying shades of blue, representing data, statistics, or progress. Ideal for business reports, financial presentations, infographics, websites, and educational materials. The flat design symbolizes concepts like growth, analysis, market research, and performance comparison, offering a modern and clear way to visualize information. Ample copy space is available. Decrease bar illustrations Simple Blue Bar Chart Vector Icon for Business Data. A clean and simple vector illustration of a bar chart isolated on a white background. This minimalist graphic features three vertical bars in varying shades of blue, representing data, statistics, or progress. Ideal for business reports, financial presentations, infographics, websites, and educational materials. The flat design symbolizes concepts like growth, analysis, market research, and performance comparison, offering a modern and clear way to visualize information. Ample copy space is available.
Free with trial This simple vector icon shows a round chart with a bar graph that is decreasing. Decrease bar illustrations Round chart icon showing decreasing bar graph for data analysis. This simple vector icon shows a round chart with a bar graph that is decreasing
Free with trial Four cylindrical bar charts are displayed against a light gray background. The charts represent four items labeled ITEM 11, ITEM 12, ITEM 13, and ITEM 14. Each chart displays data series with circular markers and labels. The data series are colored in shades of teal, blue, and dark blue. The charts have a 3D cylindrical appearance with a slight gradient. Horizontal grid lines with numerical labels. Decrease bar illustrations Four cylindrical bar charts with blue and teal data. Four cylindrical bar charts are displayed against a light gray background. The charts represent four items labeled ITEM 11, ITEM 12, ITEM 13, and ITEM 14. Each chart displays data series with circular markers and labels. The data series are colored in shades of teal, blue, and dark blue. The charts have a 3D cylindrical appearance with a slight gradient. Horizontal grid lines with numerical labels
Free with trial Up and down curved arrow chart icon. Business trend bar symbol illustration. Decrease bar vectors Up and down curved arrow chart icon. Business trend bar symbol
Free with trial Down Trend Line Outline Arrow Pointing Downward Decrease Profits Sales Market Business Finance Black White Icon Sign Symbol Vector Illustration Artwork. Decrease bar vectors Down Trend Line Outline Arrow Pointing Downward Decrease Profits Sales Market Business Finance Black White Icon
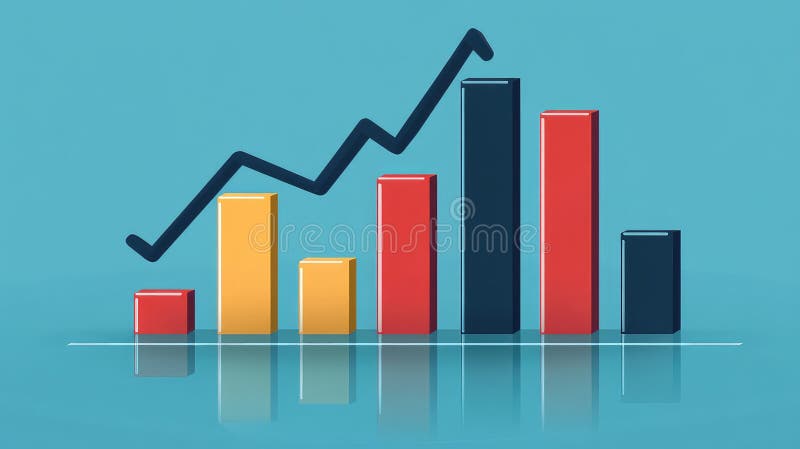
Free with trial Vibrant bar graph illustrates business growth and decline with upward and downward trending lines. Perfect for presentations or reports. Decrease bar illustrations Colorful Bar Graph Chart Showing Growth and Decline. Vibrant bar graph illustrates business growth and decline with upward and downward trending lines. Perfect for presentations or reports
Free with trial Flat declining coin bar chart with stack coin icon logo vector illustration design, for business and finance symbol. Decrease bar illustrations Flat declining coin bar chart with stack coin icon logo vector illustration design
Free with trial Decreasing bar chart icon on black circle. Market crash illustration concept. Decrease bar vectors Decreasing bar chart icon on black circle. Market crash concept. Decreasing bar chart icon on black circle. Market crash illustration concept
Free with trial This simple bar graph is depicting market analysis with colorful bars. Decrease bar vectors Colorful bar graph showing market growth and success. This simple bar graph is depicting market analysis with colorful bars
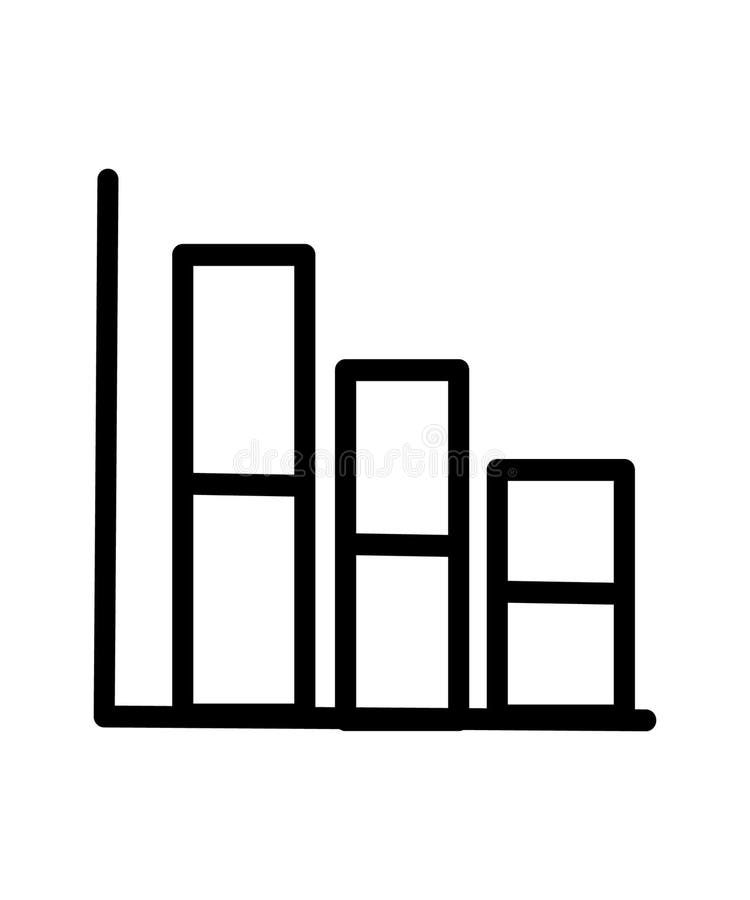
Free with trial A black and white icon depicting a bar chart with bars decreasing in height, indicating a significant downward trend. Decrease bar illustrations Bar chart showing a sharp decline with downward arrow. A black and white icon depicting a bar chart with bars decreasing in height, indicating a significant downward trend
Free with trial Dollar coin beside a bar graph showing downward trend under a cloud. Ideal for finance, economy, investment, loss, analytics, business performance, global market. Simple flat metaphor. Decrease bar vectors Dollar Coin and Declining Bar Graph Representing Financial Loss Concept. Dollar coin beside a bar graph showing downward trend under a cloud. Ideal for finance, economy, investment, loss, analytics, business performance, global market. Simple flat metaphor
Free with trial Falling red bar graph shows decreasing interest rates with a red arrow pointing down, accompanied by a clipboard with an interest report, set against a light background, useful for financial and economic themes. Decrease bar illustrations Declining Red Bar Graph with Red Arrow and Interest Report. Falling red bar graph shows decreasing interest rates with a red arrow pointing down, accompanied by a clipboard with an interest report, set against a light background, useful for financial and economic themes