Free with trial Simple line art illustration of a bar graph with a downward trend, symbolizing negative growth. Decrease bar illustrations Declining bar graph showing negative trend with arrow pointing down. Simple line art illustration of a bar graph with a downward trend, symbolizing negative growth
Free with trial Up and down graph icon vector in circular line. Outline bar chart with uptrend and downtrend arrow symbol. Decrease bar vectors Up and down graph icon in circular line. Outline bar chart with uptrend and downtrend arrow symbol
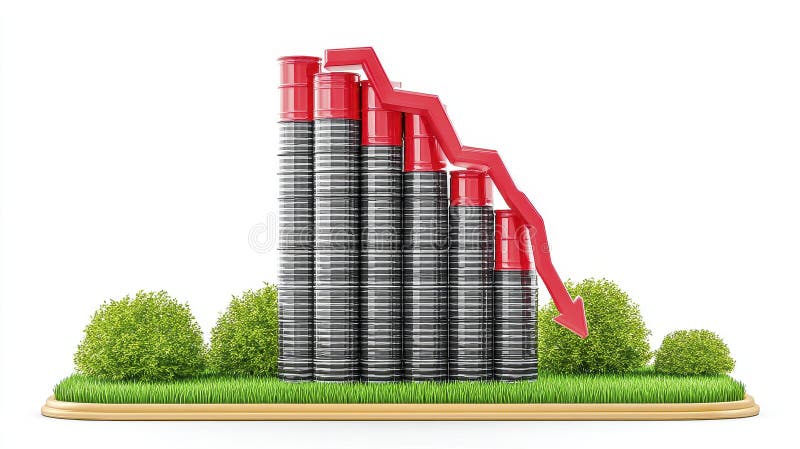
Free with trial 3D rendering of a bar graph showing a decline in production, represented by black and red cylinders on a grassy surface. The downward trend is emphasized by a red arrow AI generative. Decrease bar illustrations Declining Production 3D Render of Bar Graph Showing a Downward Trend. 3D rendering of a bar graph showing a decline in production, represented by black and red cylinders on a grassy surface. The downward trend is emphasized by a red arrow AI generative
Free with trial A 3D rendered bar chart composed of four colored blocks of varying heights. The blocks are blue, yellow, red, and white, arranged from shortest to tallest from left to right. The chart is presented on a clean white background, with subtle shadows beneath the blocks. Decrease bar illustrations Colorful 3D Bar Chart with Varying Heights on a White Background graph statistics. A 3D rendered bar chart composed of four colored blocks of varying heights. A 3D rendered bar chart composed of four colored blocks of varying heights. The blocks are blue, yellow, red, and white, arranged from shortest to tallest from left to right. The chart is presented on a clean white background, with subtle shadows beneath the blocks
Free with trial Declining economy concept with bar chart, arrows, dollar sign on flatlay background,. Decrease bar illustrations Declining economy concept with bar chart, arrows, dollar sign on flatlay background
Free with trial Decrease graph icon on black square. Statistic illustration concept. Decrease bar vectors Decrease graph icon on black square. Statistic concept. Decrease graph icon on black square. Statistic illustration concept
Free with trial Male avatar in a circle next to a declining bar chart. Ideal for progress, profile data, analytics, user stats, report analysis, business performance, visualization. Simple flat metaphor. Decrease bar illustrations Profile Avatar with Bar Chart Representing Performance and Analytics Data. Male avatar in a circle next to a declining bar chart. Ideal for progress, profile data, analytics, user stats, report analysis, business performance, visualization. Simple flat metaphor
Free with trial 3D bar chart with red arrows pointing upwards, reflecting off a shiny, blue surface. The clean, minimalist design symbolizes financial growth, business success, and positive market trends. Ideal for use in presentations, financial reports, and marketing materials related to investment, stock market, and economic progress. Decrease bar illustrations Financial Growth 3D Bar Chart with Red Arrows. 3D bar chart with red arrows pointing upwards, reflecting off a shiny, blue surface. The clean, minimalist design symbolizes financial growth, business success, and positive market trends. Ideal for use in presentations, financial reports, and marketing materials related to investment, stock market, and economic progress
Free with trial 3D bar chart with red arrows pointing upwards, reflecting off a shiny, blue surface. The clean, minimalist design symbolizes financial growth, business success, and positive market trends. Ideal for use in presentations, financial reports, and marketing materials related to investment, stock market, and economic progress. Decrease bar illustrations Financial Growth 3D Bar Chart with Red Arrows. 3D bar chart with red arrows pointing upwards, reflecting off a shiny, blue surface. The clean, minimalist design symbolizes financial growth, business success, and positive market trends. Ideal for use in presentations, financial reports, and marketing materials related to investment, stock market, and economic progress
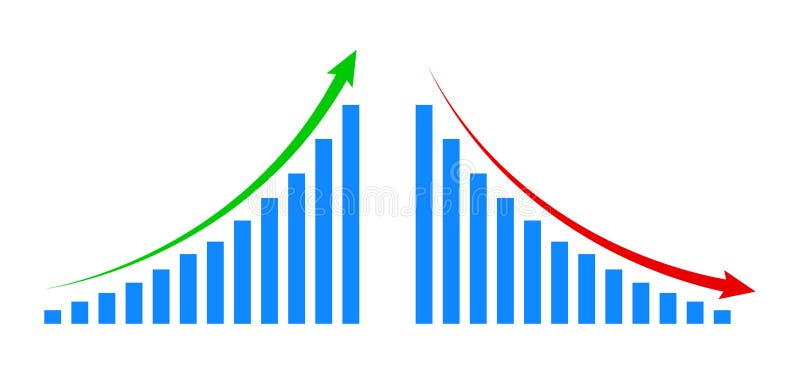
Free with trial Two bar charts are displayed side by side. One shows a clear upward trend with a green arrow, while the other shows a downward trend with a red arrow. Decrease bar illustrations Bar charts showing contrasting upward and downward trends. Two bar charts are displayed side by side. One shows a clear upward trend with a green arrow, while the other shows a downward trend with a red arrow
Free with trial Three isometric 3D bar chart columns with a gradient color fill on a light background. Decrease bar illustrations Three Isometric 3D Bar Chart Columns with Gradient Colors. Three isometric 3D bar chart columns with a gradient color fill on a light background
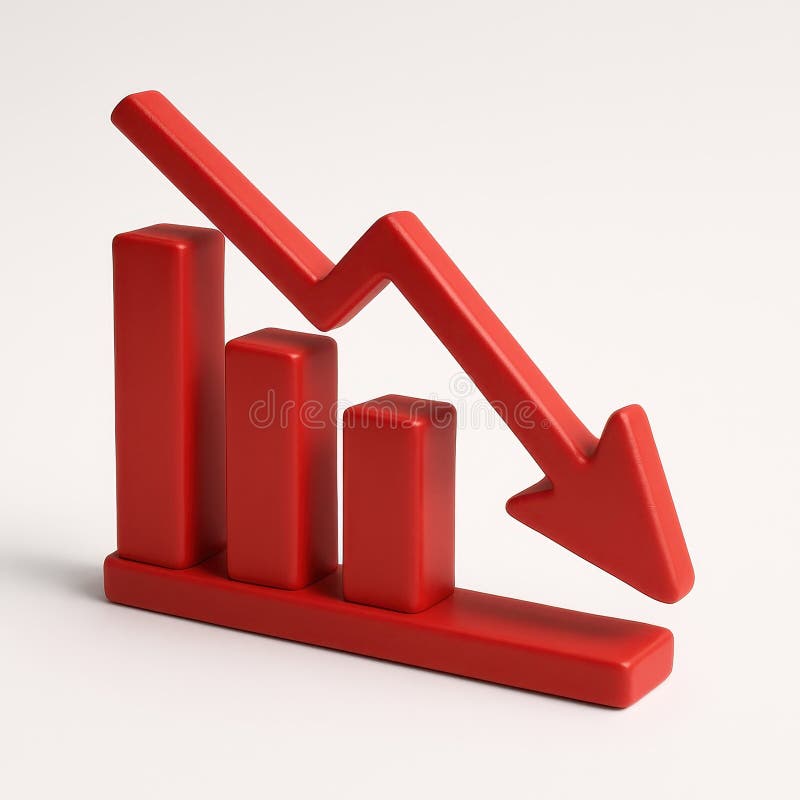
Free with trial This 3D rendering shows a bar graph with a sharp downward trend, symbolized by a large red arrow. The graph visually represents a significant decline or decrease in a particular metric. The dark red bars and bright red arrow create a strong visual impact. Decrease bar illustrations Declining Bar Graph. This 3D rendering shows a bar graph with a sharp downward trend, symbolized by a large red arrow. The graph visually represents a significant decline or decrease in a particular metric. The dark red bars and bright red arrow create a strong visual impact.
Free with trial A simple graphic showing various data representation methods including bar, line, and pie charts in a monochrome style. Decrease bar vectors Black and White Data Visualization Charts Bar Graph, Line Graph, and Pie Charts. A simple graphic showing various data representation methods including bar, line, and pie charts in a monochrome style
Free with trial Snowflake connected to decreasing bar chart indicating winter themes, seasonal decline, or data trends. Ideal for weather, climate change, business analytics, forecasting, cold storage, performance. Decrease bar illustrations Snowflake and Bar Chart Representing Seasonal Trends and Data Analysis Concepts. Snowflake connected to decreasing bar chart indicating winter themes, seasonal decline, or data trends. Ideal for weather, climate change, business analytics, forecasting, cold storage, performance
Free with trial Decreasing bar chart icon in generic design. Market crash sign symbol illustration. Decrease bar vectors Decreasing bar chart icon in generic design. Market crash sign symbol
Free with trial A minimal, simple line style illustration of a decreasing bar chart with an arrow pointing downwards, indicating a decline or loss. Perfect for business, finance, and economic themes. Decrease bar vectors Simple Line Style Decreasing Bar Chart with Arrow Sign Icon. A minimal, simple line style illustration of a decreasing bar chart with an arrow pointing downwards, indicating a decline or loss. Perfect for business, finance, and economic themes.
Free with trial A vibrant red 3D bar chart on a white background shows a steady, dramatic decline, symbolizing financial loss, recession, or negative business results. Decrease bar illustrations Stark Red 3D Bar Graph Descending Sharply, Isolated on White. A vibrant red 3D bar chart on a white background shows a steady, dramatic decline, symbolizing financial loss, recession, or negative business results.
Free with trial Two bar charts, one green showing growth and one red showing decline, with trend lines and arrows. Decrease bar illustrations Bar charts showing upward and downward trends. Two bar charts, one green showing growth and one red showing decline, with trend lines and arrows
Free with trial Business bar graph with upward and downward arrow. Trend up and down icon vector in black circle. Decrease bar vectors Business bar graph with upward and downward arrow. Trend up and down icon in black circle
Free with trial A 3D render of a bar chart displaying a significant downward trend. Blue bars of varying heights represent data points, intersected by a sharp orange line that clearly illustrates a decline over time. The dark, reflective surface below the chart suggests a digital display or a futuristic interface. This image is ideal for representing financial losses, market crashes, performance decline, or negative trends in various industries. Decrease bar illustrations Downtrending Bar Chart with Orange Line on Dark Background. A 3D render of a bar chart displaying a significant downward trend. Blue bars of varying heights represent data points, intersected by a sharp orange line that clearly illustrates a decline over time. The dark, reflective surface below the chart suggests a digital display or a futuristic interface. This image is ideal for representing financial losses, market crashes, performance decline, or negative trends in various industries.
Free with trial Downward Trend Bar Chart with an Arrow in a Hand-Drawn Style. Decrease bar vectors Downward Trend Bar Chart with an Arrow in a Hand-Drawn Style
Free with trial Thermometer and falling bar chart with a directional arrow symbolizing temperature drop, analysis, and reduction. Ideal for climate change, trends, progress, energy, analytics, business metrics. Decrease bar illustrations Thermometer and Declining Bar Chart Representing Cooling Trends and Data Insights. Thermometer and falling bar chart with a directional arrow symbolizing temperature drop, analysis, and reduction. Ideal for climate change, trends, progress, energy, analytics, business metrics
Free with trial A collection of hand-drawn bar chart icons with upward and downward arrows, representing financial growth and decline. Decrease bar vectors Hand-drawn bar chart with up and down arrows .Vector illustration. A collection of hand-drawn bar chart icons with upward and downward arrows, representing financial growth and decline
Free with trial Bar graph with weather icons and rising line chart on grid backdrop. Ideal for analytics, statistics, weather data, trend analysis, business forecasting, seasonal planning. A simple flat metaphor. Decrease bar illustrations Seasonal Data Trends Displayed on Bar Graph with Line Chart and Weather Icons. Bar graph with weather icons and rising line chart on grid backdrop. Ideal for analytics, statistics, weather data, trend analysis, business forecasting, seasonal planning. A simple flat metaphor
Free with trial Red bar graph decreasing with blue arrow representing a loss in business, sales, jobs, or other financial loss. Decrease bar vectors Red bar graph decreasing with blue arrow representing a loss in business
Free with trial 3D Bar Chart Visualizing Business Performance Decline Trends - Business performance decline shown with a 3D bar chart to analyze negative trends. Decrease bar illustrations 3D Bar Chart Visualizing Business Performance Decline Trends
Free with trial Down Downward Trend Chart Drop Line Bar Trending Data Statistic Graph Market Share Stock Line Outline Black White Vector Icon Sign Symbol Graphic Artwork. Decrease bar vectors Down Downward Trend Chart Drop Line Bar Trending Data Statistic Graph Market Share Stock Line Outline Black White Vector Icon
Free with trial Declining red bar graph shown with a falling red arrow directed towards a grey building against a bright white background, symbolizing financial loss or economic downturn for business concepts. Decrease bar illustrations Falling Red Bar Graph with Grey Building on White Background. Declining red bar graph shown with a falling red arrow directed towards a grey building against a bright white background, symbolizing financial loss or economic downturn for business concepts
Free with trial A 3D isometric bar chart displaying colorful bars of varying heights on a blue grid base, representing data analysis and business growth, isolated on white. Decrease bar illustrations 3d bar chart with colorful bars isolated on white background. A 3D isometric bar chart displaying colorful bars of varying heights on a blue grid base, representing data analysis and business growth, isolated on white
Free with trial This image displays a dynamic business analytics dashboard featuring both bar and line graphs. The bar chart illustrates varying percentages (15%, 50%, 75%, 85%), suggesting performance metrics or growth stages. The line chart, with its intersecting blue lines and data points, represents trends, fluctuations, and comparisons over time or across different categories. The clean, modern design makes it ideal for financial reports, business presentations, and data visualization concepts. Decrease bar illustrations Business Growth and Performance Analysis with Bar and Line Charts. This image displays a dynamic business analytics dashboard featuring both bar and line graphs. The bar chart illustrates varying percentages (15%, 50%, 75%, 85%), suggesting performance metrics or growth stages. The line chart, with its intersecting blue lines and data points, represents trends, fluctuations, and comparisons over time or across different categories. The clean, modern design makes it ideal for financial reports, business presentations, and data visualization concepts.
Free with trial Growth and declining graph bar icon with flat rounded cartoon style. Charts with bar growth and declining. Graph trending upwards arrow and downwards arrow. Eps 10 vector illustration. Decrease bar vectors Growth and declining graph bar icon with flat rounded cartoon style
Free with trial Green bar chart showing a downward trend with a down arrow graphic. Decrease bar vectors Green bar chart showing a downward trend with a down arrow graphic
Free with trial A simple line style icon of a bar chart representing growth, data, or statistics. This graphic element is perfect for use in presentations, infographics, web design, and user interfaces. Decrease bar vectors Simple Line Style Bar Chart Graphic Outline Display Graph Icon. A simple line style icon of a bar chart representing growth, data, or statistics. This graphic element is perfect for use in presentations, infographics, web design, and user interfaces.
Free with trial A 3D white character cheerfully presents a bar chart showing upward business growth trends, highlighting success and positive development. Decrease bar illustrations 3D Character Presenting Business Growth Bar Chart. A 3D white character cheerfully presents a bar chart showing upward business growth trends, highlighting success and positive development.
Free with trial Colorful bar graph showing market analysis, financial report and accounting on a digital tablet. Generative AI. Decrease bar illustrations Colorful bar graph showing market analysis and financial report. Colorful bar graph showing market analysis, financial report and accounting on a digital tablet. Generative AI
Free with trial A simple outline icon illustration of a bar chart diagram, used to display data analysis and performance metrics. Ideal for presentations, infographics, and dashboards. Decrease bar vectors Outline Simple Bar Chart Diagram Icon Graphic for Data Analysis. A simple outline icon illustration of a bar chart diagram, used to display data analysis and performance metrics. Ideal for presentations, infographics, and dashboards.
Free with trial Declining bar chart with downward arrow indicates negative trend. Decrease bar vectors Declining bar chart with downward arrow indicates negative trend
Free with trial This 3D illustration shows a colorful bar graph with pastel-colored cylinders on a white circular base, representing upward business growth trends. The chart includes a line graph illustrating various data points. Decrease bar illustrations 3D Colorful Cylindrical Bar Graph Chart Showing Business Growth. This 3D illustration shows a colorful bar graph with pastel-colored cylinders on a white circular base, representing upward business growth trends. The chart includes a line graph illustrating various data points.
Free with trial Downward Trend Bar Chart Showing Losses with a Declining Red Arrow. Decrease bar vectors Downward Trend Bar Chart Showing Losses with a Declining Red Arrow
Free with trial Financial bar chart icon with up and down arrow. Economic growth and decline symbol in black circle. Decrease bar vectors Financial bar chart with up and down arrow. Economic growth and decline symbol in black circle
Free with trial Financial concept image featuring a blue bar chart with a red downward arrow, illustrating decline, recession, or loss over time. Ideal for presentations, reports, infographics, economic forecasts, and business documentation. Clean, clear, and professional visual, created ai. Decrease bar illustrations Business bar chart showing financial decline with downward arrow. Financial concept image featuring a blue bar chart with a red downward arrow, illustrating decline, recession, or loss over time. Ideal for presentations, reports, infographics, economic forecasts, and business documentation. Clean, clear, and professional visual, created ai.
Free with trial Up and down graph icon in line style. Outline bar chart with uptrend and downtrend arrow symbol vector. Decrease bar vectors Up and down graph icon in line style. Outline bar chart with uptrend and downtrend arrow symbol
Free with trial Digita blue bar charts descend steadily across a digital grid, illustrating a decline in financial performance and market trends. Downward arrows emphasize loss, negative growth, and economic challenges, while smooth transitions and a tech-inspired layout enhance the visual impact of the data downturn. Decrease bar illustrations Digital blue bar chart with decreasing business concept. Digita blue bar charts descend steadily across a digital grid, illustrating a decline in financial performance and market trends. Downward arrows emphasize loss, negative growth, and economic challenges, while smooth transitions and a tech-inspired layout enhance the visual impact of the data downturn.
Free with trial 3D rendering of declining bar and line graphs over a grid background. Decrease bar illustrations 3D rendering of declining bar and line graphs over a grid background.
Free with trial This image features a vibrant 3D representation of a bar chart, composed of translucent, glowing blocks in shades of pink, yellow, and cyan. The bars are arranged in varying heights, suggesting growth or data representation. The background is a dark green digital grid with subtle light effects and floating particles, creating a futuristic and technological atmosphere. This visual is ideal for concepts related to finance, data analysis, technology, growth, and digital trends. Decrease bar illustrations Abstract 3D Bar Chart with Neon Glow on Green Digital Background. This image features a vibrant 3D representation of a bar chart, composed of translucent, glowing blocks in shades of pink, yellow, and cyan. The bars are arranged in varying heights, suggesting growth or data representation. The background is a dark green digital grid with subtle light effects and floating particles, creating a futuristic and technological atmosphere. This visual is ideal for concepts related to finance, data analysis, technology, growth, and digital trends.
Free with trial This vibrant 3D rendering showcases an ascending bar chart, featuring colorful cylinders and a rising line graph, all set against a clean white backdrop. Ideal for presentations, reports, or marketing materials to visually represent growth, progress, and success. Decrease bar illustrations Ascending Colorful 3D Bar Chart with Growth Line on Pink Platform. This vibrant 3D rendering showcases an ascending bar chart, featuring colorful cylinders and a rising line graph, all set against a clean white backdrop. Ideal for presentations, reports, or marketing materials to visually represent growth, progress, and success.
Free with trial Sad emoticon alongside two keys and a downward bar chart reflecting themes of loss, failure, missed opportunity, and regression. Ideal for business setback, financial trouble, discouragement, or. Decrease bar vectors Sad face with keys and declining bar graph representing loss, failure, and setback themes. Sad emoticon alongside two keys and a downward bar chart reflecting themes of loss, failure, missed opportunity, and regression. Ideal for business setback, financial trouble, discouragement, or
Free with trial Bar graph consisting of rectangular blocks in different colors: blue, green, yellow, orange, purple, and pink, decreasing in height. Overlaying the graph is a bold, zigzagging red arrow pointing downward, representing a declining trend. The red arrow contrasts sharply with the pastel-colored bars, emphasizing a negative change or trend. Set against a white background for clarity and focus. Decrease bar illustrations Declining Trends: A Bar Graph with a Downward Red Arrow. Generative AI. Bar graph consisting of rectangular blocks in different colors: blue, green, yellow, orange, purple, and pink, decreasing in height. Overlaying the graph is a bold, zigzagging red arrow pointing downward, representing a declining trend. The red arrow contrasts sharply with the pastel-colored bars, emphasizing a negative change or trend. Set against a white background for clarity and focus.
Free with trial A striking 3D render visualizes economic decline with a vibrant red bar graph against a clean white background. This impactful image vividly represents a financial crisis and recession, showcasing a clear downward trend through its falling bars and an implied arrow. It symbolizes loss, failure, and potential bankruptcy within the business and finance sectors. Ideal for illustrating articles on the. Decrease bar illustrations Red economic decline bar graph depicting financial downfall and negative trends on white background. A striking 3D render visualizes economic decline with a vibrant red bar graph against a clean white background. This impactful image vividly represents a financial crisis and recession, showcasing a clear downward trend through its falling bars and an implied arrow. It symbolizes loss, failure, and potential bankruptcy within the business and finance sectors. Ideal for illustrating articles on the
Free with trial A glowing green bar chart with a data line and grid on a black background, representing financial performance. Decrease bar illustrations Glowing Green Bar Chart with Data Line on photo Black graph finance. A glowing green bar chart with a data line and grid on a black background, representing financial performance
Free with trial Falling bar graph with a red arrow indicating decline and a rising scale. Decrease bar vectors Falling bar graph with a red arrow indicating decline and a rising scale
Free with trial Simple bar graph showing downward trend with arrow, decline in progress. Decrease bar vectors Simple bar graph showing downward trend with arrow, decline in progress
Free with trial Bar chart with upward trend, sad face, and analytics dashboard highlights challenges in progress or data performance. Ideal for financial difficulty, business risk, loss assessment, data analysis. Decrease bar vectors Rising Bar Graph with Sad Face Symbolizing Negative Growth or Challenges in Analytics. Bar chart with upward trend, sad face, and analytics dashboard highlights challenges in progress or data performance. Ideal for financial difficulty, business risk, loss assessment, data analysis
Free with trial Graph up and down icon vector in circular line. Outline bar chart with arrow symbol. Analytics concept. Decrease bar vectors Graph up and down icon in circular line. Outline bar chart with arrow symbol. Analytics concept
Free with trial A collection of icons Decrease report, progress report, Upward report, Downward report, Profit increase, Profit decrease, icon. Decrease bar vectors Decrease report, progress report, Upward report, Downward report, Profit increase, Profit decrease, icon
Free with trial A vibrant, 3D rendered bar chart displays ascending data, symbolizing progress and achievement. The pastel-colored bars are set against a clean white background, emphasizing their visual impact and providing a professional, modern feel. Perfect for presentations or business-related projects. Decrease bar illustrations Colorful 3D Bar Chart Showing Growth and Success on White Background. A vibrant, 3D rendered bar chart displays ascending data, symbolizing progress and achievement. The pastel-colored bars are set against a clean white background, emphasizing their visual impact and providing a professional, modern feel. Perfect for presentations or business-related projects.
Free with trial Sketchy bar graph illustration of financial decline and economic loss. Decrease bar vectors Sketchy bar graph illustration of financial decline and economic loss
Free with trial A red arrow indicates a downward trend over a colorful bar graph, isolated on a clean white background. Decrease bar illustrations Red downward trend arrow over bar chart isolated on white background. A red arrow indicates a downward trend over a colorful bar graph, isolated on a clean white background
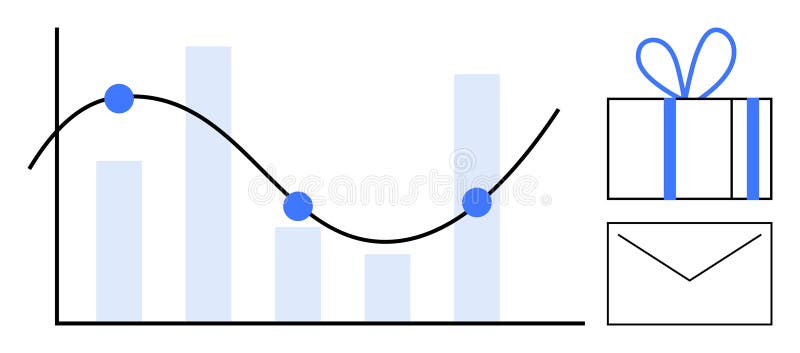
Free with trial Graph with decreasing bar chart and line graph noting key points beside a gift box and envelope. Ideal for business analysis, performance tracking, rewards programs, marketing, sales targets, client. Decrease bar vectors Bar Graph with Line Chart, Gift Box, and Envelope Representing Business Metrics and Rewards. Graph with decreasing bar chart and line graph noting key points beside a gift box and envelope. Ideal for business analysis, performance tracking, rewards programs, marketing, sales targets, client
Free with trial Decrease vector icon on the white background. EPS 10. Decrease bar vectors Decrease thin line vector icon set. Decrease vector icon on the white background. EPS 10
Free with trial Decrease vector icon on the white background. EPS 10. Decrease bar vectors Decrease thin line vector icon set. Decrease vector icon on the white background. EPS 10
Free with trial Graph going Up and Down sign with green and red arrows. graph increase, decrease sign design. Decrease bar vectors Graph going Up and Down sign with green and red arrows. graph increase, decrease sign
Free with trial Decrease vector icon on the white background. EPS 10. Decrease bar vectors Decrease thin line vector icon set. Decrease vector icon on the white background. EPS 10
Free with trial Decrease vector icon on the white background. EPS 10. Decrease bar vectors Decrease thin line vector icon set. Decrease vector icon on the white background. EPS 10
Free with trial Decrease vector icon on the white background. EPS 10. Decrease bar vectors Decrease thin line vector icon set. Decrease vector icon on the white background. EPS 10
Free with trial Decrease vector icon on the white background. EPS 10. Decrease bar vectors Decrease thin line vector icon set. Decrease vector icon on the white background. EPS 10
Free with trial Decrease vector icon on the white background. EPS 10. Decrease bar vectors Decrease thin line vector icon set. Decrease vector icon on the white background. EPS 10
Free with trial Decrease vector icon on the white background. EPS 10. Decrease bar vectors Decrease thin line vector icon set. Decrease vector icon on the white background. EPS 10
Free with trial Decrease vector icon on the white background. EPS 10. Decrease bar vectors Decrease thin line vector icon set. Decrease vector icon on the white background. EPS 10
Free with trial Decrease vector icon on the white background. EPS 10. Decrease bar vectors Decrease thin line vector icon set. Decrease vector icon on the white background. EPS 10
Free with trial Decrease vector icon on the white background. EPS 10. Decrease bar vectors Decrease thin line vector icon set. Decrease vector icon on the white background. EPS 10
Free with trial Decrease vector icon on the white background. EPS 10. Decrease bar vectors Decrease thin line vector icon set. Decrease vector icon on the white background. EPS 10
Free with trial This image showcases a vibrant infographic with 3D bar, pie, and line charts. The colorful elements are displayed on a teal platform, ideal for presentations or reports. Decrease bar illustrations Colorful 3D Bar Chart, Pie Chart, and Line Graph Infographic on Teal Platform. This image showcases a vibrant infographic with 3D bar, pie, and line charts. The colorful elements are displayed on a teal platform, ideal for presentations or reports.
Free with trial This image depicts a vibrant blue calculator positioned next to a colorful bar graph and stack of gold coins, symbolizing financial success and growth. The scene is clean and bright, perfect for illustrating financial concepts. Decrease bar illustrations Colorful Calculator, Bar Graph, and Coins Representing Financial Growth. This image depicts a vibrant blue calculator positioned next to a colorful bar graph and stack of gold coins, symbolizing financial success and growth. The scene is clean and bright, perfect for illustrating financial concepts.
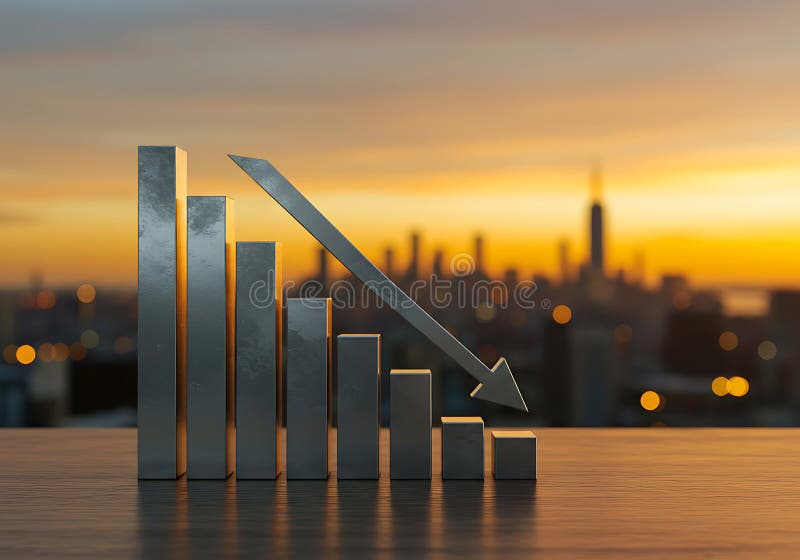
Free with trial A 3D rendering depicts a large red arrow pointing sharply downward, superimposed on a bar graph. The graph's bars are alternating gray and white, creating a textured pattern. The graph is positioned against a blurred backdrop of modern city skyscrapers. The overall color palette is cool, with the red arrow providing a stark contrast. The image suggests a negative economic trend or market decline. , generated by AI. Decrease bar illustrations Red Downward Trend Arrow on Gray White Bar Graph Cityscape Background. A 3D rendering depicts a large red arrow pointing sharply downward, superimposed on a bar graph. The graph's bars are alternating gray and white, creating a textured pattern. The graph is positioned against a blurred backdrop of modern city skyscrapers. The overall color palette is cool, with the red arrow providing a stark contrast. The image suggests a negative economic trend or market decline., generated by AI.
Free with trial Vector illustration of decreasing bar graph with arrow, financial concept. Decrease bar vectors Vector illustration of decreasing bar graph with arrow, financial concept
Free with trial Dollar coin next to declining bar graph and directional arrow illustrating financial downturn. Ideal for finance, economics, investment, stock market, loss, budget analysis, simple flat metaphor. Decrease bar illustrations Dollar Sign Coin and Declining Bar Chart with Arrow Indicating Financial Downward Trend. Dollar coin next to declining bar graph and directional arrow illustrating financial downturn. Ideal for finance, economics, investment, stock market, loss, budget analysis, simple flat metaphor
Free with trial A 3D bar chart with red and green bars representing financial data trends, isolated on white background. Decrease bar illustrations 3d bar chart showing financial data trends isolated on white background. A 3D bar chart with red and green bars representing financial data trends, isolated on white background
Free with trial A 3D bar chart with a red line graph indicating a significant decline, isolated on a white background. Decrease bar illustrations Financial bar chart showing downward trend isolated on white background. A 3D bar chart with a red line graph indicating a significant decline, isolated on a white background
Free with trial A visual representation of data showing a decline over a period. The blue bars are arranged in descending order of height, each marked with numerical indicators, suggesting a decrease in value or quantity. Decrease bar illustrations Blue bar chart showing decreasing trend over time with numerical labels. A visual representation of data showing a decline over a period. The blue bars are arranged in descending order of height, each marked with numerical indicators, suggesting a decrease in value or quantity