Free with trial Red 3d arrow going down stock icon on white background. Bankruptcy, financial market crash icon for your web site design, logo, app, UI. graph chart downtrend symbol. chart going down sign. Decrease bar vectors Red 3d arrow going down stock icon on white background. Bankruptcy, financial market crash icon for your web site design
Free with trial Green up and red down 3d arrow graph showing rising, descending trend, business result, profit or loss symbol symbol. Business arrow, goals concept. 3d world money symbols. Financial growth. Decrease bar illustrations Green up and red down 3d arrow graph showing rising, descending trend, business result, 3d world money symbols. Financial growth. Green up and red down 3d arrow graph showing rising, descending trend, business result, profit or loss symbol symbol. Business arrow, goals concept. 3d world money symbols. Financial growth
Free with trial This image presents a compelling visual representation of a global economic downturn. A prominent, three-dimensional white arrow dramatically plunges downward, superimposed on a world map rendered in dark, somber tones. The map serves as a backdrop to several red bar graphs, illustrating a decline in various economic indicators across different regions of the globe. The overall color scheme reinforces a sense of crisis and uncertainty. The arrow's sharp descent visually emphasizes the severity of the economic drop. Numerical data and graphical representations are included, further supporting the downward economic trend. Decrease bar illustrations Global Economic Downturn Visualized with 3D Arrow and Charts. This image presents a compelling visual representation of a global economic downturn. A prominent, three-dimensional white arrow dramatically plunges downward, superimposed on a world map rendered in dark, somber tones. The map serves as a backdrop to several red bar graphs, illustrating a decline in various economic indicators across different regions of the globe. The overall color scheme reinforces a sense of crisis and uncertainty. The arrow's sharp descent visually emphasizes the severity of the economic drop. Numerical data and graphical representations are included, further supporting the downward economic trend.
Free with trial A simple graphic illustration of a decreasing signal strength icon. The icon features a black rounded rectangle containing four white vertical bars of decreasing height, representing a weakening signal. This image can be used to illustrate concepts such as connectivity issues, data loss, or declining performance in various technological contexts. Decrease bar vectors Decreasing Signal Strength Icon
Free with trial Falling bar chart with downward arrow representing business decline and financial problems. Ideal for risk, loss, and economic downturn concepts. Decrease bar vectors Business decline chart downward trend problem failure vector silhouette illustration design. Falling bar chart with downward arrow representing business decline and financial problems. Ideal for risk, loss, and economic downturn concepts
Free with trial Declining business graph. Financial crisis chart. Negative market trend. Black and white economic vector icons. Decrease bar vectors Financial loss bar chart icon set with falling arrow and dollar sign for economic recession. Declining business graph. Financial crisis chart. Negative market trend. Black and white economic vector icons
Free with trial Vector illustration of a downward arrow symbolizing economic decline, recession, and financial downturn. Decrease bar vectors Vector illustration of a downward arrow symbolizing economic decline, recession
Free with trial Declining business graph. Financial crisis chart. Negative market trend. Black and white economic vector icons. Decrease bar illustrations Financial loss bar chart icon set with falling arrow and dollar sign for economic recession. Declining business graph. Financial crisis chart. Negative market trend. Black and white economic vector icons.
Free with trial Red 3d arrow going down stock icon on white background. Bankruptcy, financial market crash icon for your web site design, logo, app, UI. graph chart downtrend symbol. chart going down sign. Decrease bar vectors Red 3d arrow going down stock icon on white background. Bankruptcy, financial market crash icon for your web site design, logo. Red 3d arrow going down stock icon on white background. Bankruptcy, financial market crash icon for your web site design, logo, app, UI. graph chart downtrend symbol.chart going down sign.
Free with trial Red 3d arrow going down stock icon on white background. Bankruptcy, financial market crash icon for your web site design, logo, app, UI. graph chart downtrend symbol. chart going down sign. Decrease bar vectors Red 3d arrow going down stock icon on white background. Bankruptcy, financial market crash icon for your web site design
Free with trial Red 3d arrow going down stock icon on white background. Bankruptcy, financial market crash icon for your web site design, logo, app, UI. graph chart downtrend symbol. chart going down sign. Decrease bar vectors Red 3d arrow going down stock icon on white background. Bankruptcy, financial market crash icon for your web site design
Free with trial Dollar and bitcoin Coins with Upward Arrows Representing Financial Growth in Minimalist Flat Style. Decrease bar vectors Dollar and bitcoin Coins with Upward Arrows Representing Financial Growth in Minimalist Flat Style
Free with trial A black and white line drawing depicts a magnifying glass focusing on a gear, a descending bar graph, and a. Decrease bar illustrations Decline Analysis Magnifying Glass, Gear, and Downward Graph. A black and white line drawing depicts a magnifying glass focusing on a gear, a descending bar graph, and a.
Free with trial A simple line drawing depicts a declining bar graph with an arrow pointing downwards, all viewed through a magnifying. Decrease bar illustrations Declining Graph Under Magnifying Glass Loss Analysis Icon. A simple line drawing depicts a declining bar graph with an arrow pointing downwards, all viewed through a magnifying.
Free with trial Decreasing graph line icon. Neumorphic, Flat shadow, 3d buttons. Column chart sign. Crisis diagram symbol. Line decreasing graph icon. Social media icons. Vector. Decrease bar vectors Decreasing graph line icon. Crisis chart sign. Neumorphic buttons. Vector. Decreasing graph line icon. Neumorphic, Flat shadow, 3d buttons. Column chart sign. Crisis diagram symbol. Line decreasing graph icon. Social media icons. Vector
Free with trial A collection of eight thin-line related to finance and business. The depict a stack of coins with a dollar sign, a document with a dollar sign, an upward trending graph over city buildings, and a bar chart with a plus sign. The bottom row coins and currency symbols, a calculator with a dollar sign, a document with a calculator and charts, and a person. Decrease bar illustrations Financial set with charts and calculator finance business. A collection of eight thin-line related to finance and business. The depict a stack of coins with a dollar sign, a document with a dollar sign, an upward trending graph over city buildings, and a bar chart with a plus sign. The bottom row coins and currency symbols, a calculator with a dollar sign, a document with a calculator and charts, and a person
Free with trial Graph Declining with Arrow Line Art Minimalist Representation. Decrease bar vectors Graph Declining with Arrow Line Art Minimalist Representation
Free with trial A simple black icon of a magnifying glass with a minus symbol inside the lens is presented on a clean white background. The magnifying glass has a circular lens and a handle, and the minus sign is a horizontal bar centered within the circle. This graphic represents the action of zooming out or reducing the view. Decrease bar illustrations Black zoom out magnifying glass icon with minus symbol on white background image photo. A simple black icon of a magnifying glass with a minus symbol inside the lens is presented on a clean white background. The magnifying glass has a circular lens and a handle, and the minus sign is a horizontal bar centered within the circle. This graphic represents the action of zooming out or reducing the view
Free with trial Collection of simple black vector icons representing financial charts, data analysis graphs, and business statistics. Includes trend arrows, magnifier, and settings symbols. Decrease bar vectors Set of black business graph and chart icons for data analysis. Collection of simple black vector icons representing financial charts, data analysis graphs, and business statistics. Includes trend arrows, magnifier, and settings symbols
Free with trial This illustration depicts a financial concept with a bar graph showing a downward trend, alternating between green (profit) and red (loss) bars. A red line graph with an arrow indicates a significant decline. To the right, a stack of documents represents a profit and loss statement, with 'Profit' and 'Loss' clearly labeled. This visual is ideal for representing financial performance, business challenges, economic downturns, or the need for strategic adjustments. Decrease bar vectors Declining Profit and Loss Statement with Downward Trend Graph. This illustration depicts a financial concept with a bar graph showing a downward trend, alternating between green (profit) and red (loss) bars. A red line graph with an arrow indicates a significant decline. To the right, a stack of documents represents a profit and loss statement, with 'Profit' and 'Loss' clearly labeled. This visual is ideal for representing financial performance, business challenges, economic downturns, or the need for strategic adjustments.
Free with trial Doodle Graph icon. Blue pen hand drawn infographic symbol on a notepaper piece. Line art style graphic design element. Web button with shadow. Decline, save on expences concept. Decrease bar vectors Doodle Graph icon
Free with trial A horizontal layout of multiple data visualizations illustrates key trends in HIV treatment and diagnosis, featuring line and bar graphs with upward and downward trajectories indicating changes in patient numbers, diagnosis percentages, and global infection rates, where a blue line graph shows increasing patient counts, a second bar chart reflects diagnosed case percentages, a third displays. Decrease bar illustrations HIV treatment progress dashboard with statistical graphs showing patient growth, diagnosis rates, and global trends. A horizontal layout of multiple data visualizations illustrates key trends in HIV treatment and diagnosis, featuring line and bar graphs with upward and downward trajectories indicating changes in patient numbers, diagnosis percentages, and global infection rates, where a blue line graph shows increasing patient counts, a second bar chart reflects diagnosed case percentages, a third displays
Free with trial A detailed view of gold bars and coins under a magnifying glass, set against a backdrop of financial charts and data streams. The image evokes a sense of careful scrutiny and investment analysis in the financial markets. The shiny gold textures contrast with the digital screens, creating a blend of. Decrease bar illustrations Golden Investment Analysis. A detailed view of gold bars and coins under a magnifying glass, set against a backdrop of financial charts and data streams. The image evokes a sense of careful scrutiny and investment analysis in the financial markets. The shiny gold textures contrast with the digital screens, creating a blend of
Free with trial Circular maze with a descending bar chart icon, symbolizing the challenge of navigating business data and analytics amid declines, obstacles, and the search for strategic solutions and recovery. Decrease bar illustrations Navigating complex data decline challenges and finding solutions. Circular maze with a descending bar chart icon, symbolizing the challenge of navigating business data and analytics amid declines, obstacles, and the search for strategic solutions and recovery
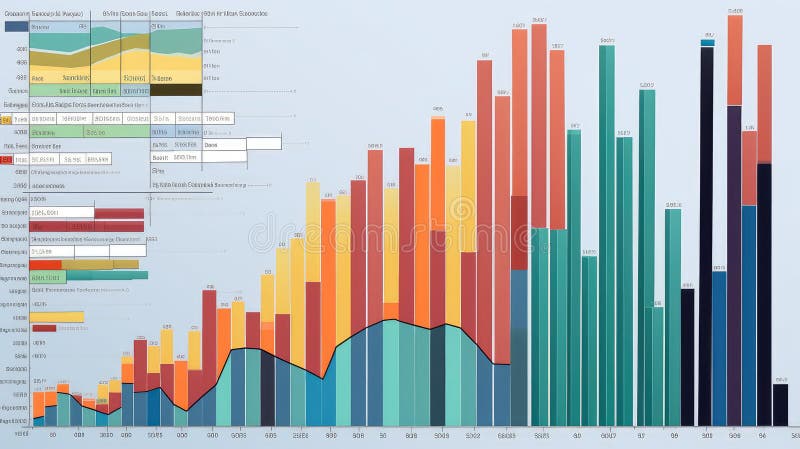
Free with trial This image presents a detailed analysis of business performance metrics, including market share, quarterly sales, and key performance indicators (KPIs. Decrease bar illustrations Comprehensive business performance metrics and growth analysis. This image presents a detailed analysis of business performance metrics, including market share, quarterly sales, and key performance indicators (KPIs
Free with trial An artistic creation that reflects beauty in simplicity. The design highlights precision, clean details, and a harmonious flow, resulting in a versatile and professional visual outcome. Decrease bar vectors Business lion Presenting bar graph chart. An artistic creation that reflects beauty in simplicity. The design highlights precision, clean details, and a harmonious flow, resulting in a versatile and professional visual outcome
Free with trial A prominent 3D metallic US dollar sign stands against a dynamic digital background featuring various financial charts and graphs. The background displays a fluctuating line graph and a colorful bar chart, symbolizing market trends, economic data, and investment performance. This image powerfully conveys concepts of finance, global economy, currency strength, stock market analysis, and wealth management in a modern, digital context. Ideal for illustrating reports, presentations, or articles related to business, banking, and financial growth. Decrease bar illustrations US Dollar Symbol with Digital Financial Charts and Market Data. A prominent 3D metallic US dollar sign stands against a dynamic digital background featuring various financial charts and graphs. The background displays a fluctuating line graph and a colorful bar chart, symbolizing market trends, economic data, and investment performance. This image powerfully conveys concepts of finance, global economy, currency strength, stock market analysis, and wealth management in a modern, digital context. Ideal for illustrating reports, presentations, or articles related to business, banking, and financial growth.
Free with trial Businesswoman drags a ripped money bag and losing money and coins for bankruptcy, financial crisis and recession concept illustration. Decrease bar vectors Businesswoman Drags Ripped Money Bag and Losing Money and Coins for Bankruptcy, Financial Crisis Recession Concept Illustration. Businesswoman drags a ripped money bag and losing money and coins for bankruptcy, financial crisis and recession concept illustration
Free with trial A 3D rendered image of a bar chart with a downward trend, set against a bright yellow background. The chart features grey frame and orange bars, with a prominent red arrow indicating a decline. This image is suitable for illustrating concepts related to financial loss, market downturn, economic recession, or negative performance in business and investment contexts. Decrease bar illustrations Downward Trend Chart on Yellow Background. A 3D rendered image of a bar chart with a downward trend, set against a bright yellow background. The chart features grey frame and orange bars, with a prominent red arrow indicating a decline. This image is suitable for illustrating concepts related to financial loss, market downturn, economic recession, or negative performance in business and investment contexts.
Free with trial Dollar Coins with Upward and Downward Arrows Representing Financial Growth and Decline in Minimalist Flat Style. Decrease bar vectors Dollar Coins with Upward and Downward Arrows Representing Financial Growth and Decline in Minimalist Flat Style.
Free with trial A conceptual vector illustration depicting a severe economic downturn. The image features a grey bar chart with progressively shorter bars, symbolizing declining profits or performance. A bold red arrow points sharply downwards, representing a crash or significant loss, alongside a blue line graph also showing a negative trend. This graphic is ideal for illustrating concepts such as financial crisis, recession, stock market crash, business failure, bankruptcy, and negative growth. Perfect for financial reports, business presentations, news articles, and economic analysis infographics. Decrease bar illustrations Economic Downturn and Financial Crisis Graph. A conceptual vector illustration depicting a severe economic downturn. The image features a grey bar chart with progressively shorter bars, symbolizing declining profits or performance. A bold red arrow points sharply downwards, representing a crash or significant loss, alongside a blue line graph also showing a negative trend. This graphic is ideal for illustrating concepts such as financial crisis, recession, stock market crash, business failure, bankruptcy, and negative growth. Perfect for financial reports, business presentations, news articles, and economic analysis infographics.
Free with trial A striking 3D rendering depicts a significant financial market decline, symbolized by a bold red arrow sharply pointing downwards across a dark grey background. The scene includes a subtle line graph and bar charts in shades of red and grey, illustrating a negative trend in data. This image effectively conveys concepts of economic recession, stock market crash, business losses, and financial crisis. Ideal for articles, presentations, and reports discussing market downturns, investment risks, or economic challenges. Decrease bar illustrations Financial Market Decline with Red Arrow Chart. A striking 3D rendering depicts a significant financial market decline, symbolized by a bold red arrow sharply pointing downwards across a dark grey background. The scene includes a subtle line graph and bar charts in shades of red and grey, illustrating a negative trend in data. This image effectively conveys concepts of economic recession, stock market crash, business losses, and financial crisis. Ideal for articles, presentations, and reports discussing market downturns, investment risks, or economic challenges.
Free with trial 3d blue magnifying glass with downward-trending chart inside Financial analysis, economic decline, risk assessment, market monitoring, investment evaluation concept Low poly digital futuristic Vector. Decrease bar vectors 3d blue magnifying glass with downward-trending chart inside Financial analysis, economic decline, risk assessment
Free with trial Year data charts illustration color coded, categories month, total representation year data charts. Decrease bar illustrations Year data charts
Free with trial A close-up view of black financial and business chart icons arranged in a grid on a light background. Decrease bar illustrations Close-up of financial and business chart icons on a grid finance charts. A close-up view of black financial and business chart icons arranged in a grid on a light background
Free with trial Business graph with up arrow down arrow logo template. Decrease bar vectors Business graph with up arrow down arrow logo template
Free with trial Displaying purple world map with rising red bars, red line graph on slide with green grid. Infographic, analytics, digital, technology, finance, strategic, modern. Decrease bar illustrations Displaying purple world map with rising red bars, red line graph on slide with green grid
Free with trial Illustration of a business activities. Decrease bar vectors Illustration of a business activities
Free with trial A 3D rendering shows a financial graph with a decreasing rate. The pink arrow points downwards, indicating a loss. The bars represent data points in a business or economic context. Decrease bar illustrations Decreasing rate financial graph on white background. A 3D rendering shows a financial graph with a decreasing rate. The pink arrow points downwards, indicating a loss. The bars represent data points in a business or economic context
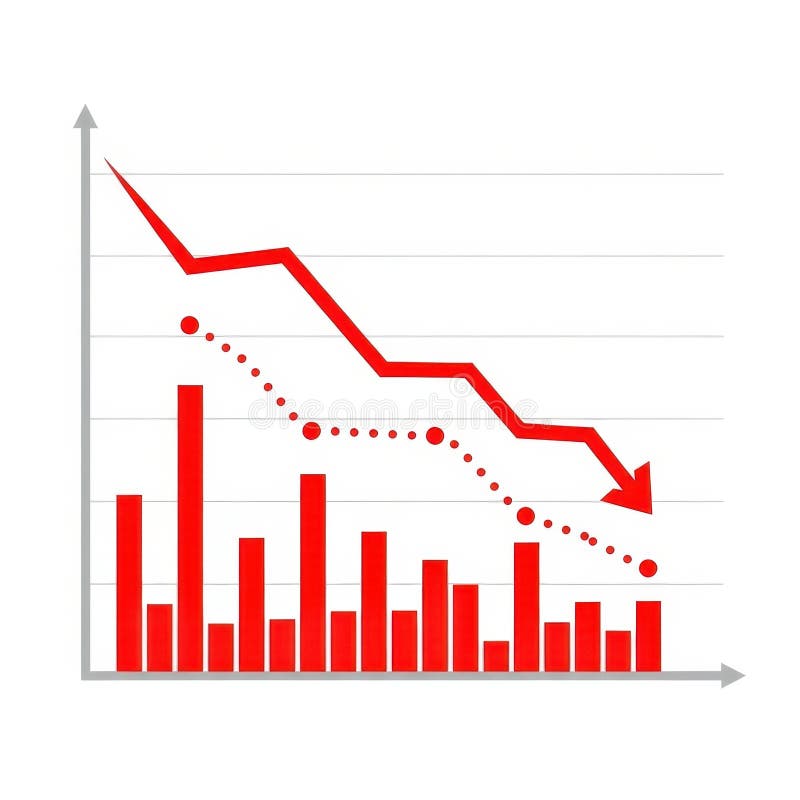
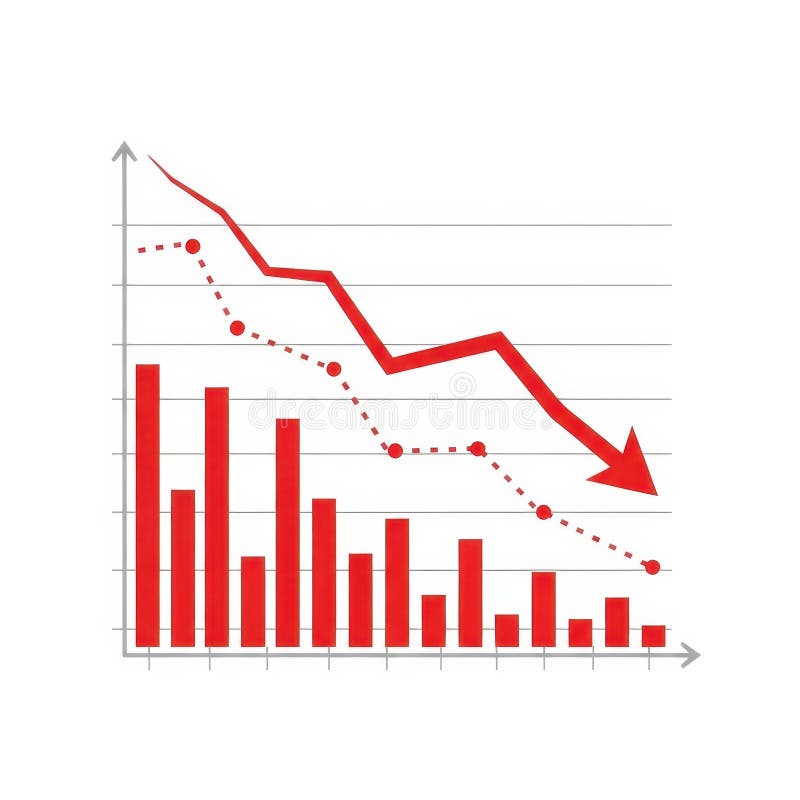
Free with trial A visual representation of negative financial performance. It features red bars and a red line graph showing a downward trend, accompanied by a dotted line indicating a similar pattern. Decrease bar illustrations Red downward trending graph with bars and dotted line. A visual representation of negative financial performance. It features red bars and a red line graph showing a downward trend, accompanied by a dotted line indicating a similar pattern
Free with trial Financial arrows up and down. Financial growth and decline. Graph with green and red arrows. Finance diagram, graphic charts icon set. Decrease bar vectors Financial arrows up and down. Financial growth and decline. Graph with green and red arrows. Finance diagram, graphic charts icon
Free with trial Abstract 3D render of a financial growth chart. The image features a series of vertical bars, some in teal and others in orange, representing data points on a graph. The bars increase in height towards the right, suggesting positive growth or progress. The chart is set against a dark background with a subtle grid pattern and a reflective surface, adding depth and visual interest. Suitable for illustrating financial reports, market analysis, or business trends. Decrease bar illustrations Abstract Financial Growth Chart. Abstract 3D render of a financial growth chart. The image features a series of vertical bars, some in teal and others in orange, representing data points on a graph. The bars increase in height towards the right, suggesting positive growth or progress. The chart is set against a dark background with a subtle grid pattern and a reflective surface, adding depth and visual interest. Suitable for illustrating financial reports, market analysis, or business trends.
Free with trial Up and down sign with green and black arrows in flat style showing movement direction and sales change. Vector illustration of a sales bar chart icon used as an elevator symbol or universal pictogram. Decrease bar vectors Up and down sign with green and black arrows in flat style showing movement direction
Free with trial Bar chart illustration showing a descending trend. Four vertical bars in gradient hues of orange and blue decrease in height from left to right. A line graph with circles marks the top of each bar, emphasizing the downward trend. The design is simple and uses soft pastel colors, against a white background, highlighting the decreasing business data concept. Decrease bar vectors Decreasing Trend Graph: Business Data Chart Illustration. Bar chart illustration showing a descending trend. Four vertical bars in gradient hues of orange and blue decrease in height from left to right. A line graph with circles marks the top of each bar, emphasizing the downward trend. The design is simple and uses soft pastel colors, against a white background, highlighting the decreasing business data concept.
Free with trial Ai-Generated. Professional chart stock image featuring set of black and white minimalist chart and graph line icons. Decrease bar vectors Set of black and white minimalist chart and graph line icons
Free with trial Abstract illustration of business growth, featuring bar graphs and line graphs in shades of blue and grey. The image conveys concepts of data analysis, progress, and financial performance. Suitable for presentations, reports, and marketing materials related to business, finance, and technology. Decrease bar illustrations Abstract Business Growth Chart. Abstract illustration of business growth, featuring bar graphs and line graphs in shades of blue and grey. The image conveys concepts of data analysis, progress, and financial performance. Suitable for presentations, reports, and marketing materials related to business, finance, and technology.
Free with trial This vector illustration shows a set of black graph icons with rising and falling charts indicated by arrows showing trends in data with clear simple design and sharp edges calm. Generative AI. Decrease bar vectors Black graph icons set rising and falling charts with arrows vector illustration simple design. This vector illustration shows a set of black graph icons with rising and falling charts indicated by arrows showing trends in data with clear simple design and sharp edges calm. Generative AI
Free with trial A simple and clear black-and-white illustration of decreasing stacks of dollar coins, symbolizing loss, reduced income, or financial decline. Perfect for presentations, infographics, and finance apps. Decrease bar vectors Declining Revenue Icon Stacked Coin Chart. A simple and clear black-and-white illustration of decreasing stacks of dollar coins, symbolizing loss, reduced income, or financial decline. Perfect for presentations, infographics, and finance apps
Free with trial Green up and red down 3d arrow graph showing rising, descending trend, business result, profit or loss symbol symbol. Business arrow, goals concept. 3d world money symbols. Financial growth. Decrease bar illustrations Green up and red down 3d arrow graph showing rising, descending trend, business result, 3d world money symbols. Financial growth. Green up and red down 3d arrow graph showing rising, descending trend, business result, profit or loss symbol symbol. Business arrow, goals concept. 3d world money symbols. Financial growth
Free with trial Green up and red down 3d arrow graph showing rising, descending trend, business result, profit or loss symbol symbol. Business arrow, goals concept. 3d world money symbols. Financial growth. Decrease bar illustrations Green up and red down 3d arrow graph showing rising, descending trend, business result, 3d world money symbols. Financial growth. Green up and red down 3d arrow graph showing rising, descending trend, business result, profit or loss symbol symbol. Business arrow, goals concept. 3d world money symbols. Financial growth
Free with trial Green up and red down 3d arrow graph showing rising, descending trend, business result, profit or loss symbol symbol. Business arrow, goals concept. 3d world money symbols. Financial growth. Decrease bar illustrations Green up and red down 3d arrow graph showing rising, descending trend, business result, 3d world money symbols. Financial growth. Green up and red down 3d arrow graph showing rising, descending trend, business result, profit or loss symbol symbol. Business arrow, goals concept. 3d world money symbols. Financial growth
Free with trial Green up and red down 3d arrow graph showing rising, descending trend, business result, profit or loss symbol symbol. Business arrow, goals concept. 3d world money symbols. Financial growth. Decrease bar illustrations Green up and red down 3d arrow graph showing rising, descending trend, business result, 3d world money symbols. Financial growth. Green up and red down 3d arrow graph showing rising, descending trend, business result, profit or loss symbol symbol. Business arrow, goals concept. 3d world money symbols. Financial growth
Free with trial Green up and red down 3d arrow graph showing rising, descending trend, business result, profit or loss symbol symbol. Business arrow, goals concept. 3d world money symbols. Financial growth. Decrease bar illustrations Green up and red down 3d arrow graph showing rising, descending trend, business result, 3d world money symbols. Financial growth. Green up and red down 3d arrow graph showing rising, descending trend, business result, profit or loss symbol symbol. Business arrow, goals concept. 3d world money symbols. Financial growth
Free with trial Financial analysis scene showing colorful graphs and charts with a wooden block displaying a house icon and the year 2026, conveying real estate market growth and investment trends, ideal for finance and real estate marketing materials. Decrease bar illustrations Financial Growth Charts with Wooden House Block and Year 2026. Financial analysis scene showing colorful graphs and charts with a wooden block displaying a house icon and the year 2026, conveying real estate market growth and investment trends, ideal for finance and real estate marketing materials
Free with trial The background features blurred lights, creating a dramatic effect. financial markets. Decrease bar illustrations A red downward arrow symbolizes a decline in financial markets. The background features blurred lights, creating a dramatic effect. financial markets
Free with trial Graph line icon. Neumorphic, Flat shadow, 3d buttons. Column chart sign. Growth diagram symbol. Line graph chart icon. Social media icons. Vector. Decrease bar vectors Graph line icon. Column chart sign. Neumorphic buttons. Vector. Graph line icon. Neumorphic, Flat shadow, 3d buttons. Column chart sign. Growth diagram symbol. Line graph chart icon. Social media icons. Vector
Free with trial A black shopping basket icon displays various financial charts and graphs in blue and green, indicating business analytics. Decrease bar illustrations Shopping basket icon with financial charts and graphs on white background cart retail. A black shopping basket icon displays various financial charts and graphs in blue and green, indicating business analytics
Free with trial A visual representation of negative financial performance, illustrating a significant downward trend with a red arrow pointing downwards, indicating a loss or decline in value. Decrease bar illustrations Red graph showing a downward trend isolated on white background. A visual representation of negative financial performance, illustrating a significant downward trend with a red arrow pointing downwards, indicating a loss or decline in value
Free with trial Declining business graph chart showing downward trend in finances. Decrease bar vectors Declining business graph chart showing downward trend in finances
Free with trial A medium shot shows a person's hands cupped together, palms up. Hovering above the hands are two glowing neon outlines of arrows, one pointing down and the other pointing up. Both arrows contain a percentage symbol. A blurred background features faint digital data and bar graphs, suggesting a financial or economic context. The overall mood is abstract and conceptual. Decrease bar illustrations Hands holding glowing up and down percentage arrows. A medium shot shows a person's hands cupped together, palms up. Hovering above the hands are two glowing neon outlines of arrows, one pointing down and the other pointing up. Both arrows contain a percentage symbol. A blurred background features faint digital data and bar graphs, suggesting a financial or economic context. The overall mood is abstract and conceptual
Free with trial Financial crisis concept. Decreasing graph with falling columns. Vector illustration showing recession, bankruptcy, and economic decline. Decrease bar vectors Financial crisis concept. Decreasing graph with falling columns. Vector illustration showing recession, bankruptcy
Free with trial Businessman hand holding digital graph with cost reduction concept showing financial growth saving strategy economic efficiency and business success in modern finance. Decrease bar illustrations Businessman hand holding digital graph with cost reduction concept showing financial growth saving strategy economic efficiency
Free with trial This image features a bold 2. 29% percentage symbol in metallic blue on a black background, ideal for financial presentations and business reports. Decrease bar illustrations Metallic Blue Percentage Symbol 229 on Black Background for Financial and Business Concepts. This image features a bold 2.29% percentage symbol in metallic blue on a black background, ideal for financial presentations and business reports
Free with trial Economy growth arrow icons on white. Decrease bar illustrations Economy growth arrow icons
Free with trial Indicating negative trend red arrow slanting down on finance dashboard, with bars and data points. Financial, analytics, data visualization, technology, digital interface, dashboard, statistical. Decrease bar illustrations Indicating negative trend red arrow slanting down on finance dashboard, with bars and data points
Free with trial Graph line icon. Halftone dotted pattern. Gradient icon with grain shadow. Column chart sign. Ab test diagram symbol. Line graph chart icon. Various designs. Vector. Decrease bar vectors Graph line icon. Column chart sign. Halftone dotted pattern. Vector. Graph line icon. Halftone dotted pattern. Gradient icon with grain shadow. Column chart sign. Ab test diagram symbol. Line graph chart icon. Various designs. Vector
Free with trial Loss Graph Neon Sign. Vector Illustration of Analytics Data Symbol. Decrease bar vectors Loss Graph Neon Sign
Free with trial Line graph with a green line and a red dot on top. The red dot is located at the top left corner of the graph. Decrease bar illustrations Graph with a green line and a red dot
Free with trial A close-up view of four ice formations, resembling pillars or bars, arranged in descending order of height on a dark, textured surface, evoking a sense of cold and decline. Decrease bar illustrations Four ice pillars of varying heights stand on a dark, textured surface. A close-up view of four ice formations, resembling pillars or bars, arranged in descending order of height on a dark, textured surface, evoking a sense of cold and decline