Free with trial Downward arrow with decreasing bar graph alongside neutral, happy, and sad emotion faces. Ideal for emotional feedback, metrics, performance, business evaluation, impact loss failure. A simple flat. Decrease bar vectors Decline in Performance Represented by Downward Arrow, Graph Bars, and Varying Emotional Expressions. Downward arrow with decreasing bar graph alongside neutral, happy, and sad emotion faces. Ideal for emotional feedback, metrics, performance, business evaluation, impact loss failure. A simple flat
Free with trial Reduction chart icon Black line art vector in black and white outline set collection sign. Decrease bar vectors Decline Chart Icon Illustrating Decrease in Performance, Economic Downturn, and Analytical Data. Reduction chart icon Black line art vector in black and white outline set collection sign
Free with trial Decreasing bar graph with downward arrow icon representing financial loss, recession, and business failure. Decrease bar vectors Decreasing bar graph with downward arrow icon representing financial loss, recession, and business failure
Free with trial A small easel holds a drawing of a bar graph depicting a downward trend, symbolizing financial loss, economic recession, or a business downturn and market decrease. Decrease bar illustrations Miniature easel displays downturn graph showing financial decline trend business downturn. A small easel holds a drawing of a bar graph depicting a downward trend, symbolizing financial loss, economic recession, or a business downturn and market decrease
Free with trial Smartphone displaying decreasing bar graph with down arrow hand drawn illustration. Decrease bar vectors Smartphone displaying decreasing bar graph with down arrow hand drawn illustration
Free with trial Descending Bar Chart and Downward Arrow Signifying Business Loss and Economic Downturn. Decrease bar vectors Descending Bar Chart and Downward Arrow Signifying Business Loss and Economic Downturn
Free with trial A woman contemplates a declining bar graph, symbolizing business challenges and financial analysis. Decrease bar vectors Woman Analyzing Declining Bar Graph - Business and Finance Visualization Illustration. A woman contemplates a declining bar graph, symbolizing business challenges and financial analysis.
Free with trial A man in a blue suit holds a glowing blue bar graph showing increasing quality and decreasing cost with arrows and text. Decrease bar illustrations Businessman holding glowing bar graph showing cost reduction and quality increase. A man in a blue suit holds a glowing blue bar graph showing increasing quality and decreasing cost with arrows and text
Free with trial Visualize decreasing business performance with this striking image. A pink 3D bar chart graphically represents a decline in financial data, highlighting loss and reduction. The falling graph is juxtaposed with a healthy green plant in a pot, emphasizing the contrast between success and setbacks. Ideal for illustrating economic concepts, investment challenges, or business performance issues, Created AI. Decrease bar illustrations Decreasing business performance represented by pink graphic and potted green plant. Visualize decreasing business performance with this striking image. A pink 3D bar chart graphically represents a decline in financial data, highlighting loss and reduction. The falling graph is juxtaposed with a healthy green plant in a pot, emphasizing the contrast between success and setbacks. Ideal for illustrating economic concepts, investment challenges, or business performance issues, Created AI
Free with trial Doodle style illustration of a decreasing bar graph with a downward arrow, economy icon. Decrease bar vectors Doodle style illustration of a decreasing bar graph with a downward arrow, economy icon
Free with trial Purple graph with bar chart visually representing data analysis and growth ,Generative ai. Decrease bar illustrations Purple graph with bar chart, visual representation of data analysis, growth, and business trends. Purple graph with bar chart visually representing data analysis and growth ,Generative ai
Free with trial A 3D bar chart displays four bars in descending order of height: green, purple, blue, and pink, set against a white background. Clear details and vibrant colors enhance visual appeal. Decrease bar illustrations 3D Bar Chart With Green Purple Blue And Pink Bars In Descending Order graph decrease. A 3D bar chart displays four bars in descending order of height: green. A 3D bar chart displays four bars in descending order of height: green, purple, blue, and pink, set against a white background. Clear details and vibrant colors enhance visual appeal
Free with trial Declining graph showing a financial or business downturn, with bar chart and arrow down. Decrease bar vectors Declining graph showing a financial or business downturn, with bar chart and arrow down
Free with trial Bar Graph Illustration Showing Downward Trend Represented by Candles with Dripping Wax. Decrease bar vectors Bar Graph Illustration Showing Downward Trend Represented by Candles with Dripping Wax
Free with trial Hand drawn bar chart with declining arrow showing economic recession and financial loss. Decrease bar vectors Hand drawn bar chart with declining arrow showing economic recession and financial loss
Free with trial Close-up view of a computer monitor displaying a vibrant bar chart, indicating data analysis and progress tracking ,Generative ai. Decrease bar illustrations Computer monitor displaying a colorful bar chart for data analysis and progress tracking. Close-up view of a computer monitor displaying a vibrant bar chart, indicating data analysis and progress tracking ,Generative ai
Free with trial Red bar chart displays performance metrics on a table ,Generative ai. Decrease bar illustrations Red bar chart illustrating performance metrics on a table, data analysis and visualization. Red bar chart displays performance metrics on a table ,Generative ai
Free with trial Generative ai, The image is of a red bar graph and a red line graph. The line graph is going down, and the bar graph is going down. The image is set against a red background. The image is most likely representing a financial decline. It is a striki. Decrease bar illustrations A red bar graph and line graph displays a downward trend, with the bar graph decreasing in height and the line graph going down. generative ai, The image is of a red bar graph and a red line graph. The line graph is going down, and the bar graph is going down. The image is set against a red background. The image is most likely representing a financial decline. It is a striki
Free with trial This vibrant image showcases a collection of colorful 3D charts and graphs, including bar graphs, pie charts, and a line graph, all illustrating positive growth. A calculator and pencil are included, emphasizing the analytical and planning aspects of business success. Perfect for illustrating finan. Decrease bar illustrations Colorful 3D Financial Charts and Graphs with Calculator for Business Growth Presentation. This vibrant image showcases a collection of colorful 3D charts and graphs, including bar graphs, pie charts, and a line graph, all illustrating positive growth. A calculator and pencil are included, emphasizing the analytical and planning aspects of business success. Perfect for illustrating finan
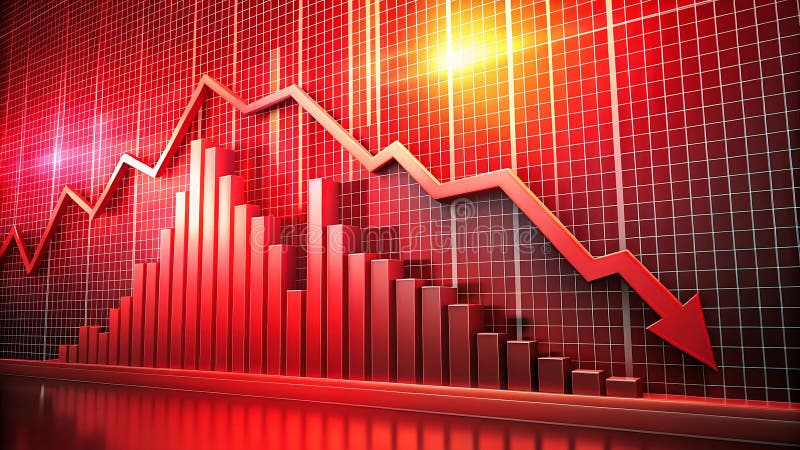
Free with trial This image features a red stock market decline chart with a dark background. It represents a financial crisis concept with a descending bar graph, indicating a negative trend in the market. The use of red highlights the severity of the decline and signals a potential risk in the investment landscape. Decrease bar illustrations Red Stock Market Decline Chart with Dark Background representing Financial Crisis Concept. This image features a red stock market decline chart with a dark background. It represents a financial crisis concept with a descending bar graph, indicating a negative trend in the market. The use of red highlights the severity of the decline and signals a potential risk in the investment landscape
Free with trial Business decline and financial crisis illustrated on a chalkboard, showing a downward trend. Hand drawing orange arrow over white bar chart on blue background with ample copy space. Ideal for economic reports, financial news, marketing, or presentations needing a negative trend. Decrease bar illustrations Business Decline Financial Chart Hand Drawing Chalkboard Recession Background Copy Space. Business decline and financial crisis illustrated on a chalkboard, showing a downward trend. Hand drawing orange arrow over white bar chart on blue background with ample copy space. Ideal for economic reports, financial news, marketing, or presentations needing a negative trend.
Free with trial A red bar graph with a downward-pointing arrow illustrates a decline. The graph, isolated on a white surface, suggests financial loss or economic downturn. It represents negative trends. Decrease bar illustrations Red bar graph with downward arrow isolated on white background. use cases: finance, economy. A red bar graph with a downward-pointing arrow illustrates a decline. The graph, isolated on a white surface, suggests financial loss or economic downturn. It represents negative trends
Free with trial A red bar graph with a descending arrow on a white plane. The graph shows a downward trend, visually representing loss or decline in areas such as finance, business, the economy, or the market. It is isolated on white. Decrease bar illustrations Red bar graph with arrow isolated on white background. use cases: finance, business, economy. A red bar graph with a descending arrow on a white plane. The graph shows a downward trend, visually representing loss or decline in areas such as finance, business, the economy, or the market. It is isolated on white
Free with trial Declining bar chart with arrow pointing down depicts business loss, failure, negative trends. Decrease bar vectors Declining bar chart with arrow pointing down depicts business loss, failure, negative trends
Free with trial This image depicts a stock market decline with a red bar chart against a dark background, illustrating a financial crisis concept. The chart shows a downward trend, indicating negative market performance. Decrease bar illustrations Red Stock Market Decline Chart Displaying Financial Crisis on Dark Background. This image depicts a stock market decline with a red bar chart against a dark background, illustrating a financial crisis concept. The chart shows a downward trend, indicating negative market performance
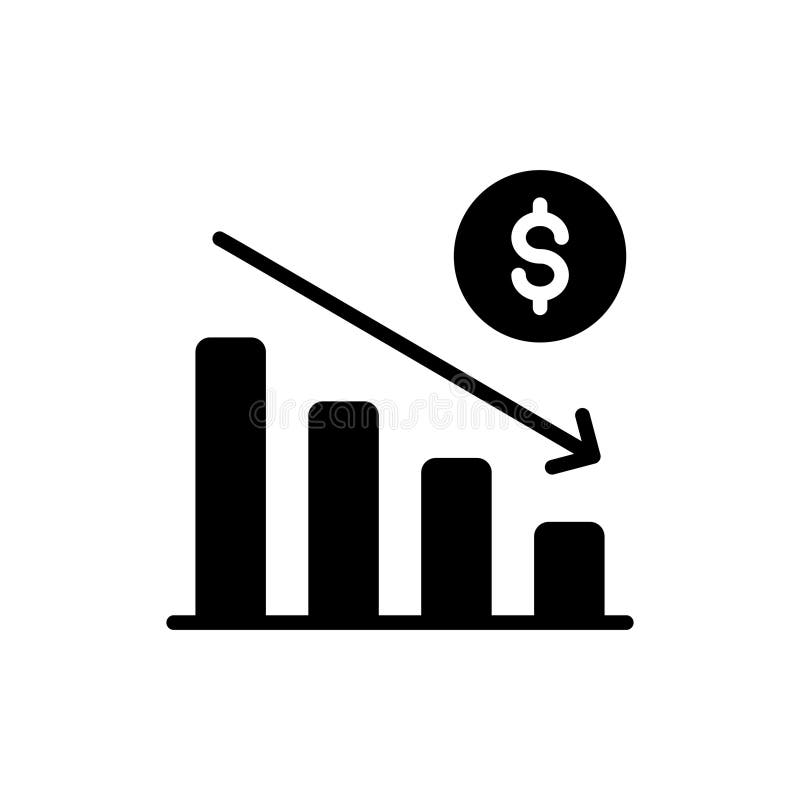
Free with trial Bar chart showing downward trend with dollar symbol. Decrease bar vectors Bar chart showing downward trend with dollar symbol
Free with trial Bar chart showing downward trend with dollar symbol. Decrease bar vectors Bar chart showing downward trend with dollar symbol
Free with trial Bar chart showing downward trend with dollar symbol. Decrease bar vectors Bar chart showing downward trend with dollar symbol
Free with trial Bar chart showing downward trend with dollar symbol. Decrease bar vectors Bar chart showing downward trend with dollar symbol
Free with trial Declining bar graph with a downward arrow symbolizing economic recession and financial loss. Decrease bar vectors Declining bar graph with a downward arrow symbolizing economic recession and financial loss
Free with trial Economic recession, business owner seated on a falling down bar graph and a red arrow. Decrease bar vectors Economic recession, business owner seated on a falling down bar graph and a red arrow
Free with trial Abstract digital illustration featuring blue and red bar charts and line graphs on a dark blue background. Orange and light blue points highlight data trends. The style is clean and modern. Decrease bar illustrations Abstract Financial Data Visualization Blue Red Charts Graphs Lines Points finance business. Abstract digital illustration featuring blue and red bar charts and line graphs on a dark blue background. Orange and light blue points highlight data trends. The style is clean and modern
Free with trial Financial Business Decline Chart illustrates economic recession, market downturn, or corporate loss. Hand-drawn orange downward trend on a dark blue chalkboard with white bar graph offers ample copy space. Perfect for financial reports, business presentations, news articles, and advertising campaigns. Decrease bar illustrations Financial Business Decline Chart Hand Drawing Downward Trend on Blue Background Copy Space. Financial Business Decline Chart illustrates economic recession, market downturn, or corporate loss. Hand-drawn orange downward trend on a dark blue chalkboard with white bar graph offers ample copy space. Perfect for financial reports, business presentations, news articles, and advertising campaigns.
Free with trial Declining bar chart with a downward arrow icon representing financial loss, crisis, and failure. Decrease bar vectors Declining bar chart with a downward arrow icon representing financial loss, crisis, and failure
Free with trial A red stock market chart declines sharply against a blurred dark city background. This image illustrates a financial crisis and economic downturn, showing a dramatic fall in market values. Decrease bar illustrations Red stock market crash with bar chart and blurred city background depicting financial decline. A red stock market chart declines sharply against a blurred dark city background. This image illustrates a financial crisis and economic downturn, showing a dramatic fall in market values
Free with trial A 3D bar graph with light blue bars of decreasing height, indicating a downward trend. A bright yellow arrow points downwards, crossing over the bars, symbolizing financial decline or economic recession. The background is a soft, muted pink. Decrease bar illustrations Downward Trend Graph with Falling Arrow Illustrating Financial Decline or Economic Recession. A 3D bar graph with light blue bars of decreasing height, indicating a downward trend. A bright yellow arrow points downwards, crossing over the bars, symbolizing financial decline or economic recession. The background is a soft, muted pink
Free with trial Germany map and EU design, bar-chart downtrend as black dark crisis of the economy or stock market and business, EU Europe background creative. Decrease bar illustrations Germany map and EU design, bar-chart downtrend as black dark crisis of the economy or stock market and business, EU Europe
Free with trial Bar graph with circles and lines darker flat icons on color round background. Decrease bar vectors Bar graph with circles and lines color darker flat icons. Bar graph with circles and lines darker flat icons on color round background
Free with trial Colorful bar graph showing data and trends, perfect for business, finance, or analytics presentations. EPS 10. Decrease bar vectors Colorful bar graph showing data and trends, perfect for business, finance, or analytics presentations.
Free with trial Declining bar chart with downward arrow graphic representing economic downturn and financial loss. Decrease bar vectors Declining bar chart with downward arrow graphic representing economic downturn and financial loss
Free with trial Doodle Art of Declining Bar Chart with Arrow Vector Illustration Concept Showing Financial Crisis. Decrease bar vectors Doodle Art of Declining Bar Chart with Arrow Vector Illustration Concept Showing Financial Crisis
Free with trial Stock market trading technical analysis bar chart fall. Business candlestick graph exchange down trend. Crisis economy and investment loss graph. Trader financial index crash concept. Eps banner. Decrease bar vectors Stock market trading technical analysis bar chart fall. Business candlestick graph exchange down trend. Crisis economy
Free with trial Stock market trading technical analysis bar chart fall. Business candlestick graph exchange down trend. Crisis economy and investment loss graph. Trader financial index crash concept. Black background. Decrease bar vectors Stock market trading technical analysis bar chart fall. Business candlestick graph exchange down trend. Crisis economy
Free with trial Stock market trading technical analysis bar chart fall. Business candlestick graph exchange down trend. Crisis economy and investment loss graph. Trader financial index crash concept. Money losing eps. Decrease bar vectors Stock market trading technical analysis bar chart fall. Business candlestick graph exchange down trend. Crisis economy
Free with trial Red arrow pointing downward represents a financial downturn and economic loss against a backdrop of bar graphs indicating market decline and potential investment risks suggesting a challenging econom. Decrease bar illustrations Red downward trend arrow illustrates financial loss and market decline on a bar graph background. Red arrow pointing downward represents a financial downturn and economic loss against a backdrop of bar graphs indicating market decline and potential investment risks suggesting a challenging econom
Free with trial Smartphone displaying a falling bar chart icon, economic recession or financial crisis illustration. Decrease bar vectors Smartphone displaying a falling bar chart icon, economic recession or financial crisis illustration
Free with trial A vibrant bar graph illustrates a market downturn, symbolizing economic trends, financial instability, risk assessment, and potential recovery. It uses a rainbow color scheme for visual impact. Ideal for promoting your services or creating eye-catching visuals. Open area for featuring your products, copy space, banner, advertisement. . Generative AI. Decrease bar illustrations Colorful Bar Graph Showing Market Decline A vibrant bar graph illustrates a market downturn symbolizing economic trends. A vibrant bar graph illustrates a market downturn, symbolizing economic trends, financial instability, risk assessment, and potential recovery. It uses a rainbow color scheme for visual impact. Ideal for promoting your services or creating eye-catching visuals. Open area for featuring your products, copy space, banner, advertisement. . Generative AI
Free with trial Business bar graph with decreasing bars and a downward arrow representing economic loss and market fall. Decrease bar vectors Business bar graph with decreasing bars and a downward arrow representing economic loss and market fall
Free with trial Stock market trading technical analysis bar chart fall. Business exchange graph downtrend. Crisis economy and investment loss graph. Trader financial index crash concept. Eps banner dark background. Decrease bar vectors Stock market trading technical analysis bar chart fall. Business exchange graph downtrend. Crisis economy and investment
Free with trial Magnifying glass over bar graph, symbolizes research, analysis, insights, growth, and strategy. Can be used for display or montage your products. Empty Space for display your products, copy space ,banner, advertising. Generative AI. Decrease bar illustrations Data Analysis and Market Research Magnifying glass over bar graph symbolizes research analysis insights growth and strategy. Magnifying glass over bar graph, symbolizes research, analysis, insights, growth, and strategy. Can be used for display or montage your products. Empty Space for display your products, copy space ,banner, advertising. Generative AI
Free with trial Declining red arrow and bar graph against a matching backdrop visually represent a significant economic downturn and financial market losses indicating potential business risks and investment failure. Decrease bar illustrations Red downward trend line and bar graph illustrate economic decline and financial market downturn effect. Declining red arrow and bar graph against a matching backdrop visually represent a significant economic downturn and financial market losses indicating potential business risks and investment failure
Free with trial Domino effect concept icon showing a declining bar chart representing financial crisis and recession. Decrease bar vectors Domino effect concept icon showing a declining bar chart representing financial crisis and recession
Free with trial Hand Drawn Bar Graph Chart with Downward Trend Arrow Representing Economic Decline and Business Loss. Decrease bar vectors Hand Drawn Bar Graph Chart with Downward Trend Arrow Representing Economic Decline and Business Loss
Free with trial Bar chart with arrow pointing down, illustrating economic decline, business loss, or negative trend data. Decrease bar vectors Bar chart with arrow pointing down, illustrating economic decline, business loss, or negative trend data
Free with trial The image depicts a business professional in a suit interacting with a transparent digital chart displaying a declining trend in business performance. The visualization includes green bar charts and a line graph, complemented by a prominent downward arrow and percentage symbol indicating a decrease. This modern digital interface symbolizes data-driven decision-making, financial analysis, and real-time monitoring of business metrics for strategic planning. Decrease bar illustrations Business Performance Decline Visualization with Interactive Data Analytics and Percentage Drop Indicator. The image depicts a business professional in a suit interacting with a transparent digital chart displaying a declining trend in business performance. The visualization includes green bar charts and a line graph, complemented by a prominent downward arrow and percentage symbol indicating a decrease. This modern digital interface symbolizes data-driven decision-making, financial analysis, and real-time monitoring of business metrics for strategic planning.
Free with trial Profit growing and decrease sumbol. Statistic up and down arrows. Business growths chart. Green and red arrow - stock vector. Decrease bar illustrations Profit growing and decrease sumbol. Statistic up and down arrows. Business growths chart. Green and red arrow - stock vector
Free with trial Dark blue background as EU European Union, Europe, silhouette outline map of Germany and increasing rising uptrend bar-chart as economy and industry success. Decrease bar illustrations Dark blue background as EU European Union, Europe, silhouette outline map of Germany and increasing rising uptrend bar-chart as
Free with trial A red bar chart against a dark background showing a significant stock market decline. The image suggests financial crisis, risk, and economic downturn, suitable for business and financial related content. Decrease bar illustrations Red Stock Market Chart Plunging During Financial Crisis with dark background illustrating sharp decline. A red bar chart against a dark background showing a significant stock market decline. The image suggests financial crisis, risk, and economic downturn, suitable for business and financial related content
Free with trial Sketch of a decreasing bar graph showing negative business trend with a downward arrow, decline illustration. Decrease bar vectors Sketch of a decreasing bar graph showing negative business trend with a downward arrow, decline illustration
Free with trial A stark red arrow points downwards, dramatically descending across a series of stacked white bars that resemble coins or financial data points. The bars decrease in height from left to right, visually representing a significant decline or loss. The composition is clean and isolated on a white background, emphasizing the concept of financial downturn or economic recession. Decrease bar illustrations Red Downward Arrow Graph with Stacked White Coin- Like Bars Illustrating Financial Decline on White Background. A stark red arrow points downwards, dramatically descending across a series of stacked white bars that resemble coins or financial data points. The bars decrease in height from left to right, visually representing a significant decline or loss. The composition is clean and isolated on a white background, emphasizing the concept of financial downturn or economic recession
Free with trial A red fuel pump nozzle points downward like a falling arrow, superimposed over a colorful bar graph and a declining line graph, symbolizing decreasing fuel prices isolated on a white surface. Decrease bar illustrations Fuel price decrease concept isolated on white background. for economy and finance use cases. A red fuel pump nozzle points downward like a falling arrow, superimposed over a colorful bar graph and a declining line graph, symbolizing decreasing fuel prices isolated on a white surface
Free with trial A grid of 28 simple black line art icons on a white background depicting various financial charts graphs and business related symbols including bar charts pie charts computers and money. Decrease bar vectors Collection of 28 minimalist line art icons representing financial data charts and business concepts graph. A grid of 28 simple black line art icons on a white background depicting various financial charts graphs and business related symbols including bar charts pie charts computers and money
Free with trial Hand drawn declining bar graph with a downward arrow illustrating a financial recession and business failure. Decrease bar vectors Hand drawn declining bar graph with a downward arrow illustrating a financial recession and business failure
Free with trial Set line Browser window Server Data Cloud upload Search engine Graph chart infographic and Financial growth decrease icon. Vector. Decrease bar vectors Set line Browser window, Server, Data, Cloud upload, Search engine, Graph chart infographic and Financial growth. Set line Browser window Server Data Cloud upload Search engine Graph chart infographic and Financial growth decrease icon. Vector.
Free with trial Digital tablet displaying a downward trending bar chart and arrow icon symbolizing financial loss or decline. Decrease bar vectors Digital tablet displaying a downward trending bar chart and arrow icon symbolizing financial loss or decline
Free with trial A 3D render of a business chart illustrating a financial decline with a visual representation of falling data, presented on an artist's easel. Concept for economic downturn. Decrease bar vectors 3d business graph showing a downward trend with bar chart and line on an easel stand transparent background. A 3D render of a business chart illustrating a financial decline with a visual representation of falling data, presented on an artist's easel. Concept for economic downturn
Free with trial Hand drawn bar graph showing a downward trend with a sale tag for discounts price reductions and market decline. Decrease bar vectors Hand drawn bar graph showing a downward trend with a sale tag for discounts price reductions and market decline
Free with trial A red bar chart showing a significant decline in the stock market. The graph is set against a dark background, emphasizing the concept of financial crisis. The sharp decline and red color convey a sense of loss and market instability. Decrease bar illustrations Red Stock Market Decline with Bar Chart on Dark Background Financial Crisis Concept. A red bar chart showing a significant decline in the stock market. The graph is set against a dark background, emphasizing the concept of financial crisis. The sharp decline and red color convey a sense of loss and market instability
Free with trial Financial chart graphic with coins, blue bar graph, blurred orange line chart. Business profit, income growth, investment, financial analysis, marketing, economic saving money concept. Decrease bar illustrations Financial chart graphic with coins, blue bar graph, blurred orange line chart. Business profit, income growth, investment
Free with trial A gleaming gold coin with a ridged edge is depicted against a clean white background. The coin's face features a black circular inset containing a golden bar chart with bars decreasing in height from left to right, accompanied by a downward-pointing arrow. This visual represents financial decline or economic loss. Decrease bar illustrations Gold Coin with Black Circle Featuring a Downward Trending Bar Chart and Arrow Keywords: coin, gold, money, finance, business. A gleaming gold coin with a ridged edge is depicted against a clean white background. The coin's face features a black circular inset containing a golden bar chart with bars decreasing in height from left to right, accompanied by a downward-pointing arrow. This visual represents financial decline or economic loss
Free with trial Up and Down sign with green and red arrows vector illustration. Concept of sales bar chart symbol icon with arrow moving down and sales bar chart with arrow moving up. Decrease bar vectors Up and Down sign with green and red arrows vector illustration. Concept of sales bar chart symbol icon
Free with trial Digital tablet icon displaying a bar chart with a downward trend arrow and percentage sign, indicating decline or loss. Decrease bar vectors Digital tablet icon displaying a bar chart with a downward trend arrow and percentage sign, indicating decline or loss
Free with trial Visual representation of a declining real estate market using a bar chart with houses perched atop each descending bar suggesting a downward trend in property values or sales. Decrease bar illustrations Real estate market decline represented by descending bars with miniature houses conceptualizing financial downturn. Visual representation of a declining real estate market using a bar chart with houses perched atop each descending bar suggesting a downward trend in property values or sales
Free with trial Uptrend or downtrend set on a dark grey to black minimalist studio background, represented by an upward scrolling white columnar bar chart. 3D render visualizing market trend or challenging business. Decrease bar illustrations Uptrend or downtrend set on a dark grey to black minimalist studio background, represented by an upward scrolling white columnar
Free with trial Businessman faces red bar graph wall. Economic challenges, financial crisis, market downturn concept. Man in suit, business, finance, data, investment, business strategy risk. Decrease bar illustrations Businessman faces red bar graph wall. Economic challenges, financial crisis, market downturn concept. Man in suit, business
Free with trial Hand Drawn Bar Chart Depicting Downward Trend with Arrow Symbolizing Declining Sales or Profits on a White Background. Decrease bar vectors Hand Drawn Bar Chart Depicting Downward Trend with Arrow Symbolizing Declining Sales or Profits on a White Background
Free with trial Bar graph showing GDP growth and decline, with flag icons representing countries. Generative Ai. Decrease bar illustrations Bar graph showing GDP growth and decline, with flag icons representing countries
Free with trial Loss icon logo sign vector outline in black and white color. Decrease bar vectors A bar chart icon with a downward trend, representing financial loss or decrease, often used in business or stock market contexts. loss icon logo sign vector outline in black and white color
Free with trial Bar graph illustrates GDP growth and decline, marked by country flags for comparison. Generative Ai. Decrease bar illustrations Bar graph illustrates GDP growth and decline, marked by country flags for comparison
Free with trial Graph or block diagram shows the increase or decrease of shares, which means financial loss or gain -. Decrease bar illustrations Graph or block diagram shows the increase or decrease of shares, which means financial loss or gain