Free with trial A fuel pump nozzle is positioned over a declining bar graph with a red arrow indicating a downward trend. This symbolizes decreasing gas prices and the impact on the economy and financial markets. Isolated on white. Decrease bar illustrations Fuel pump over graph isolated on white background. concept for gas price decrease, economy, finance, and business use cases. A fuel pump nozzle is positioned over a declining bar graph with a red arrow indicating a downward trend. This symbolizes decreasing gas prices and the impact on the economy and financial markets. Isolated on white
Free with trial A striking 3D visualization features a formation of polished black cubes descending like a minimalist bar chart indicating decline. Rendered by Ai this abstract geometric composition stands dramatically against a deep matte black background. The stark contrast and high gloss finish emphasize concepts of data analysis business loss or mathematical patterns. Decrease bar illustrations Abstract dark graph of descending glossy cubes. A striking 3D visualization features a formation of polished black cubes descending like a minimalist bar chart indicating decline. Rendered by Ai this abstract geometric composition stands dramatically against a deep matte black background. The stark contrast and high gloss finish emphasize concepts of data analysis business loss or mathematical patterns
Free with trial Graph line icon. Continuous line big heart. Column chart sign. Growth diagram symbol. 3d hearts in heart shaped loop. Graph chart single line ribbon. Loop curve pattern. Vector. Decrease bar vectors Graph line icon. Column chart sign. Continuous line big heart. Vector. Graph line icon. Continuous line big heart. Column chart sign. Growth diagram symbol. 3d hearts in heart shaped loop. Graph chart single line ribbon. Loop curve pattern. Vector
Free with trial Watercolor illustration of business growth. Orange bar, pie charts on aged paper show data analysis, market trends, financial progress. Visuals represent success, planning strategic. Decrease bar illustrations Watercolor illustration of business growth. Orange bar, pie charts on aged paper show data analysis, market trends, financial
Free with trial Close up view of red falling bar chart with laptop and potted plant in background. It represents financial crisis downturn risk and business failure in market. Investment analytics. Decrease bar illustrations Close up view of red falling bar chart with laptop and potted plant in background. It represents financial crisis downturn risk
Free with trial Business financial decline chart showing significant loss. Hand draws a downward orange arrow on a dark blue chalkboard with ample copy space. Ideal for economic analysis, corporate presentations, and marketing materials. Decrease bar illustrations Business Financial Decline Chart. Hand drawing bar graph with downward orange arrow on blue chalkboard background, copy space. Business financial decline chart showing significant loss. Hand draws a downward orange arrow on a dark blue chalkboard with ample copy space. Ideal for economic analysis, corporate presentations, and marketing materials.
Free with trial The image features a recycling symbol with various natural scenes such as forests, rivers, and mountains inside its segments. Accompanying the recycling symbol are two bar graphs. The first graph illustrates the reduction in carbon emissions over several years, showing a significant decrease from 70% in 1990 to 30% in 2020. The second graph depicts the increase in recycled materials over the same. Decrease bar illustrations Environmental impact of recycling. The image features a recycling symbol with various natural scenes such as forests, rivers, and mountains inside its segments. Accompanying the recycling symbol are two bar graphs. The first graph illustrates the reduction in carbon emissions over several years, showing a significant decrease from 70% in 1990 to 30% in 2020. The second graph depicts the increase in recycled materials over the same
Free with trial The image depicts a 3D bar graph showing a decreasing trend over a period of years. The y-axis represents values ranging from 0 to 100,000, while the x-axis represents years from 2000 to 2025. The bars start high in 2000 and gradually decrease, indicating a downward trend. An arrow at the end of the curve suggests a continuing decline. Decrease bar illustrations Decreasing trend over time. The image depicts a 3D bar graph showing a decreasing trend over a period of years. The y-axis represents values ranging from 0 to 100,000, while the x-axis represents years from 2000 to 2025. The bars start high in 2000 and gradually decrease, indicating a downward trend. An arrow at the end of the curve suggests a continuing decline
Free with trial Chat arrow down icon Vector set on white background. EPS 10. Decrease bar vectors Chart arrow down icon set. decline downward chart vector symbol. stock trend downturn graph sign. negative economy bar Chart. Chat arrow down icon Vector set on white background. EPS 10
Free with trial Chat arrow down icon Vector set on white background. EPS 10. Decrease bar vectors Chart arrow down icon set. decline downward chart vector symbol. stock trend downturn graph sign. negative economy bar Chart. Chat arrow down icon Vector set on white background. EPS 10
Free with trial Chat arrow down icon Vector set on white background. EPS 10. Decrease bar vectors Chart arrow down icon set. decline downward chart vector symbol. stock trend downturn graph sign. negative economy bar Chart. Chat arrow down icon Vector set on white background. EPS 10
Free with trial Chat arrow down icon Vector set on white background. EPS 10. Decrease bar vectors Chart arrow down icon set. decline downward chart vector symbol. stock trend downturn graph sign. negative economy bar Chart. Chat arrow down icon Vector set on white background. EPS 10
Free with trial The image displays a bar chart representing yearly data spanning from 2011 to 2021. The bars are colored in blue, with a notable decrease in bar height in 2020, followed by a large increase in 2021. The chart includes a Y-axis with numerical values, though specific labels are not clearly visible. The bars on the right side of the chart have color-coded sections in green, orange, and yellow,. Decrease bar illustrations Bar chart showing yearly data from 2011 to 2021 with a significant drop in 2020. The image displays a bar chart representing yearly data spanning from 2011 to 2021. The bars are colored in blue, with a notable decrease in bar height in 2020, followed by a large increase in 2021. The chart includes a Y-axis with numerical values, though specific labels are not clearly visible. The bars on the right side of the chart have color-coded sections in green, orange, and yellow,
Free with trial Charts and diagrams icon collection. Duotone color. Vector illustration. Containing graphic, infographic, graph, pie chart, graphs, bar chart, circular diagram, diagram, decrease, increase, with three design. Decrease bar vectors Economics strategy, analysis of sales, statistic, data statistic illustration set or collection for banner, landing web page. Charts and diagrams icon collection. Duotone color. Vector illustration. Containing graphic, infographic, graph, pie chart, graphs, bar chart, circular diagram, diagram, decrease, increase, with three design
Free with trial Charts and diagrams icon collection. Duotone color. Vector illustration. Containing graphic, infographic, graph, pie chart, graphs, bar chart, circular diagram, diagram, decrease, increase, with three design. Decrease bar vectors Economics strategy, analysis of sales, statistic, data statistic illustration set or collection for banner, landing web page. Charts and diagrams icon collection. Duotone color. Vector illustration. Containing graphic, infographic, graph, pie chart, graphs, bar chart, circular diagram, diagram, decrease, increase, with three design
Free with trial Charts and diagrams icon collection. Duotone color. Vector illustration. Containing graphic, infographic, graph, pie chart, graphs, bar chart, circular diagram, diagram, decrease, increase, with three design. Decrease bar vectors Economics strategy, analysis of sales, statistic, data statistic illustration set or collection for banner, landing web page. Charts and diagrams icon collection. Duotone color. Vector illustration. Containing graphic, infographic, graph, pie chart, graphs, bar chart, circular diagram, diagram, decrease, increase, with three design
Free with trial Charts and diagrams icon collection. Duotone color. Vector illustration. Containing graphic, infographic, graph, pie chart, graphs, bar chart, circular diagram, diagram, decrease, increase, with three design. Decrease bar vectors Economics strategy, analysis of sales, statistic, data statistic illustration set or collection for banner, landing web page. Charts and diagrams icon collection. Duotone color. Vector illustration. Containing graphic, infographic, graph, pie chart, graphs, bar chart, circular diagram, diagram, decrease, increase, with three design
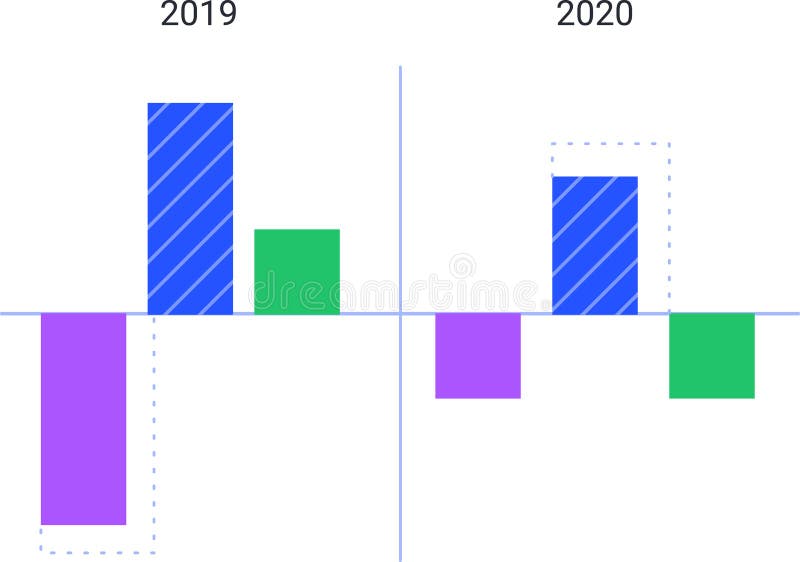
Free with trial Colorful bar charts are comparing data from 2019 and 2020, visualizing trends and statistics with positive and negative values represented by upward and downward bars. Decrease bar vectors Colorful bar charts are comparing data from 2019 and 2020, visualizing trends and statistics with positive and negative
Free with trial Colorful bar charts are comparing data from 2019 and 2020, visualizing trends and statistics with positive and negative values represented by upward and downward bars. Decrease bar illustrations Colorful bar charts are comparing data from 2019 and 2020, visualizing trends and statistics with positive and negative
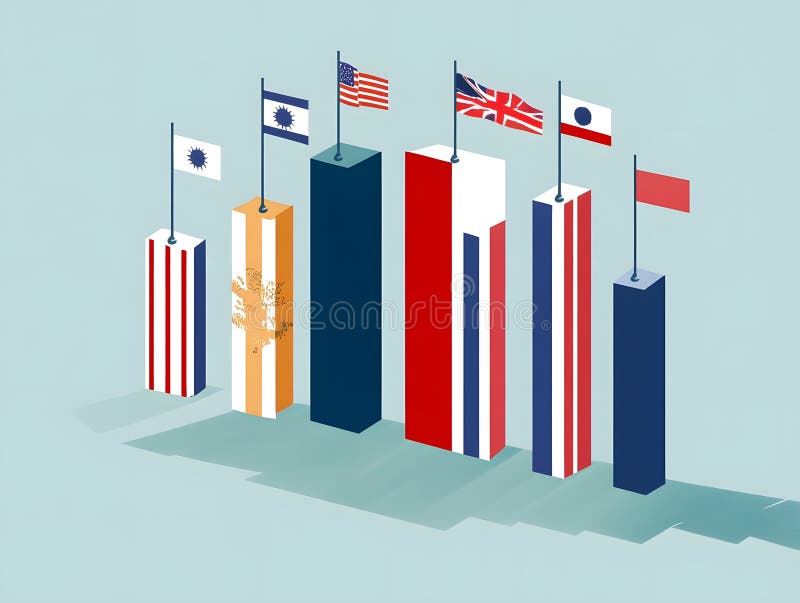
Free with trial Job ID: fba8760d-e973-412d-9011-a0e8d72a93ed. Decrease bar illustrations Colorful Bar Graph with Flags: Abstract Representation of Data and Trends. Job ID: fba8760d-e973-412d-9011-a0e8d72a93ed
Free with trial Bar graph showing GDP growth and decline, with flag icons representing countries. Generative Ai. Decrease bar illustrations Bar graph showing GDP growth and decline, with flag icons representing countries
Free with trial Bar graph illustrates GDP growth and decline, marked by country flags for comparison. Generative Ai. Decrease bar illustrations Bar graph illustrates GDP growth and decline, marked by country flags for comparison
Free with trial Boyle gas law, linking volume and pressure. Digital illustration, 3D render. Decrease bar illustrations Boyle gas law
Free with trial Three 1000 gram 999. 9 fine gold bars isolated on black background, representing wealth, investment, and financial security. Decrease bar illustrations Gold bars isolated on black background. Three 1000 gram 999.9 fine gold bars isolated on black background, representing wealth, investment, and financial security.
Free with trial Three 1000 gram 999. 9 fine gold bars isolated on white background, representing wealth, investment, and financial security. Decrease bar illustrations Three gold bars isolated on white background. Three 1000 gram 999.9 fine gold bars isolated on white background, representing wealth, investment, and financial security.
Free with trial Gold bullion placed on a financial stock market chart background, representing investment, wealth, and market trends in the global economy. Decrease bar illustrations Gold bullion with financial chart, investment concept. Gold bullion placed on a financial stock market chart background, representing investment, wealth, and market trends in the global economy.
Free with trial Concept of chain reaction and financial instability with falling gold bars arranged like dominoes on a black background. Decrease bar illustrations Falling gold bars in a domino row on a black background. Concept of chain reaction and financial instability with falling gold bars arranged like dominoes on a black background.
Free with trial Concept of chain reaction and financial instability with falling gold bars arranged like dominoes on a black background. Decrease bar illustrations Falling gold bars in a domino row on a black background. Concept of chain reaction and financial instability with falling gold bars arranged like dominoes on a black background.
Free with trial Concept of chain reaction and financial instability with falling gold bars arranged like dominoes on a black background. Decrease bar illustrations Domino effect with falling gold bars on black background. Concept of chain reaction and financial instability with falling gold bars arranged like dominoes on a black background.
Free with trial Concept of chain reaction and financial instability with falling gold bars arranged like dominoes on a white background. Decrease bar illustrations Domino effect with falling gold bars on white background. Concept of chain reaction and financial instability with falling gold bars arranged like dominoes on a white background.
Free with trial 3d modelled gold bars with arrows pointing upward. Decrease bar illustrations Gold bars with rising financial chart on black background. 3d modelled gold bars with arrows pointing upward.
Free with trial 3d modelled gold bars with green arrow pointing upward. Decrease bar illustrations Gold bars with rising financial chart on black background. 3d modelled gold bars with green arrow pointing upward.
Free with trial 3d modelled gold bars with arrows pointing downward. Decrease bar illustrations Descending gold market graph with gold bullion on a dark background. 3d modelled gold bars with arrows pointing downward.
Free with trial Gold bars with red downward financial graph. Concept of falling gold market price, economic crisis, and investment loss, vector illustration eps10. Decrease bar vectors Gold bars with red downward financial graph. Concept of falling gold market price, economic crisis, and investment loss
Free with trial Gold bars with red downward financial graph and arrows. Concept of falling gold market price, economic crisis, and investment loss, vector illustration eps10. Decrease bar vectors Gold bars with red downward financial graph and arrows. Concept of falling gold market price, economic crisis, and investment loss
Free with trial Finance, analytics and market trends. Falling bar chart and line graph showing volatility and decline. Ideal for economic reports and trading visuals. Modern blue gradient vector illustration. Decrease bar vectors Financial declining chart with bars and line graph, stock market analytics vector. Finance, analytics and market trends. Falling bar chart and line graph showing volatility and decline. Ideal for economic reports and trading visuals. Modern blue gradient vector illustration.
Free with trial A cartoon illustration showing Smartphone Battery with Arrow Up Down Performance. Decrease bar vectors Smartphone Battery Arrow Up Down Performance. A cartoon illustration showing Smartphone Battery with Arrow Up Down Performance
Free with trial 3D stock chart. Invest trade market. Forex candlestick graph of economy data exchange. Digital business technology. Investment infographic render arrow buttons. Profit rate motion. Vector background. Decrease bar vectors 3D stock chart. Invest trade market. Forex candlestick graph of economy data exchange. Business technology. Investment infographic. 3D stock chart. Invest trade market. Forex candlestick graph of economy data exchange. Digital business technology. Investment infographic render arrow buttons. Profit rate motion. Vector background
Free with trial Outline down chart icon isolated. Flat style design vector illustration on white background. Decrease bar vectors Outline down chart icon isolated. Flat style design vector illustration on white background
Free with trial Business graph showing falling trend with arrow for recession and financial loss. Decrease bar vectors Business crisis chart with falling arrow. Business graph showing falling trend with arrow for recession and financial loss
Free with trial Financial chart with bull vs bear in stock market on green color background. Decrease bar illustrations Print financial chart with bull vs bear in stock market. financial chart with bull vs bear in stock market on green color background
Free with trial Continuous one line art down graph chart icon flat style design isolated vector illustration on white background. Decrease bar vectors Continuous one line art down graph chart icon flat style
Free with trial Down graph chart icon in trendy flat style design isolated vector illustration on white background. Decrease bar vectors Down graph chart icon in trendy flat style design isolated
Free with trial A 3D human character pushes against a collapsing red bar chart with a downward arrow, a business conception of preventing financial loss and crisis. Decrease bar illustrations 3D Human Character Trying to Stop a Falling Red Business Graph. A 3D human character pushes against a collapsing red bar chart with a downward arrow, a business conception of preventing financial loss and crisis
Free with trial Financial chart with bull and bear in stock market on red and green color background. Decrease bar illustrations Financial chart with bull and bear in stock market on red and green color background
Free with trial A sad 3D person stands before a downward-trending red arrow and bar chart, a business conception of financial crisis, failure, and economic recession. Decrease bar illustrations Sad 3D Human Character with a Falling Business Graph in the Background. A sad 3D person stands before a downward-trending red arrow and bar chart, a business conception of financial crisis, failure, and economic recession
Free with trial Financial chart with bull and bear in stock market on red and green color. Decrease bar illustrations Financial chart with bull and bear in stock market on red and green color
Free with trial Business recession diagram with falling bars and downward arrow indicating economic decline and bankruptcy. Decrease bar vectors Economic crisis concept illustration with negative trend graph and bankruptcy symbol. Business recession diagram with falling bars and downward arrow indicating economic decline and bankruptcy
Free with trial Financial chart with bull and bear in stock market on blue color background. Decrease bar illustrations Financial chart with bull and bear in stock market on blue color background
Free with trial Financial chart with bull and bear in stock market on blue color background. Decrease bar illustrations Financial chart with bull and bear in stock market on blue color background
Free with trial A minimalist black and white icon representing documents with an upward and downward arrow. This graphic symbolizes concepts like report generation, data analysis, growth, decline, upload, download, information flow, and business metrics. It's ideal for presentations, websites, and applications related to finance, business, technology, and data management. Decrease bar vectors Document Growth and Data Flow Icon. A minimalist black and white icon representing documents with an upward and downward arrow. This graphic symbolizes concepts like report generation, data analysis, growth, decline, upload, download, information flow, and business metrics. It's ideal for presentations, websites, and applications related to finance, business, technology, and data management.
Free with trial A clean, minimalist icon representing an analytics graph. It features a series of vertical bars of varying heights, symbolizing data or trends. A line graph with circular data points connects the tops of some of the bars, illustrating growth, progress, or fluctuations over time. This graphic is ideal for representing business intelligence, financial data, research, or any concept related to data analysis and performance. Decrease bar vectors Analytics Graph Icon with Data Points. A clean, minimalist icon representing an analytics graph. It features a series of vertical bars of varying heights, symbolizing data or trends. A line graph with circular data points connects the tops of some of the bars, illustrating growth, progress, or fluctuations over time. This graphic is ideal for representing business intelligence, financial data, research, or any concept related to data analysis and performance.
Free with trial Business Icons Set isolated on black background. Simple vector logo. Decrease bar vectors Business Icons Set isolated on black background
Free with trial A striking 3D representation of the Bitcoin symbol in red, superimposed against a background of dynamic financial charts, including bar graphs and a red interconnected network structure. This visualization captures the volatility and global connectivity inherent in cryptocurrency markets and trading. The high-contrast design emphasizes digital finance and blockchain concepts. Rendered by Ai. Decrease bar illustrations Bitcoin Symbol and Abstract Trading Market Data. A striking 3D representation of the Bitcoin symbol in red, superimposed against a background of dynamic financial charts, including bar graphs and a red interconnected network structure. This visualization captures the volatility and global connectivity inherent in cryptocurrency markets and trading. The high-contrast design emphasizes digital finance and blockchain concepts. Rendered by Ai
Free with trial An adorable, plump orange tabby cat dressed in a blue collar and tie stands beside a presentation screen. The screen displays a bar graph and a line graph indicating a downward financial trend, with a prominent '-25%' marker. To the left, an office desk with a laptop and an ergonomic chair suggest a business or work environment. This whimsical illustration is perfect for conveying concepts related to financial performance, business analysis, or even humorous takes on economic downturns. Decrease bar illustrations Cartoon Cat Presenting Financial Report with Downward Trend. An adorable, plump orange tabby cat dressed in a blue collar and tie stands beside a presentation screen. The screen displays a bar graph and a line graph indicating a downward financial trend, with a prominent '-25%' marker. To the left, an office desk with a laptop and an ergonomic chair suggest a business or work environment. This whimsical illustration is perfect for conveying concepts related to financial performance, business analysis, or even humorous takes on economic downturns.
Free with trial Illustration of a business activities. Decrease bar vectors Illustration of a business activities
Free with trial Futuristic Declining Bar Graph with Downward Arrow on Dark Blue Background, Business Loss and Negative Growth Concept. Decrease bar vectors Business Loss and Negative Growth Concept
Free with trial Funny pizza slice cartoon character presenting a sales report bar graph. This vector illustration is perfect for business analysis, food industry, and creative presentations about market trends. Decrease bar illustrations Pizza Sales Report Cartoon Icon, Business Analysis Concept. Funny pizza slice cartoon character presenting a sales report bar graph. This vector illustration is perfect for business analysis, food industry, and creative presentations about market trends.
Free with trial Simple logo design with three horizontal, rounded teal bars stacked vertically on a dark background. The bars decrease in length from top to bottom, forming a stylized, abstract shape. Decrease bar vectors Strawberry menu icon for navigation button. Simple logo design with three horizontal, rounded teal bars stacked vertically on a dark background. The bars decrease in length from top to bottom, forming a stylized, abstract shape.
Free with trial Graph line icon. Continuous line with share plane. Column chart sign. Growth diagram symbol. 3d heart in speech bubble. Graph chart single line ribbon. Loop curve pattern. Vector. Decrease bar vectors Graph line icon. Column chart sign. Continuous line with plane. Vector. Graph line icon. Continuous line with share plane. Column chart sign. Growth diagram symbol. 3d heart in speech bubble. Graph chart single line ribbon. Loop curve pattern. Vector
Free with trial Graph line icon. Continuous line with share plane. Column chart sign. Ab test diagram symbol. 3d star in speech bubble. Graph chart single line ribbon. Loop curve pattern. Vector. Decrease bar vectors Graph line icon. Column chart sign. Continuous line with plane. Vector. Graph line icon. Continuous line with share plane. Column chart sign. Ab test diagram symbol. 3d star in speech bubble. Graph chart single line ribbon. Loop curve pattern. Vector
Free with trial A simple line drawing of a hand with two speech bubbles, one containing a downward trending bar graph and the other a. Decrease bar illustrations Hand discussing financial decline with money. A simple line drawing of a hand with two speech bubbles, one containing a downward trending bar graph and the other a.
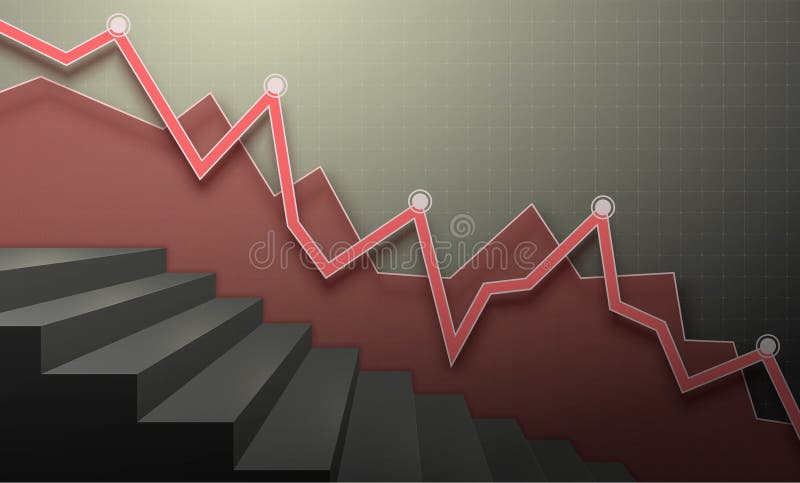
Free with trial Red financial chart with descending lines and a ladder. Vector 3D illustration. Decrease bar vectors Red financial chart with descending lines and a ladder. Vector 3D
Free with trial Vector graphic showing business profit and loss statement with green upward trends, red declines, percentages, calculator, and money icons. Decrease bar illustrations Illustrated Profit and Loss Financial Report with Charts and Graphs. Vector graphic showing business profit and loss statement with green upward trends, red declines, percentages, calculator, and money icons
Free with trial Graph line icon. Halftone dotted pattern. Gradient icon with grain shadow. Column chart sign. Growth diagram symbol. Line graph chart icon. Various designs. Vector. Decrease bar vectors Graph line icon. Column chart sign. Halftone dotted pattern. Vector. Graph line icon. Halftone dotted pattern. Gradient icon with grain shadow. Column chart sign. Growth diagram symbol. Line graph chart icon. Various designs. Vector
Free with trial Graph line icon. Halftone dotted pattern. Gradient icon with grain shadow. Column chart sign. Growth diagram symbol. Line graph chart icon. Various designs. Vector. Decrease bar vectors Graph line icon. Column chart sign. Halftone dotted pattern. Vector. Graph line icon. Halftone dotted pattern. Gradient icon with grain shadow. Column chart sign. Growth diagram symbol. Line graph chart icon. Various designs. Vector
Free with trial Web report line icon. Neumorphic, Flat shadow, 3d buttons. Column graph sign. Growth diagram symbol. Line web report icon. Social media icons. Vector. Decrease bar illustrations Web report line icon. Column graph sign. Neumorphic buttons. Vector. Web report line icon. Neumorphic, Flat shadow, 3d buttons. Column graph sign. Growth diagram symbol. Line web report icon. Social media icons. Vector
Free with trial A flat illustration of business graphs and charts showing analysis results. Featuring clean design and vibrant color scheme. Decrease bar vectors Colorful business graph and chart flat style design. A flat illustration of business graphs and charts showing analysis results. Featuring clean design and vibrant color scheme.
Free with trial A contrasting vector graphic set showing rising green bars with an upward arrow and falling red bars with a downward arrow, representing financial growth and decline. Decrease bar vectors Business bar charts indicating growth and decline. A contrasting vector graphic set showing rising green bars with an upward arrow and falling red bars with a downward arrow, representing financial growth and decline
Free with trial A set of financial growth and decline chart icons featuring up and down arrows with colorful bars, indicating economic trends. the concept of financial market increases, decreases and fluctuations. Decrease bar vectors Set of Financial Fluctuation Chart Icons in Flat Design. A set of financial growth and decline chart icons featuring up and down arrows with colorful bars, indicating economic trends. the concept of financial market increases, decreases and fluctuations
Free with trial Business performance, negative trends, data analysis, economic decline, search results, user concerns. Sad emoticon, graph with downward trend magnifying glass. Business and negative trends. Decrease bar vectors Declining Graph with Sad Face and Search Bar Negative Trends and Analysis. Business performance, negative trends, data analysis, economic decline, search results, user concerns. Sad emoticon, graph with downward trend magnifying glass. Business and negative trends
Free with trial A line art icon depicting business performance analysis. Decrease bar illustrations Gear, Chart, Envelope Business Performance Analysis Icon. A line art icon depicting business performance analysis.
Free with trial Calendar graph line icon. Neumorphic, Flat shadow, 3d buttons. Column chart sign. Growth diagram symbol. Line calendar graph icon. Social media icons. Vector. Decrease bar vectors Calendar graph line icon. Column chart sign. Neumorphic buttons. Vector. Calendar graph line icon. Neumorphic, Flat shadow, 3d buttons. Column chart sign. Growth diagram symbol. Line calendar graph icon. Social media icons. Vector
Free with trial Web report line icon. Halftone dotted pattern. Gradient icon with grain shadow. Column graph sign. Growth diagram symbol. Line web report icon. Various designs. Vector. Decrease bar illustrations Web report line icon. Column graph sign. Halftone dotted pattern. Vector. Web report line icon. Halftone dotted pattern. Gradient icon with grain shadow. Column graph sign. Growth diagram symbol. Line web report icon. Various designs. Vector
Free with trial Report document line icon. Neumorphic, Flat shadow, 3d buttons. Column graph sign. Growth diagram, pie chart symbol. Line report document icon. Social media icons. Vector. Decrease bar vectors Report document line icon. Column graph sign. Neumorphic buttons. Vector. Report document line icon. Neumorphic, Flat shadow, 3d buttons. Column graph sign. Growth diagram, pie chart symbol. Line report document icon. Social media icons. Vector
Free with trial A set of three depicting financial decline with dollar signs and arrows. The are in black and blue colors. They feature a bar graph with a downward arrow and a dollar sign coin. The represent business, finance, and economic concepts. Decrease bar vectors Financial decline with dollar signs and arrows graph chart. A set of three depicting financial decline with dollar signs and arrows. The are in black and blue colors. They feature a bar graph with a downward arrow and a dollar sign coin. The represent business, finance, and economic concepts
Free with trial Statistics line icon. Neumorphic, Flat shadow, 3d buttons. Column chart sign. Growth graph diagram symbol. Line graph chart icon. Social media icons. Vector. Decrease bar vectors Statistics line icon. Column graph chart sign. Neumorphic buttons. Vector. Statistics line icon. Neumorphic, Flat shadow, 3d buttons. Column chart sign. Growth graph diagram symbol. Line graph chart icon. Social media icons. Vector
Free with trial A clean black and white set of nine vector icons showing growth, decline, stability, and financial trends for business presentations and reports. Decrease bar vectors Economic trend icons set flat design vector illustration. A clean black and white set of nine vector icons showing growth, decline, stability, and financial trends for business presentations and reports.
Free with trial Candlestick chart icons on a digital trading screen showing market movements, price trends and investment data for finance, stock analysis, trading strategy and economic growth. Decrease bar illustrations Candlestick chart displaying financial market data analysis. Candlestick chart icons on a digital trading screen showing market movements, price trends and investment data for finance, stock analysis, trading strategy and economic growth
Free with trial Analytics graph line icon. Continuous line big heart. Column chart sign. Growth diagram symbol. 3d hearts in heart shaped loop. Analytics graph single line ribbon. Loop curve pattern. Vector. Decrease bar vectors Analytics graph line icon. Column chart sign. Continuous line big heart. Vector. Analytics graph line icon. Continuous line big heart. Column chart sign. Growth diagram symbol. 3d hearts in heart shaped loop. Analytics graph single line ribbon. Loop curve pattern. Vector