Free with trial A 3D rendered illustration displays a decreasing bar graph composed of blue, purple, and yellow bars, indicating declining numerical data and trends. Decrease business chart diagram vectors Glossy bar graph with descending data trend on transparent background. A 3D rendered illustration displays a decreasing bar graph composed of blue, purple, and yellow bars, indicating declining numerical data and trends.
Free with trial Colorful flat design depicts bull and bear market fluctuation. Rising and falling arrows symbolize investment direction with a simple yet informative design. Decrease business chart diagram vectors Bull and Bear Market Illustration with Price Fluctuation Indicators on Black Background. Colorful flat design depicts bull and bear market fluctuation. Rising and falling arrows symbolize investment direction with a simple yet informative design.
Free with trial Stacked cubes with red arrow down symbols showing step by step decreasing trend and negative growth. Generative AI. Decrease business chart diagram illustrations Stacked cubes with red arrow down symbols showing step by step decreasing trend and negative growth
Free with trial Red zigzag arrow illustration shows financial decline with clear downward trend. Symbol represents economic recession, market crash, investment loss. Ideal for presentations on finance. Decrease business chart diagram illustrations Red zigzag arrow illustration shows financial decline with clear downward trend. Symbol represents economic recession, market
Free with trial Simple and clean blue gradient line graph is going up and down showing growth and decline over a period of time. Decrease business chart diagram vectors Blue gradient line graph showing growth and decline over time. Simple and clean blue gradient line graph is going up and down showing growth and decline over a period of time
Free with trial Color-coded bars with arrows indicate up/down movements and are separated by a line. Decrease business chart diagram vectors Color-coded vertical bars separated by a grey line with up/down arrows. Color-coded bars with arrows indicate up/down movements and are separated by a line.
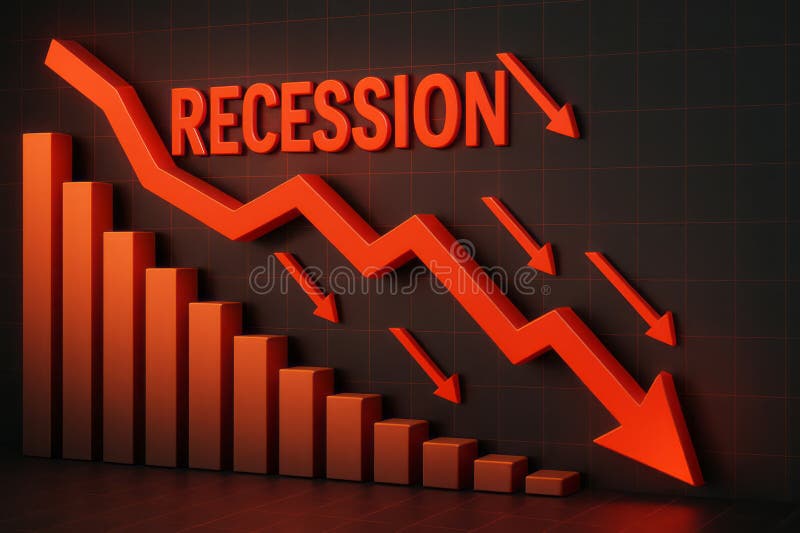
Free with trial Red bar graph showing downward trend and financial decline on a red background. Decrease business chart diagram illustrations Red bar graph showing downward trend and financial decline on a red background.
Free with trial Hand drawn bar graph showing a sharp downward trend with a descending arrow. Decrease business chart diagram vectors Hand drawn bar graph showing a sharp downward trend with a descending arrow
Free with trial Illustration featuring financial turmoil with dramatic downward arrows and distressed figures. Symbols like dollar ($), euro (�), and pound (�) are scattered, along with words like "SELL! ", "PANIC", "CRASH! ", and "BEAR MARKET". A piggy bank breaking symbolizes losses. Bar charts and various percentages emphasize financial decline. The style is cartoonish, using black and white sketches to depict the chaotic atmosphere often associated with stock market crashes or economic downturns. Elements convey urgency and distress in an economic context. Decrease business chart diagram vectors Stock Market Crash and Global Financial Crisis Hand Drawn Doodle Concept. Illustration featuring financial turmoil with dramatic downward arrows and distressed figures. Symbols like dollar ($), euro (�), and pound (�) are scattered, along with words like "SELL!", "PANIC", "CRASH!", and "BEAR MARKET". A piggy bank breaking symbolizes losses. Bar charts and various percentages emphasize financial decline. The style is cartoonish, using black and white sketches to depict the chaotic atmosphere often associated with stock market crashes or economic downturns. Elements convey urgency and distress in an economic context.
Free with trial A rupee symbol with a downward graph illustrates economic decline, financial loss, and currency devaluation through a simple design on a white background. Decrease business chart diagram vectors Vector art of rupee symbol with downward graph depicts economic decline, financial loss, and currency devaluation in a simple. A rupee symbol with a downward graph illustrates economic decline, financial loss, and currency devaluation through a simple design on a white background
Free with trial A close up of a red line graph with peaks and valleys on a textured light background. Generative AI. Decrease business chart diagram illustrations A close up of a red line graph with peaks and valleys on a textured light background
Free with trial Illustrated Stepped Levels with Arrows Show Growth then Decline Graphic Image. Decrease business chart diagram vectors Illustrated Stepped Levels with Arrows Show Growth then Decline Graphic Image
Free with trial A blue zig zag line represents a stock market graph that rises and falls. It is placed upon a financial square grid of many small blocks with color changing from red to blue. Decrease business chart diagram illustrations Stock Market Graph Showing Trending Line on Financial Grid During Daytime. A blue zig zag line represents a stock market graph that rises and falls. It is placed upon a financial square grid of many small blocks with color changing from red to blue.
Free with trial Simple flat design illustration of a stock market trend graph with a blue fill. The axis are dark gray and background is black. Decrease business chart diagram vectors Flat Design Stock Market Trend Graph with Axis on a Black Background. Simple flat design illustration of a stock market trend graph with a blue fill. The axis are dark gray and background is black.
Free with trial 3D Falling Arrow with Percent Icon. Decline Representation on Elegant Background. Decrease business chart diagram illustrations 3D Falling Arrow with Percent Icon. Decline Representation on Elegant Background
Free with trial Red arrow going down representing a stock market crash with a broker silhouette watching it. Decrease business chart diagram illustrations Stock market crash showing a red arrow going down and a broker watching it. Red arrow going down representing a stock market crash with a broker silhouette watching it
Free with trial A red line graph showing a downward trend on a gray grid background with white lines. Generative AI. Decrease business chart diagram illustrations A red line graph showing a downward trend on a gray grid background with white lines
Free with trial Businessman has been crushed by a huge coin with the Dollar symbol. Decrease business chart diagram vectors Businessman has been crushed by a huge coin with the Dollar symbol
Free with trial Financial concept illustration with arrows pointing towards and away from bag. Decrease business chart diagram vectors Financial concept illustration with arrows pointing towards and away from bag
Free with trial A black and white illustration depicting a declining graph with various symbols. A downward zigzag arrow crosses over bar graphs, symbolizing a decrease or crisis. A broken chain link, an exclamation mark inside a warning triangle, and a crossed-out megaphone suggest failure and communication issues. A laptop screen displays "404," indicating an error or page not found. These elements represent themes of disruption and technical difficulties. Decrease business chart diagram vectors Digital Marketing Failure Concept with Declining Graph and Broken Link Icons. A black and white illustration depicting a declining graph with various symbols. A downward zigzag arrow crosses over bar graphs, symbolizing a decrease or crisis. A broken chain link, an exclamation mark inside a warning triangle, and a crossed-out megaphone suggest failure and communication issues. A laptop screen displays "404," indicating an error or page not found. These elements represent themes of disruption and technical difficulties.
Free with trial Illustration of a line graph connecting points above bar graph on black. Flat design with blue outlines, orange points, and blue and green bars. Decrease business chart diagram vectors Line graph and bar graph showing growth and trends, isolated on black background. Illustration of a line graph connecting points above bar graph on black. Flat design with blue outlines, orange points, and blue and green bars.
Free with trial Hand-drawn graph showing a market downturn and decline, minimalist representation. Decrease business chart diagram vectors Hand-drawn graph showing a market downturn and decline, minimalist representation
Free with trial A visually captivating image of red line graph showing a sharp decline in values on a dark background. Generative AI. Decrease business chart diagram illustrations Red line graph showing a sharp decline in values on a dark background. Generative AI
Free with trial A white world map with a red line graph showing a downward trend across the continents. Generative AI. Decrease business chart diagram illustrations A white world map with a red line graph showing a downward trend across the continents
Free with trial This is an detailed collection of financial growth charts and market volatility icons in a clean minimal style. Decrease business chart diagram vectors Financial line icons showing stock market trends with bull and bear symbols. This is an detailed collection of financial growth charts and market volatility icons in a clean minimal style
Free with trial A stylized document showing dollar symbols and a downward arrow, conveying financial loss or decline. Graphic style with a flat design and simple composition. Decrease business chart diagram vectors Financial Report with Dollar Symbols and Downward Arrows Indicating Loss. A stylized document showing dollar symbols and a downward arrow, conveying financial loss or decline. Graphic style with a flat design and simple composition.
Free with trial A 3D rendered bar graph in descending order shows decline or trend, rendered in pastel shades of blue, green, and purple. Decrease business chart diagram vectors Colorful descending bar graph illustration, 3D render, on transparent background. A 3D rendered bar graph in descending order shows decline or trend, rendered in pastel shades of blue, green, and purple.
Free with trial This image shows a simple 3D bar graph made up of four colorful bars, decreasing in height. The colors are purple, blue, and green. Decrease business chart diagram vectors Colorful stylized bar graph showing decreasing trends on transparent background. This image shows a simple 3D bar graph made up of four colorful bars, decreasing in height. The colors are purple, blue, and green.
Free with trial This stylized illustration depicts a stock market downturn with a descending arrow and falling graph, symbolizing financial losses and economic recession in a flat style. Decrease business chart diagram vectors Stock Market Downturn and Financial Loss Visualized Through a Graphic Depiction. This stylized illustration depicts a stock market downturn with a descending arrow and falling graph, symbolizing financial losses and economic recession in a flat style.
Free with trial Blue Searching for food in trash can on streets outdoors icon isolated on white background. Homelessness and poverty concept. Vector. Decrease business chart diagram illustrations Blue Searching for food in trash can on streets outdoors icon isolated on white background. Homelessness and poverty
Free with trial A simple line graph two colored lines, blue and green, with circular data points indicating trends against a white background. Decrease business chart diagram illustrations Two distinct colored lines with circular markers charting upward and downward trends on a white background. A simple line graph two colored lines, blue and green, with circular data points indicating trends against a white background
Free with trial This image visually represents an economic recession through downward trends and statistics. The vibrant red arrows emphasize the significant decline in growth, making it an impactful visual for financial analysis. Decrease business chart diagram illustrations Dramatic Decline in Economic Growth with Recession Indicator and Downward Arrows in Red. This image visually represents an economic recession through downward trends and statistics. The vibrant red arrows emphasize the significant decline in growth, making it an impactful visual for financial analysis
Free with trial 3D render of orange crude oil barrels increasing in size, followed by a large blue arrow pointing downward on a white background, symbolizing market decline, price drop, and economic recession. Decrease business chart diagram illustrations Crude Oil Barrels Price Fluctuation with Downward Arrow on White for Market Slump. 3D render of orange crude oil barrels increasing in size, followed by a large. 3D render of orange crude oil barrels increasing in size, followed by a large blue arrow pointing downward on a white background, symbolizing market decline, price drop, and economic recession.
Free with trial 3D render of orange crude oil barrels increasing in size, followed by a large blue arrow pointing downward on a white background, symbolizing market decline, price drop, and economic recession. Decrease business chart diagram illustrations Crude Oil Barrels Price Fluctuation with Downward Arrow on White for Market Slump. 3D render of orange crude oil barrels increasing in size, followed by a large blue arrow pointing downward on a white background, symbolizing market decline, price drop, and economic recession.
Free with trial Illustration of a distressed man in a suit looking at his empty wallet next to a broken piggy bank. A downward-trending bar graph labeled "LOSS" indicates declining numbers from 100 to 25. The setting suggests financial loss or economic difficulty. Red arrows accentuate the theme of decrease. The piggy bank is depicted with cracks, reinforcing the sense of financial downturn. The man's posture and expression highlight concern and frustration. Decrease business chart diagram vectors Broke Businessman Holding Empty Wallet Facing Financial Loss and Broken Piggy Bank. Illustration of a distressed man in a suit looking at his empty wallet next to a broken piggy bank. A downward-trending bar graph labeled "LOSS" indicates declining numbers from 100 to 25. The setting suggests financial loss or economic difficulty. Red arrows accentuate the theme of decrease. The piggy bank is depicted with cracks, reinforcing the sense of financial downturn. The man's posture and expression highlight concern and frustration.
Free with trial Iconic flat style illustration of a declining financial graph overlaid with a dollar coin and a down arrow on black background. Decrease business chart diagram vectors Declining Financial Graph Showing Negative Dollar Sign with Falling Arrow Graphic. Iconic flat style illustration of a declining financial graph overlaid with a dollar coin and a down arrow on black background
Free with trial Wooden blocks and spheres displaying percentage signs represent financial concepts such as discounts sales interest rates investments savings loans mortgages banking economy market growth return prof. Decrease business chart diagram illustrations Percentage discount sale promotion offer finance interest rate investment savings loan mortgage banking economy market growth retu. Wooden blocks and spheres displaying percentage signs represent financial concepts such as discounts sales interest rates investments savings loans mortgages banking economy market growth return prof
Free with trial Analyzing Data: Person Presenting Graph Showing Progress and Growth Pointing to Top Data Peak, Achievement Concept. Decrease business chart diagram illustrations Analyzing Data: Person Presenting Graph Showing Progress and Growth Pointing to Top Data Peak, Achievement Concept
Free with trial A minimalist teal illustration shows a declining bar graph with a downward arrow against a stark black background. Indicating negative trend and recession. Decrease business chart diagram vectors Downward trend graph illustration indicating loss or decline in a minimalist style. A minimalist teal illustration shows a declining bar graph with a downward arrow against a stark black background. Indicating negative trend and recession.
Free with trial Illustration depicting a financial downturn with a gold coin, dollar signs, and red arrows on a black background using a flat style. Decrease business chart diagram vectors Financial Decline Concept Depicted by Red Arrows and Gold Coin with Dollar Sign. Illustration depicting a financial downturn with a gold coin, dollar signs, and red arrows on a black background using a flat style.
Free with trial A graph with a dollar sign. A growing trend. Financial Flat vector illustration isolated on white background. Decrease business chart diagram vectors A graph with a dollar sign
Free with trial A sharp red arrow graph depicting a significant decline and financial loss, isolated on a white background. Decrease business chart diagram illustrations Red downward trending arrow graph showing financial loss isolated on white background. A sharp red arrow graph depicting a significant decline and financial loss, isolated on a white background
Free with trial A boy, troubled by a financial investment downturn, anxiously reviews charts and data on his laptop. His expression reflects concern and stress over potential monetary loss and financial instability. Decrease business chart diagram illustrations The boy is worried about loss in financial investment. A boy, troubled by a financial investment downturn, anxiously reviews charts and data on his laptop. His expression reflects concern and stress over potential monetary loss and financial instability.
Free with trial Abstract illustration showing a downward trend arrow, suitable for depicting loss, decline, or reduction. Decrease business chart diagram vectors Downward Trend Arrow Illustration: Financial Loss, Market Decline, or Data Reduction. Abstract illustration showing a downward trend arrow, suitable for depicting loss, decline, or reduction.
Free with trial A flat-style graphic displaying falling stock values, shown by arrows and a graph on a monitor with dollar coins. Decrease business chart diagram vectors Stock market decline: Arrows showing a downward trend displayed on a screen with coins. A flat-style graphic displaying falling stock values, shown by arrows and a graph on a monitor with dollar coins.
Free with trial This image is a flat design showing a decreasing red bar graph on a black background. It symbolizes a decline or negative trend. Decrease business chart diagram vectors Decreasing Red Bar Graph on Black Background Representing Decline or Negative Trends. This image is a flat design showing a decreasing red bar graph on a black background. It symbolizes a decline or negative trend.
Free with trial A red line graph showing a downward trend on a white grid background indicating decline or loss. Generative AI. Decrease business chart diagram illustrations A red line graph showing a downward trend on a white grid background indicating decline or loss
Free with trial A stylized flat design of a declining graph with an alert symbol, signifying financial risk and investment losses on a black background. Decrease business chart diagram vectors Financial Risk Warning Graphic: Declining Graph with Alert Symbol for Investment Losses. A stylized flat design of a declining graph with an alert symbol, signifying financial risk and investment losses on a black background.
Free with trial Gold coins stack with red arrow zigzag down representing economic recession and market crash. Generative AI. Decrease business chart diagram illustrations Gold coins stack with red arrow zigzag down representing economic recession and market crash
Free with trial A dynamic visual representation showcases interest rate volatility, featuring fluctuating lines, percentage symbols, and financial data analysis. The display creates a sense of market flux and economic shifts. Ideal for illustrating financial news, investment strategies, economic forecasts, and mark. Decrease business chart diagram illustrations Interest Rate Volatility Display Showing Financial Data Trends and Fluctuations for Market Analysis. A dynamic visual representation showcases interest rate volatility, featuring fluctuating lines, percentage symbols, and financial data analysis. The display creates a sense of market flux and economic shifts. Ideal for illustrating financial news, investment strategies, economic forecasts, and mark
Free with trial A green line graph shows a downward trend, with arrows indicating the direction. it's a visual representation of decline or loss. Decrease business chart diagram illustrations Green line graph showing downward trend with arrows indicating direction on a plain setting. a green line graph shows a downward trend, with arrows indicating the direction. it's a visual representation of decline or loss.
Free with trial Abstract financial trading graph with candlestick charts and data analysis on a dark background. Decrease business chart diagram illustrations Abstract financial trading graph with candlestick charts and data analysis on a dark background
Free with trial Burning red arrow falling over digital world map showing global economic crisis, financial recession, and market collapse visualization. Decrease business chart diagram illustrations Burning red arrow falling over digital world map showing global economic crisis, financial recession
Free with trial Financial graph illustrates the decline in Bitcoin value, depicted with a red arrow and blue graph bars in a flat vector style. Decrease business chart diagram vectors Bitcoin value declining depicted through a financial graph and currency on black background. Financial graph illustrates the decline in Bitcoin value, depicted with a red arrow and blue graph bars in a flat vector style.
Free with trial Flat vector design showcasing a downward trending graph with a distinct red arrow. Represents market decline and financial challenges against a stark black background. Decrease business chart diagram vectors Downward Graph with Arrow: A Visual Representation of Market Downturn and Financial Loss. Flat vector design showcasing a downward trending graph with a distinct red arrow. Represents market decline and financial challenges against a stark black background.
Free with trial A flat vector illustration of a declining bar graph with a red arrow on a black background illustrating financial loss. Decrease business chart diagram vectors Declining Bar Graph with Red Arrow Illustrating Financial Downturn on Black Background. A flat vector illustration of a declining bar graph with a red arrow on a black background illustrating financial loss.
Free with trial Economy growth graph down vector icon illustration. Decrease business chart diagram vectors Economy growth graph down icon design. economy growth graph down vector icon illustration
Free with trial A visual representation of a global economic downturn, featuring a world globe, a downward-pointing red arrow, and a stock market graph overlay, all set against a dark background. Decrease business chart diagram illustrations Global economic downturn depicted with a world globe, red arrow, and stock market graph overlay. A visual representation of a global economic downturn, featuring a world globe, a downward-pointing red arrow, and a stock market graph overlay, all set against a dark background.
Free with trial Paper cut Global economic crisis icon isolated on grey and black background. World finance crisis. Paper art style. Vector. Decrease business chart diagram illustrations Paper cut Global economic crisis icon isolated on grey and black background. World finance crisis. Paper art style
Free with trial Stylized flat vector graph displaying a downward trend with percentage symbols; composed against a stark black background for emphasis. Decrease business chart diagram vectors Downward Trend Graph Illustration Showing Declining Percentage Values on Black Backdrop. Stylized flat vector graph displaying a downward trend with percentage symbols; composed against a stark black background for emphasis.
Free with trial A stylized bar graph illustration depicts a financial decline with a downward trending arrow and dollar sign over a black background. Decrease business chart diagram vectors Declining bar graph with downward trending arrow and dollar sign against black backdrop. A stylized bar graph illustration depicts a financial decline with a downward trending arrow and dollar sign over a black background.
Free with trial Stack of coins with upward arrow, symbolizing growth, savings, investment, and financial success ,Generative ai. Decrease business chart diagram illustrations Ascending arrow on coin stack, visualizing financial growth, investment, savings, and wealth building. Stack of coins with upward arrow, symbolizing growth, savings, investment, and financial success ,Generative ai
Free with trial A flat illustration presents a declining graph paired with a dollar coin, symbolizing financial loss and economic downturn with clean lines and colors. Decrease business chart diagram vectors Financial Loss Concept: Graph Depicting Decline with a Dollar Coin, Economy and Investment. A flat illustration presents a declining graph paired with a dollar coin, symbolizing financial loss and economic downturn with clean lines and colors.
Free with trial This image shows a red bar graph with a downward trend indicated by a down arrow, and an upward trend indicated by an up arrow, set against a white background. Decrease business chart diagram vectors Vector art of red bar graph showing a downward trend with an arrow pointing down and an upward trend with an arrow pointing up. This image shows a red bar graph with a downward trend indicated by a down arrow, and an upward trend indicated by an up arrow, set against a white background
Free with trial Illuminated descending bar graph against a gradient blue background suggesting decline. Generative AI. Decrease business chart diagram illustrations Illuminated descending bar graph against a gradient blue background suggesting decline
Free with trial Declining Bar Graph with Arrow, Decreasing Statistics, Market Downturn, Financial Loss, Negative Trend. Decrease business chart diagram vectors Declining Bar Graph with Arrow, Decreasing Statistics, Market Downturn, Financial Loss, Negative Trend
Free with trial A flat style illustration of market trend with upward and downward arrows and wavy lines against black background. Decrease business chart diagram vectors Stock market trend illustration showing upward and downward direction in financial trading. A flat style illustration of market trend with upward and downward arrows and wavy lines against black background.
Free with trial Oil industry performance represented with weather icons above graph and barrels below, in a simple, clean and modern graphic style. Decrease business chart diagram vectors Infographic Showing Oil Industry Performance with Weather Elements and Economic Indicators. Oil industry performance represented with weather icons above graph and barrels below, in a simple, clean and modern graphic style.
Free with trial Black and white icon representing a bar graph with rising and falling values indicated by arrows. Decrease business chart diagram illustrations Simple bar graph icon with arrows. Black and white icon representing a bar graph with rising and falling values indicated by arrows
Free with trial Bar graph descends on blue background 3d render. Visualizes negative trend, economic downfall, failure, crisis, statistics, market analysis, budget deficit, bankruptcy. Perfect for marketing finance. Decrease business chart diagram illustrations Bar graph descends on blue background 3d render. Visualizes negative trend, economic downfall, failure, crisis, statistics, market
Free with trial A 3D bar graph with a jagged trend line shows rising data followed by a sudden drop, set against a bright blue background. Decrease business chart diagram illustrations A 3D bar graph with a jagged trend line shows rising data followed by a sudden drop, set against a bright blue background
Free with trial A collection of colorful isometric bar charts and line graphs are displayed on a white background, representing data visualization and analysis. Decrease business chart diagram illustrations Isometric colorful bar charts and line graphs displayed on a white background for data visualization. a collection of colorful isometric bar charts and line graphs are displayed on a white background, representing data visualization and analysis
Free with trial A sharply declining red line graph against a dark grid evokes a sense of financial market downturn. Decrease business chart diagram illustrations A sharply declining red line graph against a dark grid evokes a sense of financial market downturn
Free with trial A person is holding a tablet with a graph on it. The graph is showing a downward trend, which could indicate a decrease in sales or a negative outcome. Decrease business chart diagram illustrations A person is holding a tablet with a graph on it
Free with trial A minimalist illustration of a graph showing a downward trend, accompanied by a cloud and sun, symbolizing economic decline or negative weather patterns. Decrease business chart diagram vectors Vector art of a declining graph with a cloud and sun, representing economic downturn and negative trends. A minimalist illustration of a graph showing a downward trend, accompanied by a cloud and sun, symbolizing economic decline or negative weather patterns
Free with trial A sharply declining red arrow against a grid evokes negative trends and downward movement overall. Decrease business chart diagram illustrations A sharply declining red arrow against a grid evokes negative trends and downward movement overall
Free with trial Blue Searching for food in trash can on streets outdoors icon isolated on blue background. Homelessness and poverty concept. Minimalism concept. 3D render illustration. Decrease business chart diagram illustrations Blue Searching for food in trash can on streets outdoors icon isolated on blue background. Homelessness and poverty