Free with trial Reduction graph concept. Red arrow depict recession business. Flat illustration of broken downward arrow as an element for infographic, article background for web, publish, social networks. Decrease business chart diagram vectors Recession Business Concept 3. Reduction graph concept. Red arrow depict recession business. Flat illustration of broken downward arrow as an element for infographic, article background for web, publish, social networks.
Free with trial Coal price goes down drop decrease cheap in global commodity market trade export transaction energy stone mining vector. Decrease business chart diagram vectors Coal price goes down drop decrease cheap in global commodity market trade export transaction energy stone mining
Free with trial The hand stops moving up on the chart. Stock markets financial crisis concept. Low poly, geometric, wire, Particles, lines, and triangles outline. Decrease business chart diagram vectors The hand stops moving up on the chart. Stock markets financial crisis concept. Low poly, geometric, wire, Particles, lines
Free with trial Sketch graphs and charts for business presentation. Decrease business chart diagram vectors Financial chart. Sketch graphs and charts for business presentation
Free with trial Vector image of the Business concept about crisis. Decrease business chart diagram vectors Business concept about crisis
Free with trial Colorful crisis financial bar diagram with red arrow down 3d. Decrease business chart diagram illustrations Colorful crisis financial bar diagram with red arrow down
Free with trial A black silhouette of a financial graph with bars and jagged lines is shown on white. Decrease business chart diagram illustrations Black silhouette of a financial graph with bars and jagged lines on white chart business. A black silhouette of a financial graph with bars and jagged lines is shown on white
Free with trial An isometric 3D bar chart composed of blue, gray, and orange blocks of varying heights is arranged on a white background. Decrease business chart diagram illustrations Isometric 3D bar chart with blue, gray, and orange blocks on a white background graph data. An isometric 3D bar chart composed of blue, gray, and orange blocks of varying heights is arranged on a white background
Free with trial Financial trading chart displaying red bearish candlestick patterns and decreasing stock values, illustrating a market downturn, economic loss, and recession risk. Decrease business chart diagram illustrations Candlestick chart showing stock market financial recession and loss. Financial trading chart displaying red bearish candlestick patterns and decreasing stock values, illustrating a market downturn, economic loss, and recession risk
Free with trial Businessman and stock market arrow presentation. Cheerful businessman with graph indicating increase. The concept of business success. Can be used for workflow layout, banner, diagram, number options, step up options, web design, timeline, infographic template. Vector illustration. Decrease business chart diagram vectors Businessman and stock market arrow presentation.Cheerful businessman with graph indicating increase.The concept of business
Free with trial Vector image of the Business concept about crisis. Decrease business chart diagram vectors Business concept about crisis2. Vector image of the Business concept about crisis
Free with trial Vector image of the Business concept about crisis. Decrease business chart diagram vectors Business concept about crisis3. Vector image of the Business concept about crisis
Free with trial Colorful bar graph with downward trend, business concept illustration. Decrease business chart diagram vectors Colorful bar graph with downward trend, business concept illustration
Free with trial Shopping bag decreasing chart. Sales reduction chart. 3D render illustration isolated on white background. Decrease business chart diagram illustrations Shopping bag decreasing chart. Sales reduction chart. 3D
Free with trial Frozen graph showing a downward trend. Cold economy concept, financial crisis, declining business, and cold market conditions. Decrease business chart diagram illustrations Frozen graph showing a downward trend. Cold economy concept, financial crisis, declining business
Free with trial Red stock market investment decline chart. Decrease business chart diagram vectors Red stock market investment decline chart
Free with trial Red stock market investment decline chart. Decrease business chart diagram vectors Red stock market investment decline chart
Free with trial Vector Illustration. financial success concept with golden Bitcoins ladder on green graph up chart background. isolated on white background. trade finance concept. exchange rate fluctuation. Decrease business chart diagram vectors Vector Illustration. financial success concept with golden Bitcoins ladder on green graph up chart background. isolated on white
Free with trial Businessman hand pushing a business graph on a touch screen interface. Hand holding business graph. Isolated on white background. Vector illustration flat design. Decrease business chart diagram vectors Businessman hand pushing a business graph on a touch screen interface.Hand holding business graph.Isolated on white background.
Free with trial Blue flat visualization showing bar chart and downward arrow over data grid with world map overlay. Analytics, finance, data analysis, digital, infographic, corporate, trend. Decrease business chart diagram illustrations Blue flat visualization showing bar chart and downward arrow over data grid with world map overlay
Free with trial A visual representation of a financial downturn, depicted by a bar chart with bars decreasing in height and a prominent red arrow pointing downwards, signifying a negative trend. Decrease business chart diagram illustrations Bar chart with red arrow showing decline isolated on white background. A visual representation of a financial downturn, depicted by a bar chart with bars decreasing in height and a prominent red arrow pointing downwards, signifying a negative trend
Free with trial Graph down. Black icon graph decline with arrow isolated on white background. Hologram statistic. Deficit direction for business concept design. Analysis information forecast. Vector illustration. Decrease business chart diagram vectors Graph down. Black icon graph decline with arrow. Hologram statistic. Deficit direction business. Analysis information forecast. Graph down. Black icon graph decline with arrow isolated on white background. Hologram statistic. Deficit direction for business concept design. Analysis information forecast. Vector illustration
Free with trial This graphic depicts a bar chart with a downward trending line, observed closely with a magnifying glass, symbolizing scrutiny, analysis, and potential performance decline or investigation of data. Decrease business chart diagram vectors Declining Chart with Magnifying Glass: Analysis and Performance Review. This graphic depicts a bar chart with a downward trending line, observed closely with a magnifying glass, symbolizing scrutiny, analysis, and potential performance decline or investigation of data.
Free with trial Set Mobile stock trading, Dollar rate decrease, Broken piggy bank and icon. Vector. Decrease business chart diagram illustrations Set Mobile stock trading, Dollar rate decrease, Broken piggy bank and icon. Vector
Free with trial Money loss. Financial crisis and business bankruptcy concept with depressed businessmen characters under falling arrow. Vector illustration of crisis financial and bankruptcy. Decrease business chart diagram vectors Money loss. Financial crisis and business bankruptcy concept with depressed businessmen characters under falling arrow
Free with trial Simple hand drawn black and white illustration of a declining graph on a white background, indicating loss, decrease, or economic downturn and representing a negative trend in business or finance. Decrease business chart diagram vectors Hand Drawn Declining Graph Illustration on White Background Stock Image. Simple hand drawn black and white illustration of a declining graph on a white background, indicating loss, decrease, or economic downturn and representing a negative trend in business or finance.
Free with trial Growth vector icon. Graph or diagram with arrow going up and down. Vector illustration. Decrease business chart diagram vectors Growth vector icon. Graph or diagram with arrow going up and down. Vector
Free with trial Two flat design icons representing financial trends. One shows an upward bar chart with an arrow and percentage symbol, the other a downward bar chart with a percentage symbol. Decrease business chart diagram vectors Upward and Downward Bar Chart Icons with Percentage Symbols Ai-Generated. Two flat design icons representing financial trends. One shows an upward bar chart with an arrow and percentage symbol, the other a downward bar chart with a percentage symbol
Free with trial A graph with a reduction report. A dagram showing the recession and bankruptcy. Business and finance concept. Vector illustration. Decrease business chart diagram vectors Graph with a reduction report. A dagram showing the recession and bankruptcy. Business and finance concept. Vector illustration
Free with trial Modern and various graph icons, bar chart, pie chart icon for indicating the progress. Decrease business chart diagram vectors Modern and various graph icons, bar chart, pie chart icon
Free with trial A man is pointing at a stock chart with a sell indicator and a downward arrow, indicating a potential downward trend in the market. Decrease business chart diagram vectors Man pointing at sell chart with downward arrow indicator. a man is pointing at a stock chart with a sell indicator and a downward arrow, indicating a potential downward trend in the market.
Free with trial Sketch graphs and charts for business presentation. Decrease business chart diagram vectors Financial charts on the flip chart. Sketch graphs and charts for business presentation
Free with trial Bar graph displays a colorful representation of business growth and financial success with bars increasing in height and vibrant colors on a reflective surface indicating positive trends. Decrease business chart diagram illustrations Colorful bar graph showing growth and success in business and finance on a reflective surface. Bar graph displays a colorful representation of business growth and financial success with bars increasing in height and vibrant colors on a reflective surface indicating positive trends.
Free with trial A 3D render shows a vibrant, pastel-colored bar chart displaying a decreasing trend with blue, yellow, and lavender bars on a transparent background. Decrease business chart diagram vectors Downward trendy pastel bar chart illustration on transparent background. A 3D render shows a vibrant, pastel-colored bar chart displaying a decreasing trend with blue, yellow, and lavender bars on a transparent background.
Free with trial Falling trend sketch of business finance graph with bar charts and arrow. Decrease business chart diagram illustrations Falling trend sketch of business finance graph with bar charts and arrow
Free with trial This infographic displays a bar graph illustrating a sharp negative trend. The red line clearly depicts a significant decrease, showcasing concepts like downturn, recession, and loss within a business or financial context. Ideal for presentations, reports, and analyses highlighting negative market trends or economic decline, generated by AI. Decrease business chart diagram illustrations Decreasing bar graph showing negative trend decline. This infographic displays a bar graph illustrating a sharp negative trend. The red line clearly depicts a significant decrease, showcasing concepts like downturn, recession, and loss within a business or financial context. Ideal for presentations, reports, and analyses highlighting negative market trends or economic decline, generated by AI.
Free with trial Flat infographic decreasing graph concept. Yellow pencil as a downtrend arrow with hand drawn column chart. Infographics vector elements for business publish, web, social media. Decrease business chart diagram vectors Decreasing graph concept.
Free with trial Flat infographic reduction business concept. Red pencil as a decreasing graph arrow with recession hand drawn column chart. Infographics vector elements for web, publish, social networks. Decrease business chart diagram vectors Decreasing graph concept. Flat infographic reduction business concept. Red pencil as a decreasing graph arrow with recession hand drawn column chart. Infographics vector elements for web, publish, social networks.
Free with trial Bright, colorful stock chart on dark screen. Fluctuations lines and grid representing data and trends. Stock photo. Decrease business chart diagram illustrations Bright, colorful stock chart on dark screen. Fluctuations lines and grid representing data and trends
Free with trial A stacked area chart performance data with distinct colored segments in a rainbow gradient. The vertical axis percentages from 0% to 170%, and the horizontal axis percentage values. Decrease business chart diagram illustrations Stacked area chart showing level performance with rainbow colors and percentage axis graph data. A stacked area chart performance data with distinct colored segments in a rainbow gradient. The vertical axis percentages from 0% to 170%, and the horizontal axis percentage values
Free with trial Cost reduction icon. Cost down concept. Businessman with hand lowers arrow of the graph. Vector illustration flat minimal line design. Isolated on background. Decrease down profit. Declining chart. Decrease business chart diagram vectors Cost reduction icon. Cost down concept
Free with trial Covid19 virus and red arrow down with data business and stock market or forex trading graph concept with on blue background 3D illustration. Decrease business chart diagram illustrations Covid19 virus and red arrow down with data business and stock market or forex trading graph concept banner with on blue background. Covid19 virus and red arrow down with data business and stock market or forex trading graph concept with on blue background 3D illustration
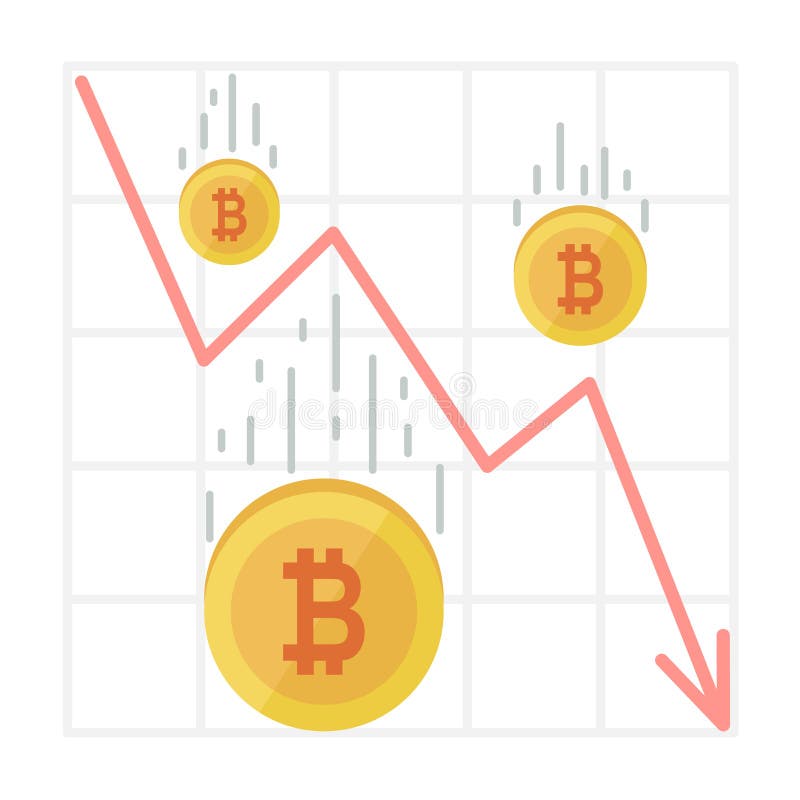
Free with trial Bitcoin Fall Chart. Cryptocurrency decline graph in flat style. Web money price crash, red sales arrow down vector Illustration. Decrease business chart diagram vectors Bitcoin Fall Chart. Cryptocurrency decline graph in flat style. Web money price crash
Free with trial Analyze Data with Graphs on Tablet, Business Growth Concept and Wood Background , subtle gradient. Decrease business chart diagram illustrations Analyze Data with Graphs on Tablet, Business Growth Concept and Wood Background
Free with trial Business performance decline icon vector. Productivity drop and process efficiency loss symbol. Decrease business chart diagram vectors Business performance decline icon. Productivity drop and process efficiency loss symbol
Free with trial An abstract digital rendering of a financial market chart with a prominent red line indicating fluctuations in a stock market or trading scenario, set against a background of data streams and numerical information. It can be used for visualizing economic trends or for representing financial analytics. Decrease business chart diagram illustrations Abstract financial chart depicting market trends and data analysis interface. An abstract digital rendering of a financial market chart with a prominent red line indicating fluctuations in a stock market or trading scenario, set against a background of data streams and numerical information. It can be used for visualizing economic trends or for representing financial analytics
Free with trial Abstract 3D Bar Chart Showing Data Growth. Decrease business chart diagram illustrations Abstract 3D Bar Chart Showing Data Growth
Free with trial 3d bar chart with orange and green bars on a blue grid background isolated on white. Decrease business chart diagram illustrations 3d bar chart with orange and green bars on blue grid background graph data. 3d bar chart with orange and green bars on a blue grid background isolated on white
Free with trial A pair of hands holds a sheet of paper displaying a red line graph on a grid pattern the graph illustrates a downward trend, indicating a decline in business, finance or economy the image represents loss, failure, or a recession, generated by AI. Decrease business chart diagram illustrations Hands holding paper showing a declining red business graph data. a pair of hands holds a sheet of paper displaying a red line graph on a grid pattern the graph illustrates a downward trend, indicating a decline in business, finance or economy the image represents loss, failure, or a recession, generated by AI.
Free with trial A 3D bar chart with a red arrow indicating a significant downward trend, symbolizing financial loss or economic decline. Isolated on a white background. Decrease business chart diagram illustrations Bar chart showing a downward trend isolated on white background. A 3D bar chart with a red arrow indicating a significant downward trend, symbolizing financial loss or economic decline. Isolated on a white background
Free with trial Bar chart showing a steep downward trend with a large arrow indicating decline. Decrease business chart diagram vectors Bar chart showing a steep downward trend with a large arrow indicating decline
Free with trial Decreasing income. Business falling down. Decrease business chart diagram vectors Business falling down
Free with trial Visual representation of a financial downturn. A bar chart shows a sharp decline, accompanied by a warning sign and a gold dollar coin, symbolizing economic trouble and risk. Decrease business chart diagram illustrations Financial crisis alert decreasing bar chart with dollar coin and warning sign. Visual representation of a financial downturn. A bar chart shows a sharp decline, accompanied by a warning sign and a gold dollar coin, symbolizing economic trouble and risk.
Free with trial Stock market crash caused by the Coronavirus, economic graph with diagrams, business and financial concepts and reports, abstract blue technology communication concept vector background. Decrease business chart diagram vectors Stock market crash caused by the Coronavirus, economic graph with diagrams, business and financial concepts and reports, abstract
Free with trial An illuminated downward arrow with a jagged line signifies a decline, representing negative performance and can be used to illustrate a decrease in business or any downward trend. Decrease business chart diagram illustrations Declining Arrow Shows Downtrend and Negative Performance. An illuminated downward arrow with a jagged line signifies a decline, representing negative performance and can be used to illustrate a decrease in business or any downward trend
Free with trial An isometric view of a bar chart with five blue bars of decreasing height, representing a downward trend. A red arrow points downwards, indicating a negative trajectory. Decrease business chart diagram illustrations Bar chart showing a downward trend with a red arrow isolated on white background. An isometric view of a bar chart with five blue bars of decreasing height, representing a downward trend. A red arrow points downwards, indicating a negative trajectory
Free with trial Black outline of descending bar chart with downward arrow, isolated on white background. concept of economic decline, data analysis, financial crisis, statistics. Decrease business chart diagram vectors Black outline of descending bar chart with downward arrow, isolated on white background. concept of economic decline, data
Free with trial Declining graph line icon. Negative graph statistics linear style sign for mobile concept and web design. Business decline chart outline vector icon. Symbol, logo illustration. Vector graphics. Decrease business chart diagram vectors Declining graph line icon
Free with trial Bar chart collapse icon with downward arrow. Decline and negative trend sign symbol vector. Decrease business chart diagram vectors Bar chart collapse icon with downward arrow. Decline and negative trend sign symbol
Free with trial Exclamation mark with globe and financial chart over dark blue background. Decrease business chart diagram illustrations Exclamation mark with globe and financial chart
Free with trial Set line Mobile stock trading, Burning dollar bill, Dollar rate decrease and Debt ball chained coin icon. Vector. Decrease business chart diagram vectors Set line Mobile stock trading, Burning dollar bill, Dollar rate decrease and Debt ball chained coin icon. Vector
Free with trial Businessman hand on head and looks up to a downward trending arrow chart. Decrease business chart diagram illustrations Businessman hand on head and looks up to a downward trending arrow chart
Free with trial Digital illustration of a business graph. Decrease business chart diagram illustrations Business graph
Free with trial Digital illustration of business graph in white background. Decrease business chart diagram illustrations Business graph
Free with trial Digital illustration of business graph in white background. Decrease business chart diagram illustrations Business graph
Free with trial Digital illustration of business graph in white background. Decrease business chart diagram illustrations Business graph
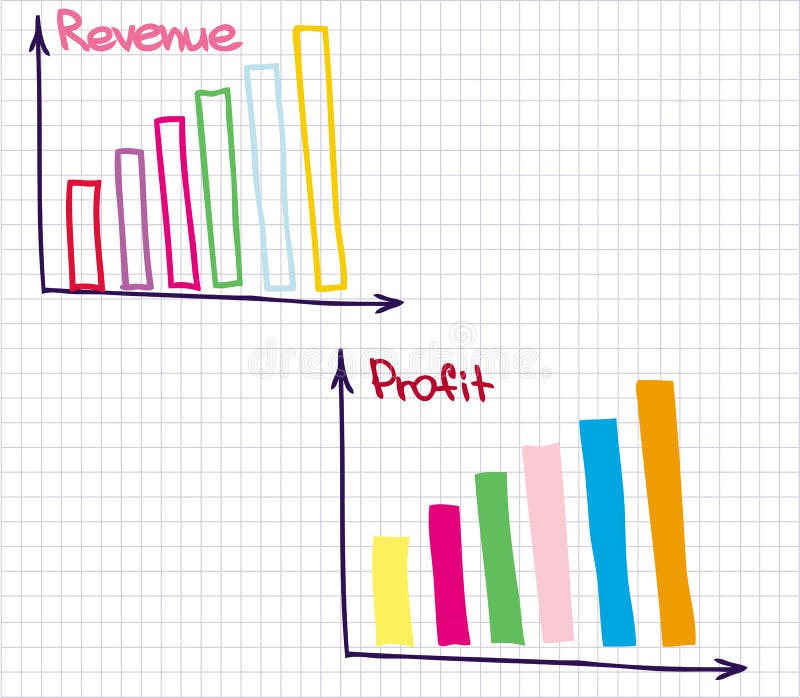
Free with trial Financial chart of revenue and loss. Decrease business chart diagram vectors Profit Revenue Chart. Financial chart of revenue and loss
Free with trial Financial chart of revenue and loss. Decrease business chart diagram vectors Profit Revenue Chart. Financial chart of revenue and loss
Free with trial Abstract financial bar chart with red downtrend line graph on black color background. Decrease business chart diagram illustrations Abstract financial bar chart with red downtrend line graph on black color background
Free with trial Colorful Bar Chart Graph Showing Growth and Performance Over Time with Upward Trend. Decrease business chart diagram vectors Colorful Bar Chart Graph Showing Growth and Performance Over Time with Upward Trend
Free with trial Decreasing graph concept. Arrow depict recession business and process. Flat vector illustration of downward arrow and business icons. Infographic elements, template for web, publish, social networks. Decrease business chart diagram vectors Recession Business Infographic. Decreasing graph concept. Arrow depict recession business and process. Flat vector illustration of downward arrow and business icons. Infographic elements, template for web, publish, social networks.
Free with trial Five colorful bars, resembling a chart, visually represent a downward trend. The bars are yellow, green, blue and purple. Decrease business chart diagram vectors Colorful bar chart illustration showing declining trend on transparent background. Five colorful bars, resembling a chart, visually represent a downward trend. The bars are yellow, green, blue and purple.
Free with trial Growth and decline chart icon. Green upward and red downward arrow symbol illustration. Decrease business chart diagram vectors Growth and decline chart icon. Green upward and red downward arrow symbol
Free with trial An african-american stressed man with going down chart on a background vector flat design illustration isolated on white background. Decrease business chart diagram vectors Man with declining chart. An african-american stressed man with going down chart on a background vector flat design illustration isolated on white background.
Free with trial Businesswoman On Falling Down Chart. vector. Decrease business chart diagram vectors Businesswoman On Falling Down Chart.
Free with trial Viewing Progress Icon Line Design Style Finance and Business Symbol Vector Illustrations. Decrease business chart diagram vectors Viewing Progress Icon Line Design Style Finance and Business Symbol
Free with trial Understanding bar graph charts data analysis and visualization for business and financial performance metrics. Decrease business chart diagram vectors Understanding bar graph charts data analysis and visualization for business
Free with trial Business data is visually represented in black and white through various charts and graphs illustrating growth analysis and strategic planning for financial reporting showing a clear picture of market. Decrease business chart diagram vectors Black and white business data visualization with charts and graphs showing growth and analysis for financial reporting and. Business data is visually represented in black and white through various charts and graphs illustrating growth analysis and strategic planning for financial reporting showing a clear picture of market
Free with trial Dollar and chart, rising prices, money icon blank template. Decrease business chart diagram vectors Dollar and chart, rising prices, money icon blank