Free with trial Glowing neon line Global economic crisis icon isolated on blue background. World finance crisis. Vector. Decrease business chart diagram illustrations Glowing neon line Global economic crisis icon isolated on blue background. World finance crisis. Vector
Free with trial Flat icons related to financial transactions pertaining to business or personal both. Very well crafted finance icons set to be used in related projects. Grab this pack and enjoy designing. Decrease business chart diagram vectors Set of Finance Flat Icons. Flat icons related to financial transactions pertaining to business or personal both. Very well crafted finance icons set to be used in related projects. Grab this pack and enjoy designing
Free with trial Uptrend and downtrend arrow icon set. Vectors. Decrease business chart diagram illustrations Uptrend and downtrend arrow icon set. Vectors
Free with trial A striking and impactful collection of illustrations depicting a stock market crash with dramatic downward trend graphs. Decrease business chart diagram vectors Stock market crash down graph illustration. A striking and impactful collection of illustrations depicting a stock market crash with dramatic downward trend graphs
Free with trial An illustration of businessman leader watering seedling plant on bar graph with pollution smoke rising up. Climate crisis and environment policy, ESG or ecology problem concept. Decrease business chart diagram illustrations Businessman leader watering seedling plant on bar graph with pollution smoke rising up
Free with trial Doodle Graph going down illustration. Decrease business chart diagram illustrations Doodle Graph going down
Free with trial Doodle Graph going down illustration. Decrease business chart diagram illustrations Doodle Graph going down
Free with trial A wooden block tower with a red arrow pointing upwards. The blocks are stacked in a pyramid shape generated by AI. Decrease business chart diagram vectors A wooden block tower with a red arrow pointing upwards generated by AI. A wooden block tower with a red arrow pointing upwards. The blocks are stacked in a pyramid shape generated by AI
Free with trial Cycle infographic with slice circle create round object with arrow direction with 6 point stage with modern dark style for slide presentation vector. Decrease business chart diagram illustrations Cycle infographic with slice circle create round object with arrow direction with 6 point stage with modern dark style for slide
Free with trial Image of businessman standing in modern office with hands on head looking distressed at large screen displaying fluctuating financial red charts indicating bear market. Recession, stock market concept. Decrease business chart diagram illustrations Image of businessman standing in modern office with hands on head looking distressed at large screen displaying fluctuating
Free with trial Image of businessman standing in modern office with hands on head looking distressed at large screen displaying fluctuating financial red charts indicating bear market. Recession, stock market concept. Decrease business chart diagram illustrations Image of businessman standing in modern office with hands on head looking distressed at large screen displaying fluctuating
Free with trial Colorful Global economic crisis icon isolated on white background. World finance crisis. Minimalism concept. 3D render illustration. Decrease business chart diagram illustrations Colorful Global economic crisis icon isolated on white background. World finance crisis. Minimalism concept. 3D render
Free with trial Line Global economic crisis icon isolated on white background. World finance crisis. Colorful outline concept. Vector. Decrease business chart diagram illustrations Line Global economic crisis icon isolated on white background. World finance crisis. Colorful outline concept. Vector
Free with trial A wooden block tower with a red arrow pointing upwards and the numbers 1, 2, 3, 4, 5, 6, 7, 8, 9, 10 generated by AI. Decrease business chart diagram vectors A wooden block tower with a red arrow pointing upwards and the numbers 1, 2, 3 generated by AI. A wooden block tower with a red arrow pointing upwards and the numbers 1, 2, 3, 4, 5, 6, 7, 8, 9, 10 generated by AI
Free with trial Unsuccessful investments cause negative emotions in woman standing among declining charts. Girl had bad luck and lost income or investments due to crisis and lack of financial analysis. Decrease business chart diagram vectors Unsuccessful investments cause negative emotions in woman standing among declining charts
Free with trial Line Global economic crisis icon isolated on white background. World finance crisis. Abstract banner with liquid shapes. Vector. Decrease business chart diagram illustrations Line Global economic crisis icon isolated on white background. World finance crisis. Abstract banner with liquid shapes
Free with trial A stack of wooden blocks with a wooden arrow pointing upwards. The blocks are arranged in a pyramid shape, with the top block being the smallest and the bottom block being the largest generated by AI. Decrease business chart diagram vectors A stack of wooden blocks with a wooden arrow pointing upwards generated by AI. A stack of wooden blocks with a wooden arrow pointing upwards. The blocks are arranged in a pyramid shape, with the top block being the smallest and the bottom block being the largest generated by AI
Free with trial Recession concept. Falling market. The trading broker is horrified at the falling market. Financial graph down. Vector illustration isometric design. Decrease business chart diagram illustrations Recession concept. Falling market. Vector illustration isometric design. Recession concept. Falling market. The trading broker is horrified at the falling market. Financial graph down. Vector illustration isometric design.
Free with trial Recession concept. Falling market. The trading broker is horrified at the falling market. Financial graph down. Vector illustration isometric design. Decrease business chart diagram vectors Recession concept. Falling market. Vector illustration isometric design. Recession concept. Falling market. The trading broker is horrified at the falling market. Financial graph down. Vector illustration isometric design.
Free with trial Recession concept. Falling market. The trading broker is horrified at the falling market. Financial graph down. Vector illustration isometric design. Decrease business chart diagram vectors Recession concept. Falling market. Vector illustration isometric design. Recession concept. Falling market. The trading broker is horrified at the falling market. Financial graph down. Vector illustration isometric design.
Free with trial A vibrant pink graph line ascends diagonally against a dark background, representing upward growth. The image evokes a sense of dynamic increase. The style is reminiscent of a modern, technological aesthetic. The subtle grid pattern in the background adds depth, created to simulate a data visualizat. Decrease business chart diagram illustrations Uptrend. A vibrant pink graph line ascends diagonally against a dark background, representing upward growth. The image evokes a sense of dynamic increase. The style is reminiscent of a modern, technological aesthetic. The subtle grid pattern in the background adds depth, created to simulate a data visualizat
Free with trial Stock market or forex trading candlestick graph in graphic design for financial investment concept. Motion. Financial data and diagrams showing increase and decrease in profits. Decrease business chart diagram illustrations Stock market or forex trading candlestick graph in graphic design for financial investment concept. Motion. Financial
Free with trial Red downward trend graph with white falling blocks and coins on a dark red background. Concept of financial loss. 3D Rendering. Decrease business chart diagram illustrations Red downward trend graph with falling blocks and coins. 3D Rendering. Red downward trend graph with white falling blocks and coins on a dark red background. Concept of financial loss. 3D Rendering
Free with trial Woman with economic slowdown. Young girl with falling graphs and diagrams. Recession and depression, banruptcy and crysis. Landing webpage design. Cartoon flat vector illustration. Decrease business chart diagram vectors Woman with economic slowdown vector. Woman with economic slowdown. Young girl with falling graphs and diagrams. Recession and depression, banruptcy and crysis. Landing webpage design. Cartoon flat vector illustration
Free with trial This image shows a 3D bar graph, generated by AI, depicting a rise and subsequent fall in values. The red bars illustrate a peak, followed by a sharp decline, possibly representing a trend in data or market fluctuations. The visual is clean and easy to understand, highlighting the dramatic change i. Decrease business chart diagram illustrations Red 3D Bar Graph. This image shows a 3D bar graph, generated by AI, depicting a rise and subsequent fall in values. The red bars illustrate a peak, followed by a sharp decline, possibly representing a trend in data or market fluctuations. The visual is clean and easy to understand, highlighting the dramatic change i
Free with trial Cartoon stickman drawing conceptual illustration of happy family with growing arrow, Generative AI illustrations. Decrease business chart diagram illustrations Cartoon stickman drawing conceptual illustration of happy family with growing arrow, Generative AI illustrations
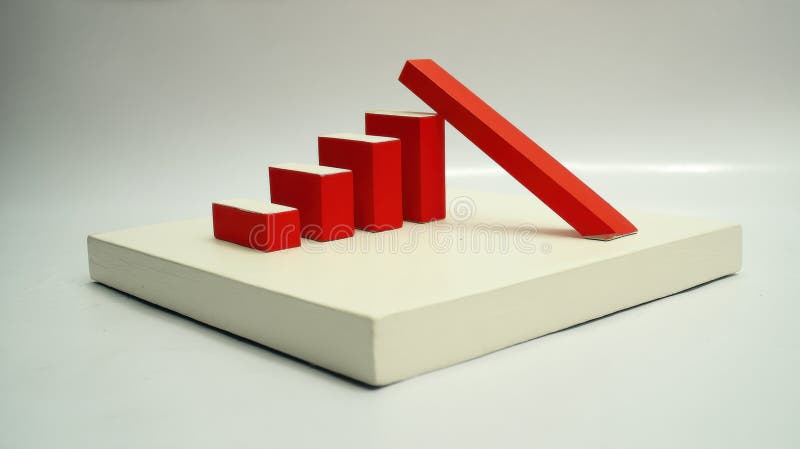
Free with trial This image shows a 3D model of a bar graph, where one bar is falling, symbolizing decline or failure. This striking visual representation was generated by AI, offering a unique perspective on downward trends and economic instability. The clean design makes it ideal for illustrating various concepts. Decrease business chart diagram illustrations Falling Bar Graph. This image shows a 3D model of a bar graph, where one bar is falling, symbolizing decline or failure. This striking visual representation was generated by AI, offering a unique perspective on downward trends and economic instability. The clean design makes it ideal for illustrating various concepts
Free with trial Businessman looking at a declining info graph. vector,illustration. Decrease business chart diagram illustrations Businessman looking at a declining info graph
Free with trial Colorful Searching for food in trash can on streets outdoors icon isolated on black background. Homelessness and poverty concept. Minimalism concept. 3D render illustration. Decrease business chart diagram illustrations Colorful Searching for food in trash can on streets outdoors icon isolated on black background. Homelessness and poverty
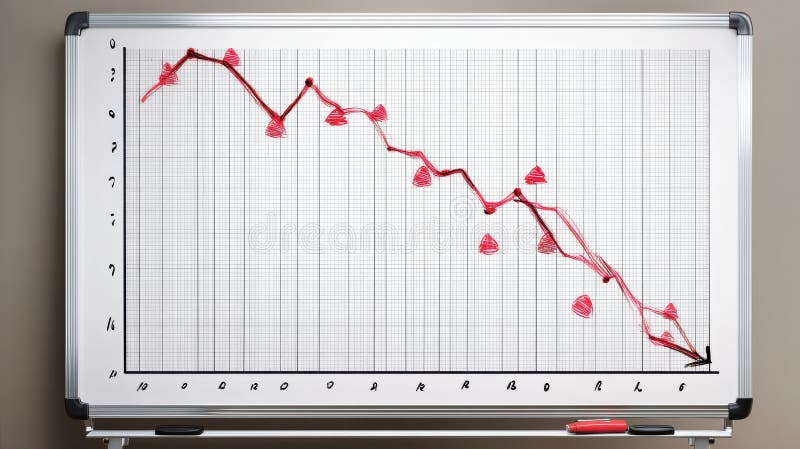
Free with trial A whiteboard displays a hand-drawn graph depicting a significant downward trend, marked by red triangles indicating decreasing values. This visual representation of a negative trend was generated by AI for illustrative purposes, possibly showcasing market decline or economic downturn. Decrease business chart diagram illustrations Downward Trend Graph. A whiteboard displays a hand-drawn graph depicting a significant downward trend, marked by red triangles indicating decreasing values. This visual representation of a negative trend was generated by AI for illustrative purposes, possibly showcasing market decline or economic downturn.
Free with trial Unemployment Rate Vector Illustration featuring individuals actively searching for Jobs Amid Economic Downturns and Financial Crises in a Background. Decrease business chart diagram vectors Unemployment Rate Vector Illustration featuring individuals actively searching for Jobs Amid Economic Downturns and Financial
Free with trial Cartoon stickman drawing conceptual illustration of businessman standing on top of a graph, Generative AI illustrations. Decrease business chart diagram illustrations Cartoon stickman drawing conceptual illustration of businessman standing on top of a graph, Generative AI illustrations
Free with trial This image shows a rolled-up graph with a red line depicting a downturn, generated by AI. It visually represents a negative trend or decline in data, potentially illustrating economic recession, market loss, or other negative statistical trends. The clean design allows for easy visualization of the. Decrease business chart diagram illustrations Declining Graph Report. This image shows a rolled-up graph with a red line depicting a downturn, generated by AI. It visually represents a negative trend or decline in data, potentially illustrating economic recession, market loss, or other negative statistical trends. The clean design allows for easy visualization of the
Free with trial High-Quality Vector Icons. Decrease business chart diagram vectors Rise icon vector, filled. High-Quality Vector Icons
Free with trial This image shows a detailed close-up of a stock market graph depicting a significant decline. The red color emphasizes the negative trend, illustrating potential losses or economic downturn. This visualization was generated by AI for analysis and presentation purposes. Decrease business chart diagram illustrations Red Market Decline Graph. This image shows a detailed close-up of a stock market graph depicting a significant decline. The red color emphasizes the negative trend, illustrating potential losses or economic downturn. This visualization was generated by AI for analysis and presentation purposes.
Free with trial Decreasing bar graph in ice cube. 3d illustration. Decrease business chart diagram illustrations Decreasing bar graph in ice cube
Free with trial A hand holds a piece of paper showing a sharply declining graph, representing a downturn in the market. The image is generated by AI and symbolizes financial loss or economic recession. Decrease business chart diagram illustrations Falling Stock Market Graph. A hand holds a piece of paper showing a sharply declining graph, representing a downturn in the market. The image is generated by AI and symbolizes financial loss or economic recession.
Free with trial Graph Down glyph vector icon isolated. Graph Down stock vector icon for web, mobile app and ui design. Decrease business chart diagram vectors Graph Down glyph vector icon
Free with trial Three orange bar graphs illustrating different data patterns increasing, decreasing, and varied. Ideal for presentations or data visualization. Simple and visually appealing design. Decrease business chart diagram illustrations Orange Bar Graph Variations. Three orange bar graphs illustrating different data patterns increasing, decreasing, and varied. Ideal for presentations or data visualization. Simple and visually appealing design.
Free with trial This 3D rendering shows a circular arrangement of red arrows pointing downwards, illustrating a negative trend. The image is generated by AI and is perfect for representing concepts like market decline, economic downturn, or loss. Decrease business chart diagram illustrations Circular Red Downward Arrow. This 3D rendering shows a circular arrangement of red arrows pointing downwards, illustrating a negative trend. The image is generated by AI and is perfect for representing concepts like market decline, economic downturn, or loss.
Free with trial Colorful Searching for food in trash can on streets outdoors icon isolated on white background. Homelessness and poverty concept. Square button. 3D render illustration. Decrease business chart diagram illustrations Colorful Searching for food in trash can on streets outdoors icon isolated on white background. Homelessness and poverty
Free with trial This image shows a red graph displaying a downward trend, generated by AI. The graph is presented on a freestanding, metallic sign, suggesting a public display of economic or market data indicating a decline or downturn. The clean, modern setting adds to the professional feel, implying a serious fi. Decrease business chart diagram illustrations AI-Generated Declining Graph. This image shows a red graph displaying a downward trend, generated by AI. The graph is presented on a freestanding, metallic sign, suggesting a public display of economic or market data indicating a decline or downturn. The clean, modern setting adds to the professional feel, implying a serious fi
Free with trial A collection of hand-drawn, black and white icons representing growth, decline, and financial concepts. The set includes upward and downward arrows, percentage symbols, and a bar graph illustrating trends. The simple line art style makes these icons versatile for various applications, including presentations, infographics, and website design. They convey concepts of progress, success, loss, and market fluctuations. Decrease business chart diagram illustrations Growth and Decline Icons Set. A collection of hand-drawn, black and white icons representing growth, decline, and financial concepts. The set includes upward and downward arrows, percentage symbols, and a bar graph illustrating trends. The simple line art style makes these icons versatile for various applications, including presentations, infographics, and website design. They convey concepts of progress, success, loss, and market fluctuations.
Free with trial A hand holds a piece of paper with a simple line graph, possibly representing data or a trend, generated by AI. The minimalist design emphasizes the visual simplicity and the concept of data representation. The image could be used to illustrate various concepts related to progress, decline, or chan. Decrease business chart diagram illustrations Hand Holding Simple Line Graph. A hand holds a piece of paper with a simple line graph, possibly representing data or a trend, generated by AI. The minimalist design emphasizes the visual simplicity and the concept of data representation. The image could be used to illustrate various concepts related to progress, decline, or chan
Free with trial This image shows a simple isometric bar graph, generated by AI. It features four black bars of varying heights against a white background, suitable for use as a minimalist graphic or logo. The clean design allows for versatile application in various contexts. Decrease business chart diagram illustrations AI-Generated Isometric Bar Graph. This image shows a simple isometric bar graph, generated by AI. It features four black bars of varying heights against a white background, suitable for use as a minimalist graphic or logo. The clean design allows for versatile application in various contexts.
Free with trial This image showcases six vibrant icons representing various data visualization methods, including pie charts, bar graphs, and gauges. These colorful and engaging visuals are perfect for presentations or reports and were generated by AI. They offer a quick and easy way to represent data in a clear a. Decrease business chart diagram illustrations Colorful Data Visualization Icons. This image showcases six vibrant icons representing various data visualization methods, including pie charts, bar graphs, and gauges. These colorful and engaging visuals are perfect for presentations or reports and were generated by AI. They offer a quick and easy way to represent data in a clear a
Free with trial The stock market crash is depicted with a red graph, symbolizing financial loss and economic decline. The crisis represents a significant downturn in investment. Decrease business chart diagram illustrations Stock market crash with red graph. The stock market crash is depicted with a red graph, symbolizing financial loss and economic decline. The crisis represents a. The stock market crash is depicted with a red graph, symbolizing financial loss and economic decline. The crisis represents a significant downturn in investment.
Free with trial This image showcases a downward trending graph, generated by AI, represented by a red arrow descending within a transparent glass structure. The visual effectively communicates decline or negative growth. The clean, minimalist design enhances the impact of the falling trend. Decrease business chart diagram illustrations Decreasing Trend: AI-Generated Graph. This image showcases a downward trending graph, generated by AI, represented by a red arrow descending within a transparent glass structure. The visual effectively communicates decline or negative growth. The clean, minimalist design enhances the impact of the falling trend.
Free with trial A hand holding a piece of paper with a graph on it. The graph shows a downward trend, which could indicate a decrease in sales or a decline in a particular metric. Decrease business chart diagram illustrations A hand holding a piece of paper with a graph on it
Free with trial Decreasing bar graph behind magnifying glass. 3d render. Decrease business chart diagram illustrations Decreasing bar graph behind magnifying glass
Free with trial Stock market crash. Red 3D down arrow and 3D coins with bitcoin symbol. Cryptocurrency crash, crypto trading. Design for banners, posters and advertising materials. Vector illustration. Decrease business chart diagram vectors Stock market crash. Red 3D down arrow and 3D coins with bitcoin symbol. Cryptocurrency crash
Free with trial This image depicts a downward trending graph, generated by AI, illustrating a sharp decline in market performance. The 3D rendered red arrow emphasizes the severity of the fall. It symbolizes economic downturn, financial crisis, or market instability. Decrease business chart diagram illustrations Declining Market Trends. This image depicts a downward trending graph, generated by AI, illustrating a sharp decline in market performance. The 3D rendered red arrow emphasizes the severity of the fall. It symbolizes economic downturn, financial crisis, or market instability.
Free with trial Graphic illustration of a downward trending red arrow over blue and red vertical bar graph on a light grey background. Image. Decrease business chart diagram illustrations Bar Graph with Decreasing Trend Line. Graphic illustration of a downward trending red arrow over blue and red vertical bar graph on a light grey background. Image
Free with trial A graph with a red arrow pointing upward. The graph is orange and blue. The graph is a representation of a trend or growth. Decrease business chart diagram vectors A graph with a red arrow pointing upward
Free with trial A single image file depicting two side-by-side illustrations showing a person reviewing tax information on a laptop. The left illustration visualizes a negative tax analysis scenario with a downward trending graph and red indicators. The right illustration contrasts this with a positive tax analysis scenario, showing an upward trending graph, dollar sign, coins and green indicators, illustrating both potential tax decreases and benefits. Decrease business chart diagram vectors Contrasting Tax Analysis Scenarios on Laptop. A single image file depicting two side-by-side illustrations showing a person reviewing tax information on a laptop. The left illustration visualizes a negative tax analysis scenario with a downward trending graph and red indicators. The right illustration contrasts this with a positive tax analysis scenario, showing an upward trending graph, dollar sign, coins and green indicators, illustrating both potential tax decreases and benefits
Free with trial Collection of red infographic elements including charts, graphs, diagrams and icons. Perfect for presentations, reports, and data visualization. Clean, modern design. Decrease business chart diagram illustrations Red Infographic Elements
Free with trial Graph and arrow red stock marketing fall background. economy finance crisis low investment. Decrease business chart diagram vectors Graph and arrow red stock marketing fall background. economy finance
Free with trial Illustration of scissors cutting into a stack of paper; stacks decreasing in height. Gold and turquoise palette. Image. Decrease business chart diagram illustrations Scissors Cutting a Stacked Paper Graph. Illustration of scissors cutting into a stack of paper; stacks decreasing in height. Gold and turquoise palette. Image
Free with trial This vibrant, wavy graph, generated by AI, displays data progression using a color-coded system. The gradual color shift from green to red signifies a change in values, making it ideal for representing various trends or metrics. The accompanying key provides additional clarity. Decrease business chart diagram illustrations Colorful AI-Generated Data Visualization. This vibrant, wavy graph, generated by AI, displays data progression using a color-coded system. The gradual color shift from green to red signifies a change in values, making it ideal for representing various trends or metrics. The accompanying key provides additional clarity.
Free with trial Downward Trend Financial Graph Illustration. Decrease business chart diagram vectors Downward Trend Financial Graph Illustration
Free with trial This image shows a hand-drawn graph depicting a sharp decline, generated by AI for illustrative purposes. It's a simple yet effective visual representation of negative growth or market downturn, useful for presentations or reports. Decrease business chart diagram illustrations Downward Trend on Whiteboard. This image shows a hand-drawn graph depicting a sharp decline, generated by AI for illustrative purposes. It's a simple yet effective visual representation of negative growth or market downturn, useful for presentations or reports.
Free with trial Statistic Up icon outline collection or set in black and white. Decrease business chart diagram vectors Statistic Up icon Line Art Logo set. Statistic Up icon outline collection or set in black and white
Free with trial Hand drawing a graph about real estate market trends - concept image. Decrease business chart diagram illustrations Hand drawing a graph about real estate market trends
Free with trial Global stock market crash concept with red downward arrows and world map. Clean, light background illustrating financial recession and crisis. 3D Rendering. Decrease business chart diagram illustrations Global stock market crash concept with red downward arrows and world map. 3D Rendering. Global stock market crash concept with red downward arrows and world map. Clean, light background illustrating financial recession and crisis. 3D Rendering
Free with trial This image shows a whiteboard displaying a graph with a downward trending red line, generated by AI. The visual clearly represents a negative trend or decline in a certain metric. The use of a whiteboard suggests a presentation or meeting context. Decrease business chart diagram illustrations Declining Trend on Whiteboard. This image shows a whiteboard displaying a graph with a downward trending red line, generated by AI. The visual clearly represents a negative trend or decline in a certain metric. The use of a whiteboard suggests a presentation or meeting context.
Free with trial A red arrow is showing the trend of the market to a downtrend. Background for the economy and data analysis. Decrease business chart diagram vectors Red Downtrend Arrow Object Abstract Background. A red arrow is showing the trend of the market to a downtrend. Background for the economy and data analysis.
Free with trial Financial loss icon design vector illustration. Decrease business chart diagram vectors Financial loss icon design vector illustration
Free with trial Economic Loss icon outline collection or set in black and white. Decrease business chart diagram vectors Economic Loss icon Line Art Logo set. Economic Loss icon outline collection or set in black and white
Free with trial White downtrend arrow on black asphalt,. Decrease business chart diagram illustrations Downtrend economic arrow on blacktop, AI generated. White downtrend arrow on black asphalt,
Free with trial This 3D rendered image shows a red arrow pointing downwards, illustrating a negative trend. The graphic, generated by AI, is a visual representation of declining values or a market downturn, perfect for illustrating economic reports or presentations. Decrease business chart diagram illustrations Red Downward Trend. This 3D rendered image shows a red arrow pointing downwards, illustrating a negative trend. The graphic, generated by AI, is a visual representation of declining values or a market downturn, perfect for illustrating economic reports or presentations.
Free with trial The image shows a downward trending line, illuminated with a bright blue glow, resembling a graph or chart. the line starts high on the left and descends diagonally to the lower right, ending in an arrow pointing downwards. the background is a dark, metallic texture, lit by several spotlights from above, creating a dramatic effect. the floor reflects the blue light, adding depth to the scene. the overall impression is one of decline or failure, possibly related to business or finance. Decrease business chart diagram illustrations Declining trend line with arrow in spotlight. the image shows a downward trending line, illuminated with a bright blue glow, resembling a graph or chart. the line starts high on the left and descends diagonally to the lower right, ending in an arrow pointing downwards. the background is a dark, metallic texture, lit by several spotlights from above, creating a dramatic effect. the floor reflects the blue light, adding depth to the scene. the overall impression is one of decline or failure, possibly related to business or finance.
Free with trial A turquoise moon hovers above a stock market graph with rising and falling arrows indicating market trends, useful for illustrating financial concepts. Decrease business chart diagram illustrations Stock Market Graph with Moon and Arrow Trends. A turquoise moon hovers above a stock market graph with rising and falling arrows indicating market trends, useful for illustrating financial concepts
Free with trial Risk Management Analysis Graph with Warning Signs, generative Ai. Decrease business chart diagram illustrations Risk Management Analysis Graph with Warning Signs
Free with trial Red fall arrow on graphs and charts. Space for text. Decrease business chart diagram illustrations Red fall arrow on graphs and charts. Space for text.
Free with trial An illustrative image representing the concept of reducing carbon emissions and promoting environmental sustainability. The artwork depicts hands interacting with paper cutouts of factories, CO2 clouds, and green leaves, symbolizing efforts to combat pollution and promote a cleaner environment. The image suggests a transition towards a greener future, with decreasing emissions and positive environmental impact. Suitable for illustrating topics like climate change, environmental protection, and sustainable development. Decrease business chart diagram illustrations Reducing Carbon Emissions: Environmental Concept. An illustrative image representing the concept of reducing carbon emissions and promoting environmental sustainability. The artwork depicts hands interacting with paper cutouts of factories, CO2 clouds, and green leaves, symbolizing efforts to combat pollution and promote a cleaner environment. The image suggests a transition towards a greener future, with decreasing emissions and positive environmental impact. Suitable for illustrating topics like climate change, environmental protection, and sustainable development.
Free with trial Green marble bar graph showing a downward trend. Created with the help of Generative AI tools. Decrease business chart diagram illustrations Green marble bar graph showing a downward trend.
Free with trial A stack of coins with a green arrow pointing down. The coins are stacked on top of each other, with the bottom coin being the largest. Concept of decline or decrease, as the arrow points downward. Decrease business chart diagram illustrations A stack of coins with a green arrow pointing down
Free with trial A 3D-rendered image depicts a sharply declining red arrow on a bar graph, symbolizing a significant market downturn. The graph is set against a solid blue background. Decrease business chart diagram illustrations 3D Render of a Dramatic Stock Market Crash Graph. A 3D-rendered image depicts a sharply declining red arrow on a bar graph, symbolizing a significant market downturn. The graph is set against a solid blue background.
Free with trial A red down arrow on a transparent white background. Decrease business chart diagram vectors A red down arrow on a transparent white background
Free with trial Set of red arrow going down stock icon. Symbol of downward arrow graph. Symbol of down arrow market graph. Decrease business chart diagram vectors Set of red arrow going down stock icon. Symbol of downward arrow graph. Symbol of down arrow market graph