Free with trial Business crisis concept. money fall down with arrow decrease symbol. economy stretching rising drop, global lost bankrupt. cost declining reduction or loss of income with dollar flag. Decrease business graph vectors Business crisis concept. money fall down with arrow decrease symbol. economy stretching rising drop, global lost bankrupt. cost
Free with trial This minimal illustration depicts a business stock exchange downturn. The vector concept uses a red arrow symbol to represent a market crash, financial loss, and a minimalist decrease in value. Decrease business graph vectors Minimal Vector Concept of a Business Stock Exchange Market Downturn and Financial Crash Symbol Illustration. This minimal illustration depicts a business stock exchange downturn. The vector concept uses a red arrow symbol to represent a market crash, financial loss, and a minimalist decrease in value.
Free with trial Two businessmen desperately hold a falling arrow graph with flying money bills, symbolizing inflation, crisis, and business failure, isolated on white background vector illustration. Decrease business graph vectors Businessmen struggle with falling financial graph. Two businessmen desperately hold a falling arrow graph with flying money bills, symbolizing inflation, crisis, and business failure, isolated on white background vector illustration
Free with trial Financial 3D graph showing decrease in profits. Decrease business graph illustrations Financial 3D graph
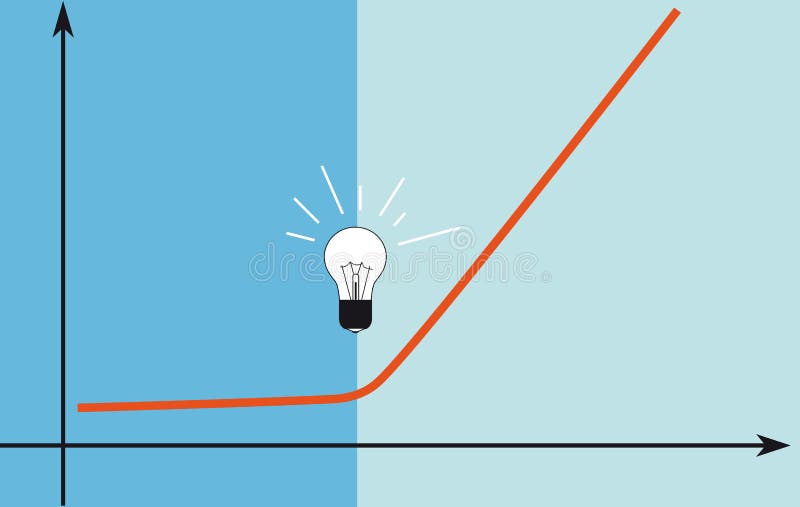
Free with trial Graph, representing an impact of a disruptive innovation in business, EPS 8 vector illustration. Decrease business graph vectors Disruptive idea in business. Graph, representing an impact of a disruptive innovation in business, EPS 8 vector illustration
Free with trial Simple Set of Increase and Decrease Related Vector Line Icons. Contains such Icons as Finance Chart, Abstract Graph, Trend and more. Editable Stroke. 48x48 Pixel Perfect. Decrease business graph vectors Line Increase and Decrease Icons. Simple Set of Increase and Decrease Related Vector Line Icons. Contains such Icons as Finance Chart, Abstract Graph, Trend and more. Editable Stroke. 48x48 Pixel Perfect.
Free with trial Down trend Stock market or forex trading graph in graphic concept suitable for financial investment or Economic trends business idea and all art work design. Abstract finance background. Decrease business graph illustrations Stock market or forex trading graph in graphic concept suitable
Free with trial Flat 3d Isometric Businessman Slipping on Falling Graph. Business Crisis Concept. Decrease business graph vectors Isometric Businessman Slipping on Falling Graph
Free with trial 3D Illustration of business chart decrease. Decrease business graph illustrations Chart decrease
Free with trial Business life shareholder in suit near the graph and frustrated executive director scene concept vector illustration. Decrease business graph vectors Business life shareholder scene. Business life shareholder in suit near the graph and frustrated executive director scene concept vector illustration
Free with trial Freehand drawing of businesswoman atop height in a growth chart facing an economic reset with value losses. Business metaphor for recession, investment, entrepreneurship, risk, decrease, crisis. Decrease business graph illustrations Drawn Business Woman Facing Economic Crash. Freehand drawing of businesswoman atop height in a growth chart facing an economic reset with value losses. Business metaphor for recession, investment, entrepreneurship, risk, decrease, crisis
Free with trial Income fall. Business recession and financial losses vector illustration, arrow down money budget low, stocks reduction and expenses costs concept, profitability crisis graph downward. Decrease business graph vectors Income fall graph downward. Income fall. Business recession and financial losses vector illustration, arrow down money budget low, stocks reduction and expenses costs concept, profitability crisis graph downward
Free with trial Arrow graph going up illustration isolated on white background. Business chart cartoon. Decrease business graph illustrations Arrow graph going up illustration isolated on white background
Free with trial Bad finance graph. Loss of financial savings, inflation schedule and money loss. Bankruptcy, financial investment loss or market debt crisis. Low finance business isolated vector illustration. Decrease business graph vectors Bad finance graph. Loss of financial savings, inflation schedule and money loss. Bankruptcy vector illustration. Bad finance graph. Loss of financial savings, inflation schedule and money loss. Bankruptcy, financial investment loss or market debt crisis. Low finance business isolated vector illustration
Free with trial Businessman sets a goal about business development and income growth, man strives forward and upward on the growing graph to the piggy bank, banner. Flat vector illustration. Decrease business graph vectors Businessman sets a goal about business development and income growth, man strives forward and upward on the growing
Free with trial Graph showing decrease in profits or earnings in 3D on white background. Decrease business graph illustrations Graph showing decrease in profits or earnings
Free with trial Financial 3D graph showing decrease in profits. Decrease business graph illustrations Financial 3D graph
Free with trial Business graph showing falling trend with arrow for recession and financial loss. Decrease business graph vectors Business crisis chart with falling arrow. Business graph showing falling trend with arrow for recession and financial loss
Free with trial Business person examines financial data on a laptop, focusing on a declining graph and calculation symbols. The vector illustration highlights financial challenges and downturns faced by investments. Decrease business graph vectors Business Crisis Analysis with Falling. Business person examines financial data on a laptop, focusing on a declining graph and calculation symbols. The vector illustration highlights financial challenges and downturns faced by investments.
Free with trial Broker trader analyzing economic crisis. Trade exchange, financial decrease, bed business strategy, digital asset, loss investment fund, online broker, stock collapse and crisis concept. Decrease business graph vectors Broker trader analyzing economic crisis. Trade exchange, financial decrease
Free with trial 3d Small People - loss graph symbol vector image design. Worried man about business render banner template background. Decrease business graph vectors 3d Small People - loss graph symbol
Free with trial Business finance crisis concept, low sales. Money fall down symbol. Arrow decrease economy stretching rising drop. Lost crisis bankrupt declining. Cost reduction. Loss of income. vector illustration. Decrease business graph vectors Business finance crisis concept, low sales. Money fall down symbol. Arrow decrease economy stretching rising drop. Lost crisis
Free with trial A dramatic visual depicting a severe market crash or economic downturn. A vivid red line graph sharply descends, culminating in a downward-pointing arrow, set against a dark, stormy sky infused with abstract digital code elements. The reflective, gridded ground mirrors the ominous trend, amplifying the sense of crisis. This powerful image effectively conveys concepts of financial loss, business failure, data decline, and economic recession, making it suitable for news, financial reports, or presentations on negative market trends and risk. Decrease business graph illustrations Market Crash and Economic Downturn: Red Graph in Digital Storm. A dramatic visual depicting a severe market crash or economic downturn. A vivid red line graph sharply descends, culminating in a downward-pointing arrow, set against a dark, stormy sky infused with abstract digital code elements. The reflective, gridded ground mirrors the ominous trend, amplifying the sense of crisis. This powerful image effectively conveys concepts of financial loss, business failure, data decline, and economic recession, making it suitable for news, financial reports, or presentations on negative market trends and risk.
Free with trial A 3D human character pushes against a collapsing red bar chart with a downward arrow, a business conception of preventing financial loss and crisis. Decrease business graph illustrations 3D Human Character Trying to Stop a Falling Red Business Graph. A 3D human character pushes against a collapsing red bar chart with a downward arrow, a business conception of preventing financial loss and crisis
Free with trial Small human figures stand by the word JOBS and a falling red arrow, a business conception representing unemployment, job loss, and economic recession. Decrease business graph illustrations Job Loss and Unemployment Business Conception with Falling Graph. Small human figures stand by the word JOBS and a falling red arrow, a business conception representing unemployment, job loss, and economic recession
Free with trial Infographic elements. Business design concept and line icon set. Vector infographic icons, recession business chart. Flat blue downward arrow and line icons. Process of decrease business. Decrease business graph vectors Recession Business Infographic Concept. Infographic elements. Business design concept and line icon set. Vector infographic icons, recession business chart. Flat blue downward arrow and line icons. Process of decrease business
Free with trial A sad 3D person stands before a downward-trending red arrow and bar chart, a business conception of financial crisis, failure, and economic recession. Decrease business graph illustrations Sad 3D Human Character with a Falling Business Graph in the Background. A sad 3D person stands before a downward-trending red arrow and bar chart, a business conception of financial crisis, failure, and economic recession
Free with trial Cost down business graph illustration design over a white background. Decrease business graph illustrations Cost down business graph illustration
Free with trial Manager with glasses shows his business plan. There is an infographic on the whiteboard with decrease graph turning to increase graph. Decrease business graph illustrations Manager with business plan. Manager with glasses shows his business plan. There is an infographic on the whiteboard with decrease graph turning to increase graph.
Free with trial Economic Meltdown and Business decrease and profit reduction as clouds in a sky as a financial graph declining due to loss with an arrow in arrow pointing down as a finance concept for inflation deflation,stagflation and economic downturn. Decrease business graph illustrations Economic Meltdown
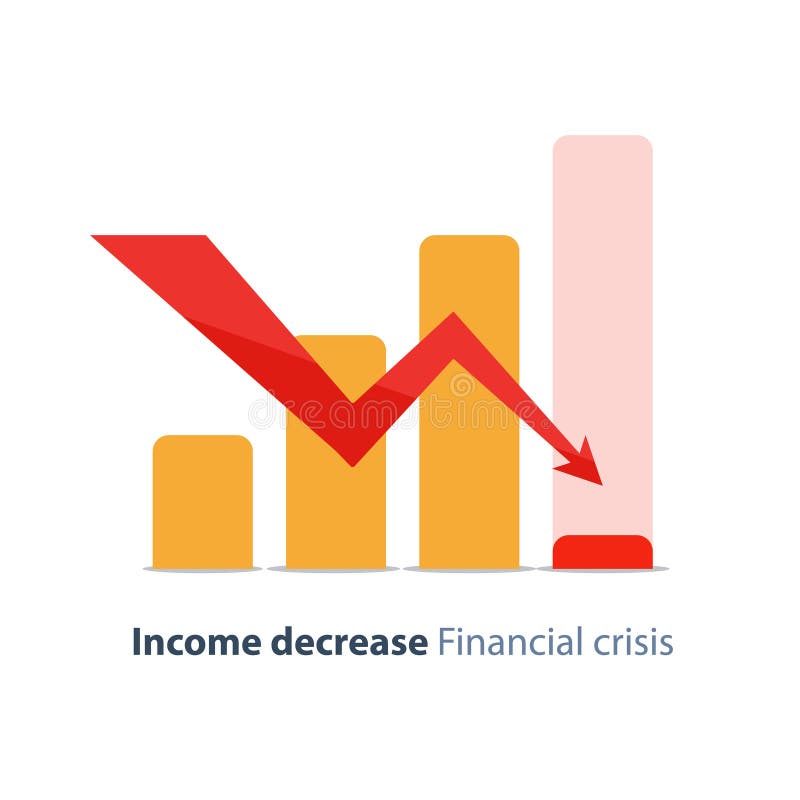
Free with trial Income decrease graph, financial crisis rate, revenue decline chart, economy downturn, investment risk, fund management, budget deficit, vector illustration, flat icon. Decrease business graph vectors Budget deficit, income decrease, economy decline, financial crisis, investment risk. Income decrease graph, financial crisis rate, revenue decline chart, economy downturn, investment risk, fund management, budget deficit, vector illustration, flat icon
Free with trial Income decrease graph, financial crisis rate, revenue decline chart, economy downturn, investment risk, fund management, budget deficit, vector illustration, flat icon. Decrease business graph vectors Budget deficit, income decrease, economy decline, financial crisis, investment risk. Income decrease graph, financial crisis rate, revenue decline chart, economy downturn, investment risk, fund management, budget deficit, vector illustration, flat icon
Free with trial Abstract financial crisis background featuring a red line graph plunging downward on a digital grid. Symbolizing stock market crash, economic recession, business failure, and bankruptcy risk. Professional 3D render for finance, investment, and global economy concepts. Decrease business graph illustrations Financial stock market crash and economic crisis concept with red falling graph. Abstract financial crisis background featuring a red line graph plunging downward on a digital grid. Symbolizing stock market crash, economic recession, business failure, and bankruptcy risk. Professional 3D render for finance, investment, and global economy concepts.
Free with trial 3D Graph Illustrating Fall and Decrease. Decrease business graph illustrations Fall Graph. 3D Graph Illustrating Fall and Decrease
Free with trial A clean, minimalist icon representing an analytics graph. It features a series of vertical bars of varying heights, symbolizing data or trends. A line graph with circular data points connects the tops of some of the bars, illustrating growth, progress, or fluctuations over time. This graphic is ideal for representing business intelligence, financial data, research, or any concept related to data analysis and performance. Decrease business graph vectors Analytics Graph Icon with Data Points. A clean, minimalist icon representing an analytics graph. It features a series of vertical bars of varying heights, symbolizing data or trends. A line graph with circular data points connects the tops of some of the bars, illustrating growth, progress, or fluctuations over time. This graphic is ideal for representing business intelligence, financial data, research, or any concept related to data analysis and performance.
Free with trial Cost down reduction concept. Cost down. Businessman with his hand lowers the arrow of the graph. Vector illustration flat design. Isolated on background. Decrease down profit. Declining chart. Decrease business graph vectors Cost down reduction concept. Cost down. Businessman with his hand lowers the arrow of the graph. Vector illustration
Free with trial A simple black icon featuring a house symbol over a bar graph showing a downward trend, indicating a decrease in. Decrease business graph illustrations Downward trend graph with house icon. A simple black icon featuring a house symbol over a bar graph showing a downward trend, indicating a decrease in.
Free with trial Loss graph symbol colorful icon vector web image design loss business decreasing concept. Decrease business graph vectors Loss graph symbol vector image design. Loss graph symbol colorful icon vector web image design loss business decreasing concept
Free with trial Brown sad face beside a statistical graph with downward trends. Ideal for failure, economic loss, low performance, recession, disappointment, market analysis, simple flat metaphor. Decrease business graph vectors Downward Business Trends Illustrated by Sad Face and Declining Graph. Brown sad face beside a statistical graph with downward trends. Ideal for failure, economic loss, low performance, recession, disappointment, market analysis, simple flat metaphor
Free with trial A cartoon woman with brown hair in a ponytail, wearing a blue shirt and red pants, stands confidently between two bar graphs. The green graph on the left shows an increase, while the purple graph on the right shows a decrease. The image is a simple, illustrative representation of data analysis or business concepts. Decrease business graph vectors Woman Standing Between Two Bar Graphs. A cartoon woman with brown hair in a ponytail, wearing a blue shirt and red pants, stands confidently between two bar graphs. The green graph on the left shows an increase, while the purple graph on the right shows a decrease. The image is a simple, illustrative representation of data analysis or business concepts.
Free with trial A minimalist, black and white vector illustration depicting a financial graph with a clear downward trend. The graph features a jagged line representing fluctuating data, leading into a bold, thick arrow pointing downwards and to the right. This icon symbolizes decline, loss, recession, or negative performance in various contexts, such as business, economics, or stock markets. Its clean design makes it versatile for presentations, websites, and infographics. Decrease business graph vectors Downward Trend Graph with Arrow Icon. A minimalist, black and white vector illustration depicting a financial graph with a clear downward trend. The graph features a jagged line representing fluctuating data, leading into a bold, thick arrow pointing downwards and to the right. This icon symbolizes decline, loss, recession, or negative performance in various contexts, such as business, economics, or stock markets. Its clean design makes it versatile for presentations, websites, and infographics.
Free with trial A minimalist, black and white graphic representing a downward trend. A thick, bold arrow points diagonally down and to the right, symbolizing a decline. Below it, a jagged, irregular line graph mirrors this downward trajectory, depicting volatility and a general decrease. This imagery is ideal for illustrating financial losses, market downturns, negative performance, or any concept of falling or decreasing values. Decrease business graph vectors Down Trend Arrow and Jagged Line Graph. A minimalist, black and white graphic representing a downward trend. A thick, bold arrow points diagonally down and to the right, symbolizing a decline. Below it, a jagged, irregular line graph mirrors this downward trajectory, depicting volatility and a general decrease. This imagery is ideal for illustrating financial losses, market downturns, negative performance, or any concept of falling or decreasing values.
Free with trial Cost reduction and crisis financial. Business and finances concepts. A businessman is cutting expenses. Piggy bank with tighten belt. Graph with descending curve. Decrease business graph vectors Business and finances concepts. Cost reduction and crisis financial. Businessman. Piggy bank with tighten belt. Cost reduction and crisis financial. Business and finances concepts. A businessman is cutting expenses. Piggy bank with tighten belt. Graph with descending curve
Free with trial Increase and decrease line icons. Growth and fall symbols for web page and application UI. Vector up and down editable set business profit and loss. Decrease business graph vectors Increase and decrease line icons. Growth and fall symbols for web page and application UI. Vector up and down editable
Free with trial Money loss vector illustration cash with down arrow stocks graph. Bad finance graph. Financial crisis, investment expenses, economic depression bankruptcy business. Cash loss graph. Decrease business graph vectors Money loss vector illustration cash with down arrow stocks graph. Bad finance graph. Financial crisis, investment
Free with trial Economic recession. The decline of the stock market. The bear market graph. Risk of business investing. Financial crisis. Prospects of the economic downturn. GDP falls. Decrease business graph vectors Economic recession graph. Economic recession. The decline of the stock market. The bear market graph. Risk of business investing. Financial crisis. Prospects of the economic downturn. GDP falls
Free with trial Stack of money with colorful arrow pointing down showing decrease - Financial concept. Decrease business graph illustrations Stack of money with graph showing decrease. Stack of money with colorful arrow pointing down showing decrease - Financial concept
Free with trial Analysis audit sales growth report icon vector modern comparing with loss failure statistics business data performance set sign symbol, progress assessment strategy vs recession decrease graph clipart. Decrease business graph vectors Analysis audit sales growth report icon vector modern comparing with loss failure statistics business data performance set sign. Symbol, progress assessment. Analysis audit sales growth report icon vector modern comparing with loss failure statistics business data performance set sign symbol, progress assessment strategy vs recession decrease graph clipart
Free with trial Downward graph trend with red points, sad face, and a file folder suggests failure, loss, or poor performance. Ideal for business, data, analysis, decline management error simple flat metaphor. Decrease business graph vectors Declining Graph with Sad Face Emphasizing Negative Analytics and Data Loss. Downward graph trend with red points, sad face, and a file folder suggests failure, loss, or poor performance. Ideal for business, data, analysis, decline management error simple flat metaphor
Free with trial Business crisis for female manager sitting on unstable chart, near hand with pencil. Graph of sharp decrease in profitability and volatility caused by financial and economic crisis. Decrease business graph vectors Business crisis for female manager sitting on unstable chart, near hand with pencil
Free with trial Economic recession. The decline of the stock market. The bear market graph. Risk of business investing. Financial crisis. Prospects of the economic downturn. GDP falls. Decrease business graph vectors Recession business and stock. Economic recession. The decline of the stock market. The bear market graph. Risk of business investing. Financial crisis. Prospects of the economic downturn. GDP falls
Free with trial Downward trending line graph with sad face emotion, classic phone icon, and computer monitor. Ideal for business loss, analytics, communication issues, technology, finance, statistics simple flat. Decrease business graph vectors Declining Sales Graph with Sad Face, Phone Icon, and Monitor Display. Downward trending line graph with sad face emotion, classic phone icon, and computer monitor. Ideal for business loss, analytics, communication issues, technology, finance, statistics simple flat
Free with trial Sad face beside sales trend line graph indicating decrease. Empty basket symbolizes low retail activity. Ideal for business decline, loss, market crisis, consumer struggle, analytics, recession. Decrease business graph illustrations Declining Sales Chart with Sad Face and Empty Shopping Basket. Sad face beside sales trend line graph indicating decrease. Empty basket symbolizes low retail activity. Ideal for business decline, loss, market crisis, consumer struggle, analytics, recession
Free with trial Funny pizza slice cartoon character presenting a sales report bar graph. This vector illustration is perfect for business analysis, food industry, and creative presentations about market trends. Decrease business graph illustrations Pizza Sales Report Cartoon Icon, Business Analysis Concept. Funny pizza slice cartoon character presenting a sales report bar graph. This vector illustration is perfect for business analysis, food industry, and creative presentations about market trends.
Free with trial Bar graph with varying heights beside a line chart with rising and falling pattern on a grid. Ideal for business analysis, statistics, metrics, trends, presentation, infographics, simple flat. Decrease business graph illustrations Data Visualization with Bar Graph and Line Chart in Minimalist Design. Bar graph with varying heights beside a line chart with rising and falling pattern on a grid. Ideal for business analysis, statistics, metrics, trends, presentation, infographics, simple flat
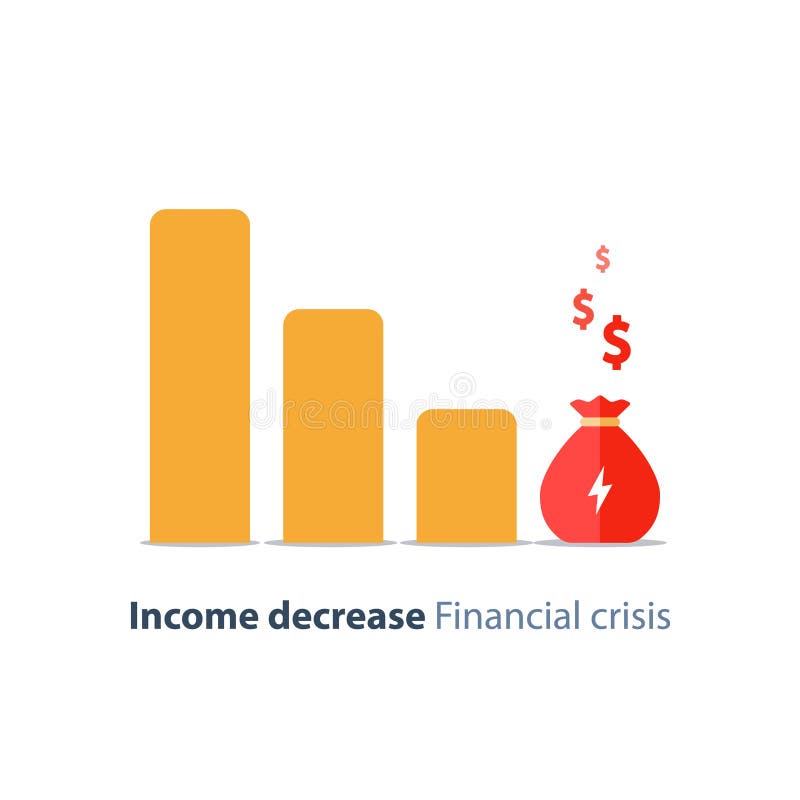
Free with trial Budget deficit, finance shrinkage, income decrease, business devaluation, corporate expenses, financial burden, negative trend, vector icon, flat illustration. Decrease business graph vectors Financial shrinkage, business devaluation, budget deficit, corporate expenses, income lowering, vector icon. Budget deficit, finance shrinkage, income decrease, business devaluation, corporate expenses, financial burden, negative trend, vector icon, flat illustration
Free with trial Budget deficit, finance shrinkage, income decrease, business devaluation, corporate expenses, financial burden, negative trend, vector icon, flat illustration. Decrease business graph vectors Financial shrinkage, business devaluation, budget deficit, corporate expenses, income lowering, vector icon. Budget deficit, finance shrinkage, income decrease, business devaluation, corporate expenses, financial burden, negative trend, vector icon, flat illustration
Free with trial Businessman and stock market arrow presentation. Business profits presentation concept. Cheerful businessman with graph indicating increase. The concept of business success. Vector illustration. Decrease business graph vectors Businessman and stock market arrow presentation.Business profits
Free with trial Red Downward Arrow Graph Trend on White Background, Decline Business Concept, Falling Market Indicator. Decrease business graph vectors Red Downward Arrow Graph Trend on White Background
Free with trial A professional collection of 16 business and financial icons featuring various bar charts and line graphs. Perfect for UI dashboards, corporate presentations, and data-heavy infographics showing market growth or decline. Decrease business graph vectors Business Growth Bar Charts and Financial Trend Line Graph Vector Icons Set. A professional collection of 16 business and financial icons featuring various bar charts and line graphs. Perfect for UI dashboards, corporate presentations, and data-heavy infographics showing market growth or decline.
Free with trial A professional collection of 16 business and financial icons featuring various bar charts and line graphs. Perfect for UI dashboards, corporate presentations, and data-heavy infographics showing market growth or decline. Decrease business graph vectors Business Growth Bar Charts and Financial Trend Line Graph Vector Icons Set. A professional collection of 16 business and financial icons featuring various bar charts and line graphs. Perfect for UI dashboards, corporate presentations, and data-heavy infographics showing market growth or decline.
Free with trial US Business fail graph illustration design over white. Decrease business graph illustrations US Business fail graph
Free with trial Graph with curve, labeled axes, data table, hand with coin, and dollar symbols. Ideal for finance, business, economy, investment data visualization analytics simple landing page. Decrease business graph illustrations Financial graph with data table, hand receiving coins, and analysis concept design. Graph with curve, labeled axes, data table, hand with coin, and dollar symbols. Ideal for finance, business, economy, investment data visualization analytics simple landing page
Free with trial Line graph showing downward trend, large sad face, smaller happy face, and individual figure. Ideal for performance analysis, emotions tracking, business trends, psychology, market research feedback. Decrease business graph vectors Declining Performance Graph with Emotions and Individual Representation. Line graph showing downward trend, large sad face, smaller happy face, and individual figure. Ideal for performance analysis, emotions tracking, business trends, psychology, market research feedback
Free with trial Declining Bar Graph with Downward Arrow, Business Loss and Negative Growth Concept on White Background. Decrease business graph vectors Declining Bar Graph with Downward Arrow, Business Loss
Free with trial A modern flat design graphic set featuring two icons: opposing arrows indicating increase decrease and a bar chart showing financial growth or decline, perfect for business concepts. Decrease business graph vectors Increase and decrease arrows with bar chart icon. A modern flat design graphic set featuring two icons: opposing arrows indicating increase decrease and a bar chart showing financial growth or decline, perfect for business concepts
Free with trial A flat illustration of business graphs and charts showing analysis results. Featuring clean design and vibrant color scheme. Decrease business graph vectors Colorful business graph and chart flat style design. A flat illustration of business graphs and charts showing analysis results. Featuring clean design and vibrant color scheme.
Free with trial Histogram chart customizable to explain the decrease of your business Arrow Down TO KNOW: File include: EPS10 (opened with all program) fully editable with layers. Easy to custom. Decrease business graph vectors Histogram Graph like a waterfall with Red Down. Histogram chart customizable to explain the decrease of your business Arrow Down TO KNOW: File include: EPS10 (opened with all program) fully editable with layers. Easy to custom.
Free with trial Business performance, negative trends, data analysis, economic decline, search results, user concerns. Sad emoticon, graph with downward trend magnifying glass. Business and negative trends. Decrease business graph vectors Declining Graph with Sad Face and Search Bar Negative Trends and Analysis. Business performance, negative trends, data analysis, economic decline, search results, user concerns. Sad emoticon, graph with downward trend magnifying glass. Business and negative trends
Free with trial Vector cartoon stick figure drawing conceptual illustration of man or businessman falling down along the graph arrow. Business metaphor of crisis. Decrease business graph vectors Vector Cartoon of Man or Businessman Falling Down Along the Graph Arrow. Vector cartoon stick figure drawing conceptual illustration of man or businessman falling down along the graph arrow. Business metaphor of crisis.
Free with trial Red frowning face, line graph showing decline, pants, and small graph inset. Ideal for retail, business trends, economic downturn, loss, failure clothing sales simple flat metaphor. Decrease business graph illustrations Declining Sales Concept with Frowning Face, Pants, and Downward Line Graph. Red frowning face, line graph showing decline, pants, and small graph inset. Ideal for retail, business trends, economic downturn, loss, failure clothing sales simple flat metaphor
Free with trial A set of money growth and decrease icons featuring coins and directional arrows, indicating financial increase and decline. These images represent concepts of economic growth, loss, and currency fluctuation, suitable for various financial and business design projects. Decrease business graph vectors Set of Money Growth and Decrease Icons with Arrows and Coins. A set of money growth and decrease icons featuring coins and directional arrows, indicating financial increase and decline. These images represent concepts of economic growth, loss, and currency fluctuation, suitable for various financial and business design projects
Free with trial A striking red line graph dramatically descends across a dark, futuristic digital grid background, illuminated by subtle blue light. This powerful visual represents a significant financial downturn, economic crisis, market crash, or business loss. The jagged, downward-sloping line symbolizes negative trends, risk, bankruptcy, and declining profits. It's an ideal image for conveying concepts of recession, failure, warning, or critical data analysis in business, finance, and technology contexts, emphasizing a period of decline or crisis. Decrease business graph illustrations Red Declining Graph - Financial Crisis Concept. A striking red line graph dramatically descends across a dark, futuristic digital grid background, illuminated by subtle blue light. This powerful visual represents a significant financial downturn, economic crisis, market crash, or business loss. The jagged, downward-sloping line symbolizes negative trends, risk, bankruptcy, and declining profits. It's an ideal image for conveying concepts of recession, failure, warning, or critical data analysis in business, finance, and technology contexts, emphasizing a period of decline or crisis.
Free with trial Sad face beside a downward trend graph with red nodes, a pointing hand, blue card. Ideal for business loss, economic decline, poor performance, failure, recession, financial crisis simple flat. Decrease business graph vectors Declining Line Graph with Sad Face and Pointer Highlighting Negative Performance. Sad face beside a downward trend graph with red nodes, a pointing hand, blue card. Ideal for business loss, economic decline, poor performance, failure, recession, financial crisis simple flat
Free with trial Illustration of a descending bar graph with an arrow signifying decline. Percentage symbol indicates decrease. Minimalist flat style, on black background. Decrease business graph vectors Declining bar graph with percentage drop indicator icon. Illustration of a descending bar graph with an arrow signifying decline. Percentage symbol indicates decrease. Minimalist flat style, on black background.
Free with trial A set of three depicting financial decline with dollar signs and arrows. The are in black and blue colors. They feature a bar graph with a downward arrow and a dollar sign coin. The represent business, finance, and economic concepts. Decrease business graph vectors Financial decline with dollar signs and arrows graph chart. A set of three depicting financial decline with dollar signs and arrows. The are in black and blue colors. They feature a bar graph with a downward arrow and a dollar sign coin. The represent business, finance, and economic concepts
Free with trial Business man crying and looking at down arrow feeling stressed about losing money or investment. Falling red graph is metaphor for financial crisis and decreasing income from investments in startup. Decrease business graph vectors Business man crying and looking at down arrow feeling stressed about losing money or investment
Free with trial Economic downturn, financial stress, investment failure, business loss, market decline, risk. Line graph shows downward trend. Financial stress and economic downturn. Decrease business graph illustrations Financial Loss Concept with Declining Line Graph, Sad Face, and Coin Symbol. Economic downturn, financial stress, investment failure, business loss, market decline, risk. Line graph shows downward trend. Financial stress and economic downturn
Free with trial Line graph with downward trend and red markers, sad face symbolizing disappointment, outlined clouds indicating challenges. Ideal for analysis, business, growth, crisis, finance, performance or. Decrease business graph vectors Declining Graph with Sad Face and Clouds Representing Negative Trends and Challenges. Line graph with downward trend and red markers, sad face symbolizing disappointment, outlined clouds indicating challenges. Ideal for analysis, business, growth, crisis, finance, performance or