Free with trial Black and red arrow pointing downward on financial graph showing a decline. Business growth chart with falling trend line for investment analysis. Decrease business graph illustrations Black and red arrow pointing downward on financial graph showing a decline
Free with trial A business figure with hands on head, in front of a declining graph, representing financial crisis. Decrease business graph illustrations Business figure with hands on head, financial crisis concept. A business figure with hands on head, in front of a declining graph, representing financial crisis
Free with trial Set line Financial growth decrease, Hierarchy organogram chart, Graph, chart, diagram and Location. Gradient color icons. Vector. Decrease business graph vectors Set line Financial growth decrease, Hierarchy organogram chart, Graph, chart, diagram and Location. Gradient color icons
Free with trial A 3D red bar chart shows a declining trend against a white grid background. The bars decrease in height from left to right, with a red line graph following the downward trajectory. Decrease business graph illustrations Red 3 D bar chart with downward trend line on white grid background graph line graph. A 3D red bar chart shows a declining trend against a white grid background. The bars decrease in height from left to right, with a red line graph following the downward trajectory
Free with trial Black and white icon of a bar graph showing a downward trend with an arrow pointing down. Decrease business graph illustrations Downward trending bar graph with arrow indicating decrease bar chart decline. Black and white icon of a bar graph showing a downward trend with an arrow pointing down
Free with trial Stocks graph money finance market up down icon vector graphic, financial growth loss chart arrow illustration, currency inflation deflation image clipart flat, sales trade increase decrease. Decrease business graph vectors Stocks graph money finance market up down icon vector graphic, financial growth loss chart arrow illustration, currency inflation
Free with trial Basic charts line icon set. Bar diagram, pie and histogram graph. Data visualization, growth and distribution analysis for business and finance. Vector illustration Editable Stroke. Decrease business graph illustrations Basic charts line icon set. Bar diagram, pie and histogram graph. Data visualization, growth and distribution analysis
Free with trial Business Finance Crisis Concept. Blindfold Businesswoman Step by Dollar Coins near Arrow Diagram Fall Down. Decrease Economy Sale Drop. Investor Bankrupt Lost Money Cartoon Flat Vector Illustration. Decrease business graph vectors Business Finance Crisis Concept. Blindfold Businesswoman Step by Dollar Coins near Arrow Diagram Fall Down
Free with trial A woman is working on a laptop analyzing a digital graph that shows cost reduction for a successful business model She is using a pen to focus on the downward trend highlighting the strategy and financial planning for efficiency and growth This highlights digital transformation for effective business analysis and future cost management. Decrease business graph illustrations Cost Reduction Strategy Digital Transformation Business Analysis and Financial Planning for Success. A woman is working on a laptop analyzing a digital graph that shows cost reduction for a successful business model She is using a pen to focus on the downward trend highlighting the strategy and financial planning for efficiency and growth This highlights digital transformation for effective business analysis and future cost management
Free with trial A modern vector illustration of a line graph showing a clear decline, emphasized by a red downtrend arrow. Ideal for financial reports, business presentations, or data visualization projects illustrating negative trends or decreases. This graphic effectively communicates a downward movement in statistics, vector design Generative AI. Decrease business graph vectors Declining Line Graph with Red Downtrend Arrow, vector design Generative AI. A modern vector illustration of a line graph showing a clear decline, emphasized by a red downtrend arrow. Ideal for financial reports, business presentations, or data visualization projects illustrating negative trends or decreases. This graphic effectively communicates a downward movement in statistics, vector design Generative AI
Free with trial Shocked male hold document with financial graph downturn vector flat illustration. Economist guy looking on global economy crash and losing profit of company isolated. Business failure or bankruptcy. Decrease business graph vectors Shocked male hold document with financial graph downturn vector flat illustration. Economist guy looking on global
Free with trial A 3D rendering shows a financial graph with a decreasing rate. The pink arrow points downwards, indicating a loss. The bars represent data points in a business or economic context. Decrease business graph illustrations Decreasing rate financial graph on white background. A 3D rendering shows a financial graph with a decreasing rate. The pink arrow points downwards, indicating a loss. The bars represent data points in a business or economic context
Free with trial Income decrease graph, financial crisis rate, revenue decline chart, economy downturn, investment risk, fund management, budget deficit, vector illustration, flat icon. Decrease business graph vectors Budget deficit, income decrease, economy decline, financial crisis, investment risk. Income decrease graph, financial crisis rate, revenue decline chart, economy downturn, investment risk, fund management, budget deficit, vector illustration, flat icon
Free with trial A vibrant and modern illustration of a bar graph, featuring four bars of varying heights and colors: blue, green, orange, and red. The bars are positioned on a gray horizontal line, creating a sense of data comparison and visual hierarchy. This image is ideal for representing data, statistics, business reports, financial analysis, or any concept requiring visual data representation. The clean design and bright colors make it suitable for presentations, websites, and marketing materials. Decrease business graph illustrations Colorful Bar Graph Illustration. A vibrant and modern illustration of a bar graph, featuring four bars of varying heights and colors: blue, green, orange, and red. The bars are positioned on a gray horizontal line, creating a sense of data comparison and visual hierarchy. This image is ideal for representing data, statistics, business reports, financial analysis, or any concept requiring visual data representation. The clean design and bright colors make it suitable for presentations, websites, and marketing materials.
Free with trial Set of six black business charts icons showing growth and decline trends with arrows and bars in vector style clear and simple design calm. Generative AI. Decrease business graph vectors Business growth and decline charts arrows statistics bar graph icons vector illustration. Set of six black business charts icons showing growth and decline trends with arrows and bars in vector style clear and simple design calm. Generative AI
Free with trial Vector illustration concept of financial crisis. Modern illustration conceptual for banner, flyer, promotion, marketing material, online advertising, business presentation, element, resource, flat, design, social, media, character, fall, symbol, failure, simple, investment, lost, economic, down, background, graph, drop, bankruptcy, decrease, currency, graphic, lower, money, decreasing, crash, profit, rate, recession, decline, dollar, economy, reduction, rising, loss, cut, falling. Decrease business graph vectors Vector illustration concept of financial crisis. Modern illustration conceptual for banner, flyer, promotion, marketing material
Free with trial A simple line graph showing a downward trend with an arrow pointing down on a white background. Decrease business graph illustrations Downward trending line graph with arrow indicating decline business finance. A simple line graph showing a downward trend with an arrow pointing down on a white background
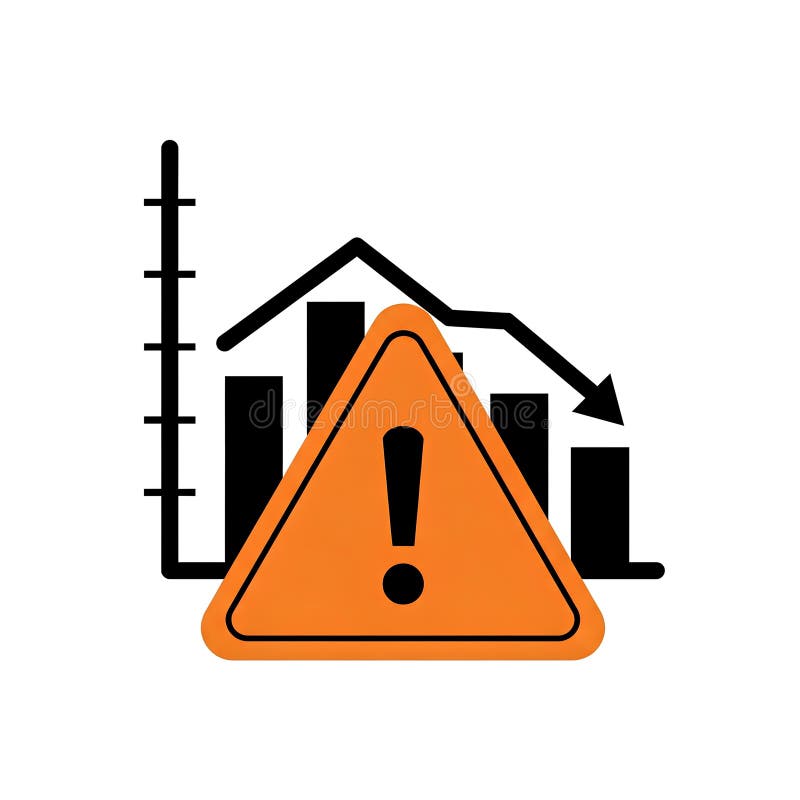
Free with trial Illustration of a downward trending graph with an orange warning sign in the foreground. The graph depicts a decline in performance or value. The warning sign highlights potential risks or negative outcomes. This image can be used to represent financial loss, economic downturn, business failure, or any situation where caution is advised. Decrease business graph illustrations Warning Sign with Declining Graph. Illustration of a downward trending graph with an orange warning sign in the foreground. The graph depicts a decline in performance or value. The warning sign highlights potential risks or negative outcomes. This image can be used to represent financial loss, economic downturn, business failure, or any situation where caution is advised.
Free with trial Economic financial crisis graph falling. Business bankruptcy and economy crash vector monocolor illustration. Decrease business graph vectors Economic financial crisis graph falling
Free with trial A simple yet effective downward sloping arrow indicating a declining trend or negative progress. This infographic element is ideal for business reports, financial charts, educational materials, or presentations needing to visualize a decrease in value or performance over time. vector design Generative AI. Decrease business graph vectors Downward Sloping Graph Arrow for Declining Trends, vector design Generative AI. A simple yet effective downward sloping arrow indicating a declining trend or negative progress. This infographic element is ideal for business reports, financial charts, educational materials, or presentations needing to visualize a decrease in value or performance over time. vector design Generative AI
Free with trial Reduction graph concept. Blue arrow depict recession business. Flat illustration of fallof arrow with shadow as an element for infographic, article background for internet, publish, social networks. Decrease business graph vectors Recession Business Concept. Reduction graph concept. Blue arrow depict recession business. Flat illustration of fallof arrow with shadow as an element for infographic, article background for internet, publish, social networks.
Free with trial Downturn showing downward trending graph with arrow indicating decline keywords: graph, chart, decline. Decrease business graph illustrations Downward Trending Graph With Arrow Indicating Decline Keywords: graph, chart, decline, decrease. Downturn showing downward trending graph with arrow indicating decline keywords: graph, chart, decline
Free with trial A black icon of a graph with a downward sloping curve and an arrow indicating decrease. Decrease business graph illustrations Black graph showing a downward trend with an arrow and Y axis label chart data. A black icon of a graph with a downward sloping curve and an arrow indicating decrease
Free with trial The image depicts a bar graph with a downward trend. The bars start high on the left and progressively decrease in height towards the right. A large red downward arrow further emphasizes the declining trend. Decrease business graph vectors Decreasing trend in bar graph. The image depicts a bar graph with a downward trend. The bars start high on the left and progressively decrease in height towards the right. A large red downward arrow further emphasizes the declining trend
Free with trial A pair of minimalist line graphs illustrating a downward trend, presented in a high-contrast black on white and white on black design. The arrow at the end clearly indicates a decline, representing concepts like loss, decrease, negative growth, or recession. Ideal for financial reports, business presentations, economic news, data visualization, or any content requiring a clear symbol for falling statistics or poor performance. Decrease business graph vectors Downward Trend Graph Icon Set - Black and White Decline Chart. A pair of minimalist line graphs illustrating a downward trend, presented in a high-contrast black on white and white on black design. The arrow at the end clearly indicates a decline, representing concepts like loss, decrease, negative growth, or recession. Ideal for financial reports, business presentations, economic news, data visualization, or any content requiring a clear symbol for falling statistics or poor performance.
Free with trial Business market crash and recession vector concept. Symbol of failure, decline, decrease. Minimal design eps10 illustration. Decrease business graph vectors Business market crash and recession vector concept. Symbol of failure, decline, decrease. Minimal illustration
Free with trial Coronavirus Covid-19 outbreak and business recession concept, wireframe dot and line virus shape stock graph downing, metaphor declining economy and business failure when virus disease, global crisis. Decrease business graph vectors Covid-19 Coronavirus with failure business 001. Coronavirus Covid-19 outbreak and business recession concept, wireframe dot and line virus shape stock graph downing, metaphor declining economy and business failure when virus disease, global crisis
Free with trial Declining graph indicating financial loss, sad face representing disappointment, coin symbolizing money, and cloud metaphor for challenges. Ideal for finance, business troubles, economic downturn. Decrease business graph vectors Financial Loss Concept with Declining Graph, Sad Face, Coin and Cloud Symbol. Declining graph indicating financial loss, sad face representing disappointment, coin symbolizing money, and cloud metaphor for challenges. Ideal for finance, business troubles, economic downturn
Free with trial Gold bars on graph and arrow up, growth, chart gold with increase and decrease, gold profit and loss concept. Decrease business graph vectors Gold bars on graph and arrow up, growth, chart gold with increase and decrease, gold profit and loss concept
Free with trial Line graph with plotted data points, bar chart, and triangular warning alert. Ideal for analytics, business, risk management, financial trends, forecasting, reporting performance tracking simple. Decrease business graph vectors Data Analysis with Line Graph, Bar Chart, and Warning Sign for Risk Monitoring. Line graph with plotted data points, bar chart, and triangular warning alert. Ideal for analytics, business, risk management, financial trends, forecasting, reporting performance tracking simple
Free with trial This image showcases a comprehensive collection of blue bar graphs and line graphs, presented in a grid format. Each graph depicts various data trends, including upward and downward movements, fluctuating patterns, and steady growth. The clean, modern design makes these icons ideal for representing financial data, market analysis, performance metrics, and business growth in presentations, reports, and websites. Decrease business graph illustrations Collection of Blue Bar and Line Graphs for Business Analytics. This image showcases a comprehensive collection of blue bar graphs and line graphs, presented in a grid format. Each graph depicts various data trends, including upward and downward movements, fluctuating patterns, and steady growth. The clean, modern design makes these icons ideal for representing financial data, market analysis, performance metrics, and business growth in presentations, reports, and websites.
Free with trial Profit icon. Coin growth vector illustration. Investment increase and decrease infographic. Statistic arrow symbol. Financial chart sign. Stock graph pictogram isolated. Decrease business graph vectors Profit icon. Coin growth vector illustration. Investment increase and decrease infographic. Statistic arrow symbol. Financial
Free with trial Business failure and economic crisis concept. Stressed businessman despair due to money loss and bankruptcy sitting at desk with broken piggy bank, debt paper and financial falling crash graph. Vector. Decrease business graph vectors Business failure and economic crisis concept. Stressed businessman despair due to money loss and bankruptcy sitting at desk with
Free with trial Drop down red arrow business market crisis on world map red dark background. Crisis economy and investment loss graph. vector illustration fantastic design. Decrease business graph vectors Drop down red arrow business market crisis on world map red dark background.
Free with trial Decreasing graph concept. Blue arrow depict recession business. Flat illustration of broken fallof arrow as an element for infographic, article background for internet, publish, social networks. Decrease business graph vectors Recession Business Concept 4. Decreasing graph concept. Blue arrow depict recession business. Flat illustration of broken fallof arrow as an element for infographic, article background for internet, publish, social networks.
Free with trial Reduction graph concept. Red arrow depict recession business. Flat illustration of broken downward arrow as an element for infographic, article background for web, publish, social networks. Decrease business graph vectors Recession Business Concept 3. Reduction graph concept. Red arrow depict recession business. Flat illustration of broken downward arrow as an element for infographic, article background for web, publish, social networks.
Free with trial The image shows a line graph illustrating the decline of carbon emissions. there are two lines on the graph, a green line and a grey line, both trending downwards. the green line, representing "carbon inteetiual emissions," shows a steeper decline compared to the grey line. the graph is set against a grid background, providing a visual reference for the rate of decrease in emissions over time. the downward trend suggests a positive change in reducing carbon output. Decrease business graph illustrations Carbon emissions decline graph illustration. the image shows a line graph illustrating the decline of carbon emissions. there are two lines on the graph, a green line and a grey line, both trending downwards. the green line, representing "carbon inteetiual emissions," shows a steeper decline compared to the grey line. the graph is set against a grid background, providing a visual reference for the rate of decrease in emissions over time. the downward trend suggests a positive change in reducing carbon output.
Free with trial Businessman hand holding digital graph with cost reduction concept showing financial growth saving strategy economic efficiency and business success in modern finance. Decrease business graph illustrations Businessman hand holding digital graph with cost reduction concept showing financial growth saving strategy economic efficiency
Free with trial A black silhouette of a financial graph with bars and jagged lines is shown on white. Decrease business graph illustrations Black silhouette of a financial graph with bars and jagged lines on white chart business. A black silhouette of a financial graph with bars and jagged lines is shown on white
Free with trial A conceptual image featuring wooden blocks spelling the word "TRUST" alongside a stacked block showing a downward trend graph and a sad face emoji. This composition symbolizes the loss of consumer confidence, economic recession, reputation damage, and the negative impact of poor service or financial decline in a professional business environment. Decrease business graph illustrations Declining Trust and Business Failure Concept with Wooden Blocks and Sad Face Icon. A conceptual image featuring wooden blocks spelling the word "TRUST" alongside a stacked block showing a downward trend graph and a sad face emoji. This composition symbolizes the loss of consumer confidence, economic recession, reputation damage, and the negative impact of poor service or financial decline in a professional business environment.
Free with trial Shopping cart with a downward arrow, bar graph indicating loss, and sad face illustrating declining sales or performance. Ideal for business, ecommerce, market decline, economic loss, analytics. Decrease business graph vectors Declining Sales Concept with Shopping Cart, Downward Arrow, Bar Graph, and Sad Face. Shopping cart with a downward arrow, bar graph indicating loss, and sad face illustrating declining sales or performance. Ideal for business, ecommerce, market decline, economic loss, analytics
Free with trial Green arrow on financial graph with terrified cartoon face reacting to a sharp downward trend. Concept of market crash or business loss. Decrease business graph illustrations Green arrow on financial graph with terrified cartoon face reacting to a sharp downward trend
Free with trial Germany Stock Exchange market crisis red market price down chart fall / Stock analysis or forex charts graph Business and finance money crisis red negative drop in sales economic fall. Decrease business graph illustrations Germany Stock Exchange market crisis red market price down chart fall Business and finance money crisis red negative drop in sales. Germany Stock Exchange market crisis red market price down chart fall / Stock analysis or forex charts graph Business and finance money crisis red negative drop in sales economic fall
Free with trial The image shows a conference room with a long wooden table and black leather chairs. a silver line graph depicting a downward trend is placed on the table. the graph starts high on the left and gradually declines towards the right, indicating a loss or decrease. the room is well-lit with ceiling lights. the background is blurred, focusing attention on the graph and the table. a painting is visible on the wall. Decrease business graph illustrations Decreasing graph on conference room table view. the image shows a conference room with a long wooden table and black leather chairs. a silver line graph depicting a downward trend is placed on the table. the graph starts high on the left and gradually declines towards the right, indicating a loss or decrease. the room is well-lit with ceiling lights. the background is blurred, focusing attention on the graph and the table. a painting is visible on the wall.
Free with trial A conceptual image representing financial loss, economic downturn, or business failure. A person's hands are holding and seemingly guiding a glowing red line graph that is pointing sharply downwards. The arrow at the end confirms the negative trend. The neutral background keeps the focus on this clear symbol of decline. Generative AI. Decrease business graph illustrations Two hands holding a glowing red line graph that is trending downwards. A conceptual image representing financial loss, economic downturn, or business failure. A person's hands are holding and seemingly guiding a glowing red line graph that is pointing sharply downwards. The arrow at the end confirms the negative trend. The neutral background keeps the focus on this clear symbol of decline. Generative AI.
Free with trial Red sad face beside a line graph showing a downward trend and a bar graph. Ideal for business loss, economic decline, performance issues, challenges, setbacks, analytics, trends. Simple flat metaphor. Decrease business graph vectors Declining Chart with Sad Face and Bar Graph Representing Negative Trend and Challenges. Red sad face beside a line graph showing a downward trend and a bar graph. Ideal for business loss, economic decline, performance issues, challenges, setbacks, analytics, trends. Simple flat metaphor
Free with trial A digital illustration of a declining line graph with a large downward arrow and a coin at the bottom, representing financial decline or market loss, suitable for economic and business contexts. Decrease business graph illustrations Downward Trending Graph with Falling Line Chart and Coin Illustration. A digital illustration of a declining line graph with a large downward arrow and a coin at the bottom, representing financial decline or market loss, suitable for economic and business contexts
Free with trial A simple red line graph showing a sharp downward trend with an arrow indicating a significant decrease, symbolizing loss or decline in performance. Decrease business graph illustrations Red downward trending graph isolated on white background. A simple red line graph showing a sharp downward trend with an arrow indicating a significant decrease, symbolizing loss or decline in performance
Free with trial A simple red line graph showing a sharp downward trend, indicating a significant decrease or loss in value, isolated against a clean white background for clarity. Decrease business graph illustrations Red downward trending graph isolated on white background. A simple red line graph showing a sharp downward trend, indicating a significant decrease or loss in value, isolated against a clean white background for clarity
Free with trial Sad face symbolizing dissatisfaction or issues, with data point focus and declining performance graph. Ideal for business analytics, performance drops, feedback, emotions, troubleshooting, reporting. Decrease business graph illustrations Sad face with declining graph and focus on data highlighting underperformance and issues. Sad face symbolizing dissatisfaction or issues, with data point focus and declining performance graph. Ideal for business analytics, performance drops, feedback, emotions, troubleshooting, reporting
Free with trial Market crash failure statistics icon flat vector. Economy graph. Financial stock economic decrease in chart. Investment crisis and business collapse. Board isolated on white background. Decrease business graph vectors Market crash failure statistics icon flat vector
Free with trial This infographic-style image visually represents business growth and financial performance through various charts and graphs. A line graph illustrates revenue trends with percentage markers, a donut chart displays market share distribution, and a bar chart shows quarterly profit figures. Icons representing data, growth, and reports are subtly integrated into the background, creating a professional and informative visual for business and finance-related content. Decrease business graph illustrations Business Growth and Financial Performance Analytics. This infographic-style image visually represents business growth and financial performance through various charts and graphs. A line graph illustrates revenue trends with percentage markers, a donut chart displays market share distribution, and a bar chart shows quarterly profit figures. Icons representing data, growth, and reports are subtly integrated into the background, creating a professional and informative visual for business and finance-related content.
Free with trial This image is a simple vector graphic depicting a downward trending line graph. The graph is enclosed in a square with a bold black border and shows a blue line indicating a decrease in values over ti. Decrease business graph illustrations Downward Trend Graph, Data Decline Icon. This image is a simple vector graphic depicting a downward trending line graph. The graph is enclosed in a square with a bold black border and shows a blue line indicating a decrease in values over ti
Free with trial This image is a simple vector graphic depicting a downward trending line graph. The graph is enclosed in a square with a bold black border and shows a blue line indicating a decrease in values over ti. Decrease business graph illustrations Downward Trend Graph, Data Decline Icon. This image is a simple vector graphic depicting a downward trending line graph. The graph is enclosed in a square with a bold black border and shows a blue line indicating a decrease in values over ti
Free with trial A financial graph depicting a downward trend with a red arrow, blue bar chart, and white line graph on a dark blue grid background. Ideal for illustrating market decline, revenue loss, or negative performance in business, finance, and economic presentations. Decrease business graph illustrations Declining Financial Graph Red Arrow and Bar Chart on Dark Grid Background. A financial graph depicting a downward trend with a red arrow, blue bar chart, and white line graph on a dark blue grid background. Ideal for illustrating market decline, revenue loss, or negative performance in business, finance, and economic presentations.
Free with trial A businessman gestures towards a downward-trending red arrow on a graph, illustrating concepts of financial decline, market downturn, economic recession, investment loss, and business failure. The image is clean, using a white background, and ideal for presentations or articles related to financial crisis and negative trends, generated by AI. Decrease business graph illustrations Businessman showing decreasing red graph arrow down. A businessman gestures towards a downward-trending red arrow on a graph, illustrating concepts of financial decline, market downturn, economic recession, investment loss, and business failure. The image is clean, using a white background, and ideal for presentations or articles related to financial crisis and negative trends, generated by AI.
Free with trial Flat infographic decreasing graph concept. Yellow pencil as a downtrend arrow with hand drawn column chart. Infographics vector elements for business publish, web, social media. Decrease business graph vectors Decreasing graph concept.
Free with trial Flat infographic reduction business concept. Red pencil as a decreasing graph arrow with recession hand drawn column chart. Infographics vector elements for web, publish, social networks. Decrease business graph vectors Decreasing graph concept. Flat infographic reduction business concept. Red pencil as a decreasing graph arrow with recession hand drawn column chart. Infographics vector elements for web, publish, social networks.
Free with trial Isometric illustration of a woman analyzing a graph with a magnifying glass, laptop, and coins, representing finance and business analysis. Decrease business graph vectors Woman analyzes graph with magnifying glass and laptop coin. isometric illustration of a woman analyzing a graph with a magnifying glass, laptop, and coins, representing finance and business analysis.
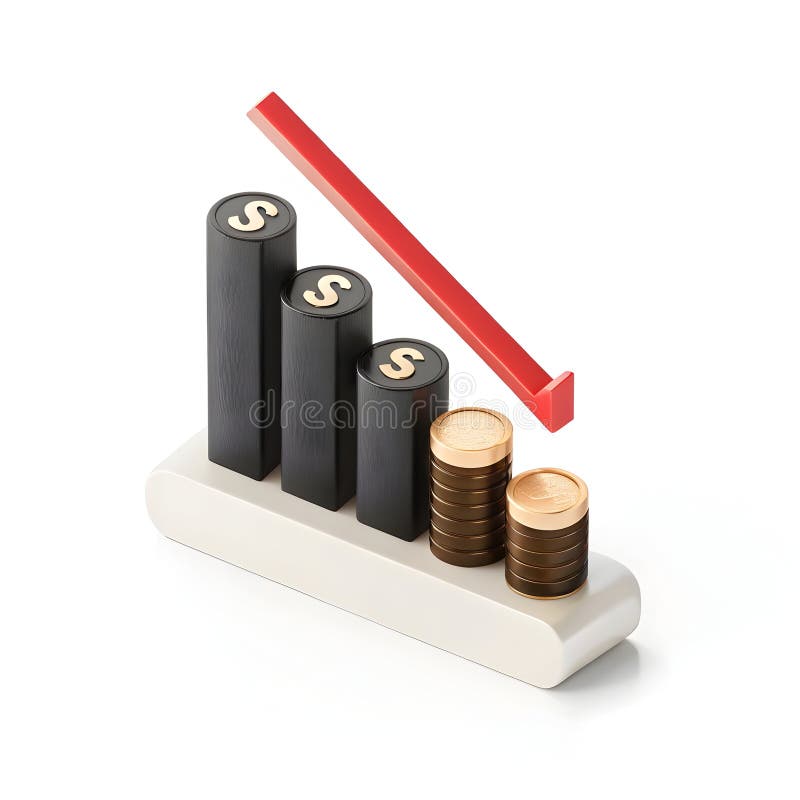
Free with trial A 3D illustration depicts a financial graph with a downward trend. Three black bars, each topped with a gold dollar sign, decrease in height from left to right. To the right of the bars, two stacks of gold coins are shown, also decreasing in height. A thick red arrow points downwards, crossing over the bars and coins, indicating a decline. The entire composition rests on a white base and is set. Decrease business graph illustrations Falling financial graph with stacked coins finance. A 3D illustration depicts a financial graph with a downward trend. Three black bars, each topped with a gold dollar sign, decrease in height from left to right. To the right of the bars, two stacks of gold coins are shown, also decreasing in height. A thick red arrow points downwards, crossing over the bars and coins, indicating a decline. The entire composition rests on a white base and is set
Free with trial Hand pushing on a declining graph representing business regression and stock market downturns. Decrease business graph illustrations Business regression
Free with trial Hand pushing on a declining graph representing business regression and stock market downturns. Decrease business graph illustrations Business regression
Free with trial A modern flat design concept illustrating business analytics and sales performance. The scene features a laptop and smartphone displaying a dashboard with various charts, graphs, and statistics for a Q3 report. A world map with a magnifying glass signifies global market analysis and regional breakdown. Additional elements like a checklist and growth decrease icons represent strategic planning, auditing, and financial review. This versatile vector illustration is perfect for presentations, marketing materials, and web design related to finance, data visualization, and business intelligence. Decrease business graph illustrations Business Analytics and Sales Performance Report Dashboard. A modern flat design concept illustrating business analytics and sales performance. The scene features a laptop and smartphone displaying a dashboard with various charts, graphs, and statistics for a Q3 report. A world map with a magnifying glass signifies global market analysis and regional breakdown. Additional elements like a checklist and growth decrease icons represent strategic planning, auditing, and financial review. This versatile vector illustration is perfect for presentations, marketing materials, and web design related to finance, data visualization, and business intelligence.
Free with trial A bold, glossy red arrow curves downwards, signifying a decrease in business performance, economic downturn, or negative trend. Its sleek design conveys a clear message of decline. Decrease business graph illustrations Glossy red downward arrow symbolizing decline progress and business trends. A bold, glossy red arrow curves downwards, signifying a decrease in business performance, economic downturn, or negative trend. Its sleek design conveys a clear message of decline
Free with trial A stark red bar graph illustrates a sharp downward trend with a prominent arrow, visually representing financial decline, economic recession, or business failure. Decrease business graph illustrations Red bar graph with downward arrow isolated on white background. A stark red bar graph illustrates a sharp downward trend with a prominent arrow, visually representing financial decline, economic recession, or business failure
Free with trial Candlestick charts with red and green bars display a stock market or forex trading pattern. Each candlestick represents data for a specific time period, showing opening, closing, high, and low values. Red indicates a price decrease, while green signifies an increase. The chart analyzes investment trends and is used for financial decisions in business and trading. The background is dark blue, enhancing the visibility of the vibrant candlestick colors. Decrease business graph illustrations Stock market chart forex trading candlestick pattern investment finance business graph analysis data trend. Candlestick charts with red and green bars display a stock market or forex trading pattern. Each candlestick represents data for a specific time period, showing opening, closing, high, and low values. Red indicates a price decrease, while green signifies an increase. The chart analyzes investment trends and is used for financial decisions in business and trading. The background is dark blue, enhancing the visibility of the vibrant candlestick colors.
Free with trial Business decline, Businessman examines decreasing bar graph and chart. Decrease business graph vectors Business decline, Businessman examines decreasing bar graph and chart
Free with trial Sad face beside declining line graph and bar chart, symbolizing setbacks. Ideal for finance, business, economy, loss, analytics, crisis performance. Simple flat metaphor. Decrease business graph vectors Negative Trend Line and Declining Bar Chart Representing Business Loss or Financial Downturn. Sad face beside declining line graph and bar chart, symbolizing setbacks. Ideal for finance, business, economy, loss, analytics, crisis performance. Simple flat metaphor
Free with trial A dramatic business concept image showing a person in a business suit holding a glowing red line graph that is trending downwards with an arrow. The background is a blurred view of stock market ticker screens, clearly linking the downward trend to a financial market crash, recession, or investment loss. Generative AI. Decrease business graph illustrations A person in a suit holding a plunging red arrow graph in front of stock market screens. A dramatic business concept image showing a person in a business suit holding a glowing red line graph that is trending downwards with an arrow. The background is a blurred view of stock market ticker screens, clearly linking the downward trend to a financial market crash, recession, or investment loss. Generative AI.
Free with trial Declining graph line icon. Negative graph statistics linear style sign for mobile concept and web design. Business decline chart outline vector icon. Symbol, logo illustration. Vector graphics. Decrease business graph vectors Declining graph line icon
Free with trial This image shows a bar graph with a downward trend, indicated by a red arrow. It represents a decline in business, finance, or the economy, isolated on white. Decrease business graph illustrations A bar graph showing a downward trend with a red arrow isolated on white background. This image shows a bar graph with a downward trend, indicated by a red arrow. It represents a decline in business, finance, or the economy, isolated on white
Free with trial Downward trend graph with large sad face and woman in casual attire. Ideal for business performance, feedback, failure, regret, decisions, emotions, analytics. Clean simple flat metaphor. Decrease business graph vectors Declining Trend Graph with Sad Face and Casual Woman Highlighting Failure or Negative Feedback. Downward trend graph with large sad face and woman in casual attire. Ideal for business performance, feedback, failure, regret, decisions, emotions, analytics. Clean simple flat metaphor
Free with trial A simple bar chart and line graph with a downward arrow illustrates a negative trend like recession or business failure ideal for financial reports about crisis or loss. Decrease business graph illustrations Declining Blue Bar Chart and Line Graph Showing Financial Loss on Gray Background. A simple bar chart and line graph with a downward arrow illustrates a negative trend like recession or business failure ideal for financial reports about crisis or loss
Free with trial This image shows a colorful 3D bar graph representing growth or progress. The bars increase in height, then decrease slightly before another sharp increase, indicating fluctuations in data. The wooden background adds a rustic and visually appealing contrast. Decrease business graph illustrations Colorful Bar Graph on Wooden Background. This image shows a colorful 3D bar graph representing growth or progress. The bars increase in height, then decrease slightly before another sharp increase, indicating fluctuations in data. The wooden background adds a rustic and visually appealing contrast.
Free with trial Decreasing graph concept. Arrow depict recession business and process. Flat vector illustration of downward arrow and business icons. Infographic elements, template for web, publish, social networks. Decrease business graph vectors Recession Business Infographic. Decreasing graph concept. Arrow depict recession business and process. Flat vector illustration of downward arrow and business icons. Infographic elements, template for web, publish, social networks.
Free with trial Finance crisis with falling down graph and money decrease. Idea of bancruptcy and risk. Set of colorful icons. Isolated flat vector illustration. Decrease business graph vectors Finance crisis with falling down graph and money decrease
Free with trial A striking 3D rendering features an abstract bar graph composed of numerous translucent blue rectangular blocks against a dark, almost black, background. The varying heights of the blocks create a dynamic visual representation of data, statistics, or growth trends. This modern and futuristic design is ideal for illustrating concepts related to business, finance, technology, analytics, market research, or digital information in presentations, reports, websites, and corporate media. Decrease business graph illustrations Abstract 3D Blue Bar Graph Visualization. A striking 3D rendering features an abstract bar graph composed of numerous translucent blue rectangular blocks against a dark, almost black, background. The varying heights of the blocks create a dynamic visual representation of data, statistics, or growth trends. This modern and futuristic design is ideal for illustrating concepts related to business, finance, technology, analytics, market research, or digital information in presentations, reports, websites, and corporate media.
Free with trial Corona Virus stock market graph, Chart Down. Stock Markets plunge from COVID-19 virus fear, world equity price fall down or collapse. Impact on Global Economy, Business Stops Growing. Decrease business graph vectors Corona Virus stock market graph, Chart Down. Stock Markets plunge from COVID-19 virus fear, world equity price fall down or
Free with trial A simple bar chart with a falling line, symbolizing financial decline, economic downturn, decreased profits, market loss, or negative business results. Ideal for illustrating risks, challenges, crisis situations, and economic analysis. Decrease business graph vectors Declining financial chart icon with downward trend showing loss, decrease and negative business performance. A simple bar chart with a falling line, symbolizing financial decline, economic downturn, decreased profits, market loss, or negative business results. Ideal for illustrating risks, challenges, crisis situations, and economic analysis.