Free with trial Abstract business background with a green graph and arrow on a wooden table. Decrease business graph vectors Abstract green graph with arrow on wooden table. Abstract business background with a green graph and arrow on a wooden table
Free with trial Flat style illustration showcasing business financial data analysis via a magnifying glass and graph chart visualization, isolated on black. Decrease business graph vectors Analyzing Financial Data with Magnifying Glass and Graph Chart. Flat style illustration showcasing business financial data analysis via a magnifying glass and graph chart visualization, isolated on black.
Free with trial Shopping cart business graph illustration design over a white background. Decrease business graph illustrations Shopping cart business graph illustration
Free with trial Finance concept. Finance-related document with a dollar emblem and a certificate ribbon next to a downward trend graph. Finance implications, documents, investments, transactions, business planning. Decrease business graph vectors Financial Document with Dollar Symbol, Certificate Ribbon, and Declining Graph Icon. Finance concept. Finance-related document with a dollar emblem and a certificate ribbon next to a downward trend graph. Finance implications, documents, investments, transactions, business planning
Free with trial Up and down arrows, bar graph, and fingerprint emphasize data analysis, growth, security, identity, biometrics, trends and technology. Ideal for business analytics privacy security technology. Decrease business graph illustrations Arrows Indicating Trends With Bar Graph and Digital Fingerprint for Data and Security Concepts. Up and down arrows, bar graph, and fingerprint emphasize data analysis, growth, security, identity, biometrics, trends and technology. Ideal for business analytics privacy security technology
Free with trial Vertical arrow pointing downward next to bar graph with decreasing metrics. Ideal for business analysis, data visualization, financial downturn, market decline, trend report, economics, simple flat. Decrease business graph illustrations Declining Bar Graph with Arrow Indicating Downward Trend in Performance or Statistics. Vertical arrow pointing downward next to bar graph with decreasing metrics. Ideal for business analysis, data visualization, financial downturn, market decline, trend report, economics, simple flat
Free with trial The money and business outline icon set. The stack of dollar coins, gold 24k, upward and downward graph, online banking, briefcase and banknote symbols. Thin linear vector icons with editable strokes. Decrease business graph vectors The money and business outline vector icon set. The money and business outline icon set. The stack of dollar coins, gold 24k, upward and downward graph, online banking, briefcase and banknote symbols. Thin linear vector icons with editable strokes
Free with trial Bold red downward graph arrow 2D cartoon object. Trend market decline. Descending line chart. Business loss. Economic downturn isolated element flat vector clip art on white. Spot illustration. Decrease business graph vectors Bold red downward graph arrow 2D cartoon object
Free with trial Downward graph with data points, sad face symbolizing dissatisfaction, and a delivery truck. Ideal for business decline, logistics challenges, sales drop, market analysis, e-commerce, customer. Decrease business graph illustrations Declining Sales Trend with Sad Face and Delivery Truck Highlighting Business Challenges. Downward graph with data points, sad face symbolizing dissatisfaction, and a delivery truck. Ideal for business decline, logistics challenges, sales drop, market analysis, e-commerce, customer
Free with trial Increasing and decreasing graph set. Red and blue arrows depict growth and recession business. Flat vector chart concept illustration as an element for web, publish infographic and social networks. Decrease business graph vectors Growth and Recession Business Concept. Increasing and decreasing graph set. Red and blue arrows depict growth and recession business. Flat vector chart concept illustration as an element for web, publish infographic and social networks.
Free with trial The graph displays two lines, one green and one red. The green line is ascending, indicating growth or progress, while the red line is descending, suggesting a decline or decrease. Decrease business graph illustrations A graph with a green line and a red line. The graph displays two lines, one green and one red. The green line is ascending, indicating growth or progress, while the red line is descending, suggesting a decline or decrease
Free with trial A simple and clean line art icon of a graph, isolated on a white background. This vector illustration features a line chart with axes, showing a fluctuating trend with distinct data points. The minimalist design makes it perfect for various applications related to business, finance, and data analysis. Ideal for use in presentations, infographics, websites, mobile apps, and user interfaces to represent concepts like statistics, growth, market trends, performance reports, and financial analytics. A versatile symbol for progress and data visualization. Decrease business graph illustrations Analytics Line Graph Vector Icon. A simple and clean line art icon of a graph, isolated on a white background. This vector illustration features a line chart with axes, showing a fluctuating trend with distinct data points. The minimalist design makes it perfect for various applications related to business, finance, and data analysis. Ideal for use in presentations, infographics, websites, mobile apps, and user interfaces to represent concepts like statistics, growth, market trends, performance reports, and financial analytics. A versatile symbol for progress and data visualization.
Free with trial Yellow sad emoticon and green pants next to stylized line graph with nodes. Ideal for fashion industry, sales decrease, trends, dissatisfaction, analysis, loss, economics. Simple flat metaphor. Decrease business graph illustrations Sad face with pants and graph chart symbolizing loss or decline in trends or fashion demand. Yellow sad emoticon and green pants next to stylized line graph with nodes. Ideal for fashion industry, sales decrease, trends, dissatisfaction, analysis, loss, economics. Simple flat metaphor
Free with trial Four colorful bar charts are displayed on a graph, representing trends, statistics, and timeline data, with a potential focus on business infographics elements. Decrease business graph vectors Four colorful bar charts are displayed on a graph, representing trends, statistics, and timeline data, with a potential
Free with trial Bar graph decreasing in height beside falling coins merging into cloud. Ideal for finance, economy, business risk, savings, investment, financial crisis, wealth management. Simple flat metaphor. Decrease business graph vectors Financial decline represented with bar graph and coins falling into cloud symbolizing loss. Bar graph decreasing in height beside falling coins merging into cloud. Ideal for finance, economy, business risk, savings, investment, financial crisis, wealth management. Simple flat metaphor
Free with trial Abstract illustration of a financial graph with glowing lines on a dark background. The graph shows two distinct curves, one starting in cool blue tones and transitioning to warm orange hues, suggesting a shift in market trends or performance. The image conveys concepts of data analysis, growth, decline, and financial forecasting. Suitable for illustrating business reports, presentations, or articles related to finance, investment, and economics. Decrease business graph illustrations Abstract Financial Graph Illustration. Abstract illustration of a financial graph with glowing lines on a dark background. The graph shows two distinct curves, one starting in cool blue tones and transitioning to warm orange hues, suggesting a shift in market trends or performance. The image conveys concepts of data analysis, growth, decline, and financial forecasting. Suitable for illustrating business reports, presentations, or articles related to finance, investment, and economics.
Free with trial Twelve small line graphs showcase diverse data trends, illustrating increases, decreases, peaks, and valleys. Visual representation of business analytics. Decrease business graph illustrations Various Line Graph Charts Data Visualization Business Analytics. Twelve small line graphs showcase diverse data trends, illustrating increases, decreases, peaks, and valleys. Visual representation of business analytics
Free with trial A simple illustration of a declining blue bar graph against a black background. Represents loss or decrease. Decrease business graph vectors Declining bar graph demonstrating financial loss and recession illustration. A simple illustration of a declining blue bar graph against a black background. Represents loss or decrease.
Free with trial Arrow 3d chart graph pointer, vector illustration. Up and down forward arrow, motion and navigation symbol, financial growth concept. Web design elements crease of decrease sign. Decrease business graph vectors Arrow navigation pointer, chart graph. Arrow 3d chart graph pointer, vector illustration. Up and down forward arrow, motion and navigation symbol, financial growth concept. Web design elements crease of decrease sign
Free with trial A 3D rendered image depicting a financial graph with a prominent red arrow indicating a downward trend. The graph features a bar chart with several red bars, showing a decline in value. The background is a dark grid, emphasizing the data visualization. This image is ideal for representing financial losses, economic downturns, market crashes, or negative performance in business and investment contexts. Decrease business graph illustrations Red Arrow Downward Trend Graph with Bar Chart. A 3D rendered image depicting a financial graph with a prominent red arrow indicating a downward trend. The graph features a bar chart with several red bars, showing a decline in value. The background is a dark grid, emphasizing the data visualization. This image is ideal for representing financial losses, economic downturns, market crashes, or negative performance in business and investment contexts.
Free with trial A 3D bar graph with bars of decreasing height, representing a downward trend. A prominent red arrow points downwards, signifying a decline or loss. The background is a subtle gradient. This visual effectively communicates concepts like financial crisis, economic recession, market crash, or business failure. Decrease business graph illustrations Financial downturn illustrated by a declining bar graph and red arrow. A 3D bar graph with bars of decreasing height, representing a downward trend. A prominent red arrow points downwards, signifying a decline or loss. The background is a subtle gradient. This visual effectively communicates concepts like financial crisis, economic recession, market crash, or business failure
Free with trial Landing Page Offer Business Support in Crisis. Financial Trade Stock Market Crash. Businessmen Investment Fail. Decrease Graph, Downward Arrow. Calm Yoga Man over Nervous People. Vector Illustration. Decrease business graph vectors Landing Page Offer Support in Stock Market Crisis. Landing Page Offer Business Support in Crisis. Financial Trade Stock Market Crash. Businessmen Investment Fail. Decrease Graph, Downward Arrow. Calm Yoga Man over Nervous People. Vector Illustration
Free with trial Declining graph trend with sad face, security lock symbol, and coding element. Ideal for failure analysis, cybersecurity, data breach awareness, risk management, technology flaws, business loss. Decrease business graph vectors Declining Data Trend on Graph with Security and Sad Expression. Declining graph trend with sad face, security lock symbol, and coding element. Ideal for failure analysis, cybersecurity, data breach awareness, risk management, technology flaws, business loss
Free with trial Circular chart icon presenting a bar graph visualizing statistical data, analytics, and business reports, symbolizing financial decline, data analysis, and market trends. Decrease business graph vectors Circular chart icon showing declining bar graph. Circular chart icon presenting a bar graph visualizing statistical data, analytics, and business reports, symbolizing financial decline, data analysis, and market trends
Free with trial An illustrative financial graph depicting a significant downward trend. A prominent red arrow emphasizes the decline, cutting through a black line chart with a shaded area, set against a backdrop of subtle candlestick patterns and a grid. This image effectively conveys concepts of economic recession, market loss, falling stock prices, and business challenges. Ideal for financial news, reports, and presentations on market analysis or investment risks. Decrease business graph vectors Financial Market Downturn Graph with Red Arrow. An illustrative financial graph depicting a significant downward trend. A prominent red arrow emphasizes the decline, cutting through a black line chart with a shaded area, set against a backdrop of subtle candlestick patterns and a grid. This image effectively conveys concepts of economic recession, market loss, falling stock prices, and business challenges. Ideal for financial news, reports, and presentations on market analysis or investment risks.
Free with trial A 3D rendering of a bar graph with teal bars of decreasing height, indicating a downward trend. A bold red arrow overlays the graph, sharply descending and pointing towards the lowest bar, visually representing a significant loss or decline. The background is slightly blurred, suggesting a professional or office environment. Decrease business graph illustrations Business graph showing a sharp decline with a red arrow pointing downwards. A 3D rendering of a bar graph with teal bars of decreasing height, indicating a downward trend. A bold red arrow overlays the graph, sharply descending and pointing towards the lowest bar, visually representing a significant loss or decline. The background is slightly blurred, suggesting a professional or office environment
Free with trial A comprehensive collection of flat line design icons representing key concepts in business, finance, and data analytics. The set includes various charts (bar, line, pie), a speedometer, a magnifying glass with a graph, financial documents with checkmarks, a target with an arrow, a dollar sign, a percentage symbol, and directional arrows for growth and decline. These versatile vector elements are ideal for presentations, reports, websites, and applications focused on statistics, performance, strategy, and financial insights. Decrease business graph illustrations Business and Data Analytics Flat Line Icons Set. A comprehensive collection of flat line design icons representing key concepts in business, finance, and data analytics. The set includes various charts (bar, line, pie), a speedometer, a magnifying glass with a graph, financial documents with checkmarks, a target with an arrow, a dollar sign, a percentage symbol, and directional arrows for growth and decline. These versatile vector elements are ideal for presentations, reports, websites, and applications focused on statistics, performance, strategy, and financial insights.
Free with trial A hand interacts with a tablet displaying a graph showing quality increasing and cost decreasing, symbolizing business improvement and efficiency. Decrease business graph illustrations Quality Up, Cost Down: Business Analysis on Tablet. A hand interacts with a tablet displaying a graph showing quality increasing and cost decreasing, symbolizing business improvement and efficiency
Free with trial Illustration of a growing mobile application usage with a simple phone screen displaying a rising graph, a stylized touch hand, and a stream of download arrows. Vector flat icon design on a white background for a user adoption illustration --chaos 30 --ar 16:9 --v 7 Job ID: 938d3d73-bd25-4740-98fd-21a43555bec1. Decrease business graph illustrations Smartphone showing declining graph with arrows pointing down, concept of financial loss, data decrease. Illustration of a growing mobile application usage with a simple phone screen displaying a rising graph, a stylized touch hand, and a stream of download arrows. Vector flat icon design on a white background for a user adoption illustration --chaos 30 --ar 16:9 --v 7 Job ID: 938d3d73-bd25-4740-98fd-21a43555bec1
Free with trial Red zigzag line graph with broken arrows pointing up and down. Business metaphor for market volatility and financial crisis. Handdrawn zig zag arrows. Decrease business graph vectors Red zigzag line graph with broken arrows pointing up and down. Market volatility and financial crisis. Zig zag arrows. Red zigzag line graph with broken arrows pointing up and down. Business metaphor for market volatility and financial crisis. Handdrawn zig zag arrows
Free with trial Business Risk Management Graph Concept. Decrease business graph illustrations Risk Management Diagram Graph Arrow Concept. Business Risk Management Graph Concept
Free with trial Business finance crisis concept. Money fall down symbol. Arrow decrease economy stretching rising drop. Cost reduction. Loss of income. Vector illustration on blue background. Decrease business graph vectors Business finance crisis concept. Money fall down symbol. Arrow decrease economy stretching rising drop. Cost reduction. Loss of
Free with trial A colorful bar chart displays a significant downward trend. The bars, colored red, yellow, green, and blue, decrease in height from left to right. A bold black arrow points downwards, emphasizing the decline. The chart is presented on a plain white background. Decrease business graph illustrations Colorful Bar Chart Showing a Steep Decline with a Downward Arrow graph decrease. A colorful bar chart displays a significant downward trend. The bars, colored red, yellow, green, and blue, decrease in height from left to right. A bold black arrow points downwards, emphasizing the decline. The chart is presented on a plain white background
Free with trial A cartoon-style illustration of a bar graph displayed on a presentation screen. The graph shows three bars of different heights and colors (green, orange, and yellow), indicating growth or progress. The image is clean and simple, suitable for illustrating business, finance, or educational concepts in a visually appealing way. Decrease business graph illustrations Cartoon Bar Graph Presentation. A cartoon-style illustration of a bar graph displayed on a presentation screen. The graph shows three bars of different heights and colors (green, orange, and yellow), indicating growth or progress. The image is clean and simple, suitable for illustrating business, finance, or educational concepts in a visually appealing way.
Free with trial A clean and modern isometric bar graph illustration. Three colored bars, blue, green, and yellow, represent data points with corresponding numerical values displayed above each bar. The graphic is set against a white background, making it suitable for various presentations, reports, or website designs related to data analysis, business, or education. The simple design offers a clear visual representation of data comparison. Decrease business graph illustrations Isometric Bar Graph Illustrating Data and Statistics. A clean and modern isometric bar graph illustration. Three colored bars, blue, green, and yellow, represent data points with corresponding numerical values displayed above each bar. The graphic is set against a white background, making it suitable for various presentations, reports, or website designs related to data analysis, business, or education. The simple design offers a clear visual representation of data comparison.
Free with trial Graphic bar chart illustrating business data analysis, financial statistics, and market trends with both positive growth and negative decline on a clean white background. Decrease business graph vectors Business financial graph showing increase and decrease. Graphic bar chart illustrating business data analysis, financial statistics, and market trends with both positive growth and negative decline on a clean white background
Free with trial Dropping graphic arrow. Profit reduction schedule, financial debt graph and income loss 3D arrow vector illustration. Business downturn, company income decline. Decreasing stock market trend forecast. Decrease business graph vectors Dropping graphic arrow. Profit reduction schedule, financial debt graph and income loss 3D arrow vector illustration
Free with trial Frightened businessman falls from declining graph. Investment chart. Lose money. Infograph representing market crash. Financial crisis or recession. Business failure. Man falling down. Vector concept. Decrease business graph illustrations Frightened businessman falls from declining graph. Investment chart. Lose money. Infograph representing market crash. Financial
Free with trial A stark black 3D arrow is shown pointing downwards and to the right, isolated on a white background. The arrow has a sharp, angular design, with a vertical shaft that bends into a diagonal descent. This visual representation clearly conveys concepts of decline, decrease, or a negative trend, commonly used in business, finance, or statistical contexts. Decrease business graph illustrations Black 3D Arrow Pointing Downward on White Background Symbolizing Decline decrease. A stark black 3D arrow is shown pointing downwards and to the right, isolated on a white background. The arrow has a sharp, angular design, with a vertical shaft that bends into a diagonal descent. This visual representation clearly conveys concepts of decline, decrease, or a negative trend, commonly used in business, finance, or statistical contexts
Free with trial 3D rendering of a business infographic chart showing a progressive decline over four periods. Red color on the 3D bar graph chart with an arrow on it. Decrease business graph illustrations 3D render of a business data in decline. 3D rendering of a business infographic chart showing a progressive decline over four periods. Red color on the 3D bar graph chart with an arrow on it.
Free with trial A three-dimensional bar graph composed of translucent blue bars illustrates a significant downward trend. The bars decrease in height from left to right, and a large, transparent blue arrow points downwards, reinforcing the concept of decline. The graph is set against a gradient blue background, creating a sense of depth and focus on the data visualization. Decrease business graph illustrations A3D Rendered Blue Bar Graph Showing a Downward Trend with a Falling Arrow chart data. A three-dimensional bar graph composed of translucent blue bars illustrates a significant downward trend. The bars decrease in height from left to right, and a large, transparent blue arrow points downwards, reinforcing the concept of decline. The graph is set against a gradient blue background, creating a sense of depth and focus on the data visualization
Free with trial Pensive businessman seated upon a briefcase, deeply contemplating a decreasing graph. Depiction of analytical thinking, problem-solving, reflection, strategy, and navigating business challenges. Decrease business graph vectors Pensive businessman seated upon a briefcase, deeply contemplating a decreasing graph
Free with trial An illustration featuring two contrasting arrows against a plain white background. The red arrow shows a wavy upward trend, symbolizing growth, increase, or positive performance with fluctuation. The black arrow shows a wavy downward trend, symbolizing decline, decrease, or negative performance with fluctuation. This visual concept is often used to represent financial market volatility, business. Decrease business graph vectors Dynamic business trends illustrated by contrasting red upward and black downward arrows Vector. An illustration featuring two contrasting arrows against a plain white background. The red arrow shows a wavy upward trend, symbolizing growth, increase, or positive performance with fluctuation. The black arrow shows a wavy downward trend, symbolizing decline, decrease, or negative performance with fluctuation. This visual concept is often used to represent financial market volatility, business
Free with trial Stock market plunge, business bankrupt or economic recession due to Coronavirus outbreak COVID-19 pandemic concept, depressed businessman riding down turn red arrow economics graph with virus pathogen. Decrease business graph illustrations Stock market plunge, business bankrupt or economic recession due to Coronavirus outbreak COVID-19 pandemic concept, depressed
Free with trial A 3D cartoon illustration depicts a stylized hand with a black suit cuff pointing a finger downwards towards a red bar graph. The graph shows a clear downward trend with bars decreasing in height from left to right, colored green, yellow, orange, and red. A red arrow reinforces the concept of decline. The image is set against a white background. Decrease business graph illustrations 3D Cartoon Hand Pointing Down at a Declining Bar Graph on White Background business. A 3D cartoon illustration depicts a stylized hand with a black suit cuff pointing a finger downwards towards a red bar graph. The graph shows a clear downward trend with bars decreasing in height from left to right, colored green, yellow, orange, and red. A red arrow reinforces the concept of decline. The image is set against a white background
Free with trial A collection of eight thin-line related to finance and business. The depict a stack of coins with a dollar sign, a document with a dollar sign, an upward trending graph over city buildings, and a bar chart with a plus sign. The bottom row coins and currency symbols, a calculator with a dollar sign, a document with a calculator and charts, and a person. Decrease business graph illustrations Financial set with charts and calculator finance business. A collection of eight thin-line related to finance and business. The depict a stack of coins with a dollar sign, a document with a dollar sign, an upward trending graph over city buildings, and a bar chart with a plus sign. The bottom row coins and currency symbols, a calculator with a dollar sign, a document with a calculator and charts, and a person
Free with trial A 3D icon depicts a financial graph. The icon features a rounded purple square with a lighter purple top edge. Inside, a yellow line chart with circular data points shows an upward trend, overlaid on a series of yellow vertical bars representing a bar chart. The overall design is clean and modern, symbolizing data analysis, business growth, and financial performance. Decrease business graph illustrations 3D icon representing a financial graph with bars and a line chart on a purple background. A 3D icon depicts a financial graph. The icon features a rounded purple square with a lighter purple top edge. Inside, a yellow line chart with circular data points shows an upward trend, overlaid on a series of yellow vertical bars representing a bar chart. The overall design is clean and modern, symbolizing data analysis, business growth, and financial performance
Free with trial Vector flat line infographic elements. Downward blue arrow and icons represent process of recession business. Vector illustration of decrease arrow and business icon set on white background. Decrease business graph vectors Recession Business Infographic Concept. Vector flat line infographic elements. Downward blue arrow and icons represent process of recession business. Vector illustration of decrease arrow and business icon set on white background.
Free with trial A hand-drawn bar chart shows a downward trend with a line graph indicating a significant decrease in value over time. Decrease business graph vectors Downturn graph illustrating declining trends and financial loss. A hand-drawn bar chart shows a downward trend with a line graph indicating a significant decrease in value over time
Free with trial Economic decline, financial loss, market trends, business analysis, payment reminder, schedule planning. Downward trend graph with sad face icon. Economic decline and financial loss. Decrease business graph vectors Economic Decline and Financial Trends with Calendar Reminder and Graph Symbols. Economic decline, financial loss, market trends, business analysis, payment reminder, schedule planning. Downward trend graph with sad face icon. Economic decline and financial loss
Free with trial Conceptual line art depicting business analysis and market trends. Decrease business graph illustrations Business Analysis Magnifying Glass, Thumbs Up, Declining Graph. Conceptual line art depicting business analysis and market trends.
Free with trial Outline vector graphic depicting a decline in business performance. Decrease business graph illustrations Declining Performance Gear, Man, Graph, Arrow. Business Downturn. Outline vector graphic depicting a decline in business performance.
Free with trial Collection of simple black vector icons representing financial charts, data analysis graphs, and business statistics. Includes trend arrows, magnifier, and settings symbols. Decrease business graph vectors Set of black business graph and chart icons for data analysis. Collection of simple black vector icons representing financial charts, data analysis graphs, and business statistics. Includes trend arrows, magnifier, and settings symbols
Free with trial This illustration depicts a financial concept with a bar graph showing a downward trend, alternating between green (profit) and red (loss) bars. A red line graph with an arrow indicates a significant decline. To the right, a stack of documents represents a profit and loss statement, with 'Profit' and 'Loss' clearly labeled. This visual is ideal for representing financial performance, business challenges, economic downturns, or the need for strategic adjustments. Decrease business graph vectors Declining Profit and Loss Statement with Downward Trend Graph. This illustration depicts a financial concept with a bar graph showing a downward trend, alternating between green (profit) and red (loss) bars. A red line graph with an arrow indicates a significant decline. To the right, a stack of documents represents a profit and loss statement, with 'Profit' and 'Loss' clearly labeled. This visual is ideal for representing financial performance, business challenges, economic downturns, or the need for strategic adjustments.
Free with trial A sad asian guy raising his two arms surrendering causing of his failed business. Graph arrow down, shares fall. Unsuccessful business concept. A contemporary style with pastel palette soft blue tinted background. Vector flat design illustration. Horizontal layout with text space in right side. Decrease business graph vectors Guy raising his arms with arrow down graph. A sad asian guy raising his two arms surrendering causing of his failed business. Graph arrow down, shares fall. Unsuccessful business concept. A contemporary style with pastel palette soft blue tinted background. Vector flat design illustration. Horizontal layout with text space in right side.
Free with trial This image features a 3D bar graph with a downward trend isolated on a white background. The graph consists of green bars that decrease in height from left to right, with a red arrow pointing downward to emphasize the declining trend. The image is clean and visually appealing, suitable for business and financial contexts. Decrease business graph illustrations 3d bar graph with downward trend isolated on white background. This image features a 3D bar graph with a downward trend isolated on a white background. The graph consists of green bars that decrease in height from left to right, with a red arrow pointing downward to emphasize the declining trend. The image is clean and visually appealing, suitable for business and financial contexts
Free with trial A circular icon containing a stylized representation of financial data. The icon features a series of black vertical bars of varying heights, suggesting a bar chart. Overlaid on the bars are two thin lines, one black and one grey, depicting line graphs with peaks and troughs, indicating fluctuating trends. The overall design is minimalist and symbolic, suitable for representing business analytics. Decrease business graph illustrations Circular Graph Icon with Bar and Line Charts Representing Financial Data and Trends business. A circular icon containing a stylized representation of financial data. The icon features a series of black vertical bars of varying heights, suggesting a bar chart. Overlaid on the bars are two thin lines, one black and one grey, depicting line graphs with peaks and troughs, indicating fluctuating trends. The overall design is minimalist and symbolic, suitable for representing business analytics
Free with trial A businessman presenting a concept of cost increase versus quality decrease with the help of visual arrows This is a good representation of business strategy financial challenges economic downturn and the need for effective resource management It shows a common corporate problem and a call for efficient solutions Focus is on the hand and arrows. Decrease business graph illustrations Business Strategy Showing Increased Cost and Decreased Quality Represented by Hand and Arrows. A businessman presenting a concept of cost increase versus quality decrease with the help of visual arrows This is a good representation of business strategy financial challenges economic downturn and the need for effective resource management It shows a common corporate problem and a call for efficient solutions Focus is on the hand and arrows
Free with trial A striking 3D rendering illustrates a significant decline in consumer spending or retail sales. The image features a large green shopping bag followed by three progressively smaller white shopping bags, visually representing a reduction. A prominent red arrow, shaped like a downward trend graph, effectively symbolizes a market downturn, economic recession, or decrease in purchasing power. Set against a clean white background, this conceptual image is ideal for financial reports, business presentations, and articles discussing economic challenges, retail struggles, or market analysis. Decrease business graph illustrations Retail Sales Decline and Economic Downturn. A striking 3D rendering illustrates a significant decline in consumer spending or retail sales. The image features a large green shopping bag followed by three progressively smaller white shopping bags, visually representing a reduction. A prominent red arrow, shaped like a downward trend graph, effectively symbolizes a market downturn, economic recession, or decrease in purchasing power. Set against a clean white background, this conceptual image is ideal for financial reports, business presentations, and articles discussing economic challenges, retail struggles, or market analysis.
Free with trial Line graph with downward trend alongside sad face. Ideal for performance loss, business challenges, failure, analysis, recession, disappointment, frustration. Simple flat metaphor. Decrease business graph vectors Declining Line Graph with Sad Face Representing Negative Trend and Disappointment. Line graph with downward trend alongside sad face. Ideal for performance loss, business challenges, failure, analysis, recession, disappointment, frustration. Simple flat metaphor
Free with trial Editable as a line illustration of a negative or downward going bar graph with a stick figure person standing on the infographic preventing the chart from going down with a rope as a small business owner in crisis. Decrease business graph illustrations Editable line illustration of a negative downward bar graph. Editable as a line illustration of a negative or downward going bar graph with a stick figure person standing on the infographic preventing the chart from going down with a rope as a small business owner in crisis
Free with trial Sad face alongside a line graph showing downward trends, small airport icon, and flight imagery. Ideal for travel analysis, business performance, economy, transportation, tourism, crisis impact. Decrease business graph illustrations Declining Travel Trends Represented by Graph and Sad Face. Sad face alongside a line graph showing downward trends, small airport icon, and flight imagery. Ideal for travel analysis, business performance, economy, transportation, tourism, crisis impact
Free with trial A 3D render illustrating a concept of financial decline and economic recession. The image features a red bar chart with progressively shorter bars, indicating a downward trend. A bold, red arrow follows this negative trajectory, pointing sharply downwards. Set against a clean, neutral gray background, this graphic powerfully symbolizes concepts like business failure, stock market crash, investment loss, sales decrease, and economic crisis. It's a perfect visual for presentations, reports, and articles discussing financial downturns, poor performance, and negative growth. Decrease business graph illustrations Financial Decline Graph with Red Arrow Down. A 3D render illustrating a concept of financial decline and economic recession. The image features a red bar chart with progressively shorter bars, indicating a downward trend. A bold, red arrow follows this negative trajectory, pointing sharply downwards. Set against a clean, neutral gray background, this graphic powerfully symbolizes concepts like business failure, stock market crash, investment loss, sales decrease, and economic crisis. It's a perfect visual for presentations, reports, and articles discussing financial downturns, poor performance, and negative growth.
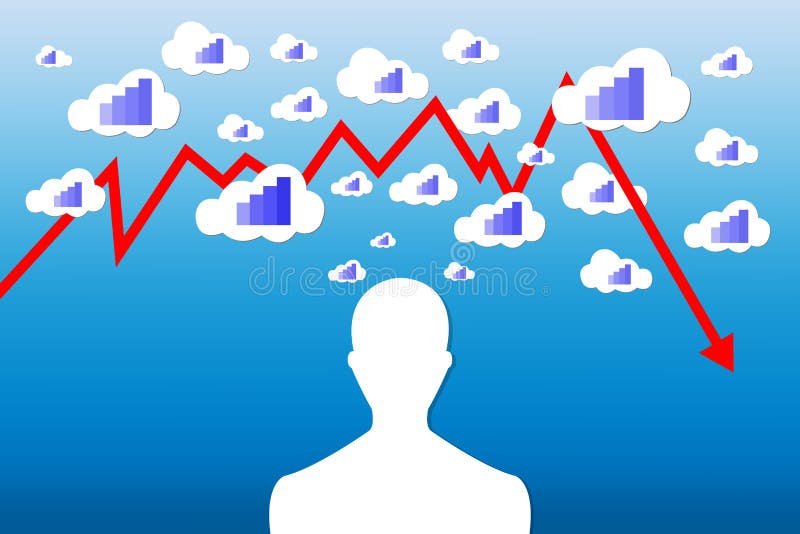
Free with trial Silhouette of a man with the different sizes clouds above his head. Each cloud contains a blue graph indicating economic growth The red graph is showing the economic decrease. All is on a blue gradient background. Decrease business graph vectors Economy decrease concept. Silhouette of a man with the different sizes clouds above his head. Each cloud contains a blue graph indicating economic growth The red graph is showing the economic decrease. All is on a blue gradient background.
Free with trial A conceptual vector illustration depicting a severe economic downturn. The image features a grey bar chart with progressively shorter bars, symbolizing declining profits or performance. A bold red arrow points sharply downwards, representing a crash or significant loss, alongside a blue line graph also showing a negative trend. This graphic is ideal for illustrating concepts such as financial crisis, recession, stock market crash, business failure, bankruptcy, and negative growth. Perfect for financial reports, business presentations, news articles, and economic analysis infographics. Decrease business graph illustrations Economic Downturn and Financial Crisis Graph. A conceptual vector illustration depicting a severe economic downturn. The image features a grey bar chart with progressively shorter bars, symbolizing declining profits or performance. A bold red arrow points sharply downwards, representing a crash or significant loss, alongside a blue line graph also showing a negative trend. This graphic is ideal for illustrating concepts such as financial crisis, recession, stock market crash, business failure, bankruptcy, and negative growth. Perfect for financial reports, business presentations, news articles, and economic analysis infographics.
Free with trial Bitcoin cryptocurrency value price fall drop. Stock market trading graph business with red arrow concept background 3d illustration. Decrease business graph illustrations Bitcoin cryptocurrency value price fall drop. Stock market trading graph business with red arrow concept banner background 3d
Free with trial This image features an abstract illustration of a bar graph against a dark gray background. The graph consists of three vertical bars of varying heights, each with horizontal rectangles inside. The bars are shades of white and gray, creating a minimalist and modern design. This image can be used to represent data, growth, statistics, or business performance in a visually appealing manner. Decrease business graph vectors Abstract Bar Graph Illustration. This image features an abstract illustration of a bar graph against a dark gray background. The graph consists of three vertical bars of varying heights, each with horizontal rectangles inside. The bars are shades of white and gray, creating a minimalist and modern design. This image can be used to represent data, growth, statistics, or business performance in a visually appealing manner.
Free with trial A set of simple and clean line art icons representing various financial and business concepts, including growth, decrease, profit, and loss. These icons are suitable for use in presentations, websites, and mobile applications. Decrease business graph vectors Simple Line Art Financial Chart Symbol Icon Set for Business Concept. A set of simple and clean line art icons representing various financial and business concepts, including growth, decrease, profit, and loss. These icons are suitable for use in presentations, websites, and mobile applications.
Free with trial This image depicts a bar graph with a clear downward trend. Blue bars decrease in height from left to right, representing a decline in value. A bold red arrow overlays the bars, visually emphasizing the negative trend. A blue line also shows a downward trend. The image conveys a sense of loss, recession, or negative performance and is suitable for illustrating financial or economic concepts. Decrease business graph illustrations Declining Bar Graph with Downward Trend Lines. This image depicts a bar graph with a clear downward trend. Blue bars decrease in height from left to right, representing a decline in value. A bold red arrow overlays the bars, visually emphasizing the negative trend. A blue line also shows a downward trend. The image conveys a sense of loss, recession, or negative performance and is suitable for illustrating financial or economic concepts.
Free with trial A dynamic, futuristic digital display showing a falling stock market chart. This detailed financial graph features glowing red candlestick patterns and line charts indicating a significant downward trend and high volatility. The image represents concepts like an economic crisis, bear market, financial recession, investment risk, and a stock market crash. It's an ideal visual for business reports, financial news, technology articles, and presentations on global economics, trading, or fintech, conveying a sense of urgency and downturn. Decrease business graph illustrations Stock Market Crash and Financial Downturn Graph. A dynamic, futuristic digital display showing a falling stock market chart. This detailed financial graph features glowing red candlestick patterns and line charts indicating a significant downward trend and high volatility. The image represents concepts like an economic crisis, bear market, financial recession, investment risk, and a stock market crash. It's an ideal visual for business reports, financial news, technology articles, and presentations on global economics, trading, or fintech, conveying a sense of urgency and downturn.
Free with trial An illustration of a simple line graph showing a decline or decrease, accompanied by an exclamation mark inside a triangle, indicating a warning, danger or risk. Suitable for topics like financial loss, market crash, or economic downturn. Decrease business graph vectors Simple Line Decline Graph with Exclamation Mark Attention Icon Design. An illustration of a simple line graph showing a decline or decrease, accompanied by an exclamation mark inside a triangle, indicating a warning, danger or risk. Suitable for topics like financial loss, market crash, or economic downturn.
Free with trial Vector illustration showing oil price decrease with dollar sign drop barrel fuel pump and declining graph representing economic impact and market trends in black and white style calm. Generative AI. Decrease business graph vectors Oil price drop concept with dollar sign barrel pump and graph vector illustration. Vector illustration showing oil price decrease with dollar sign drop barrel fuel pump and declining graph representing economic impact and market trends in black and white style calm. Generative AI
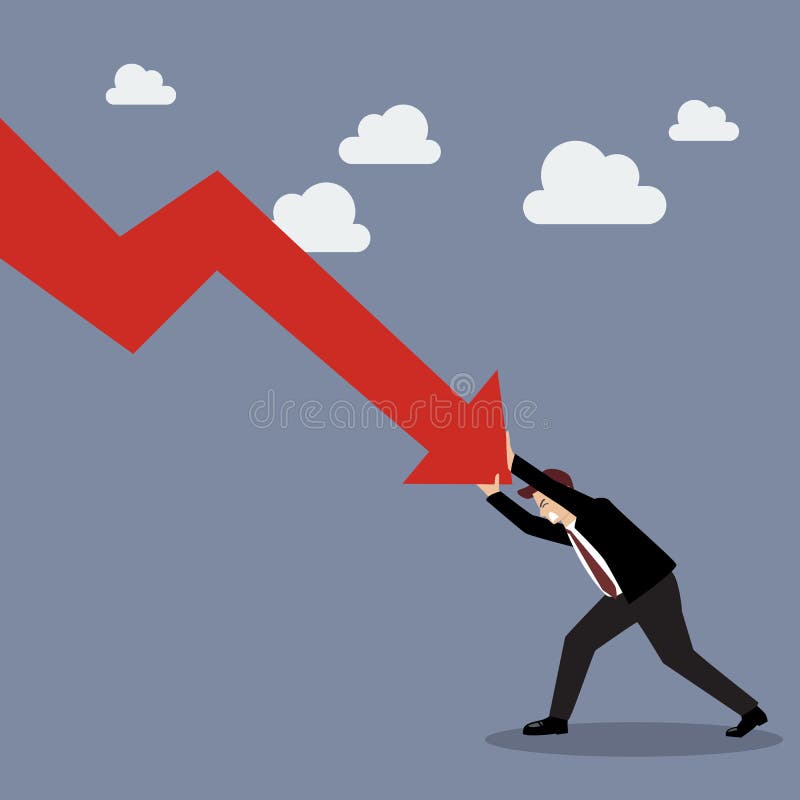
Free with trial Businessman pushing hard against falling graph down. Business Concept. Decrease business graph vectors Businessman pushing hard against falling graph down
Free with trial This graphic illustration depicts a stark representation of declining business performance. It features a bar chart with three colorful bars (yellow, orange, green) suggesting varying data points, overlaid with three distinct lines in yellow, blue, and orange, all sharply descending downwards. A prominent red arrow points downwards, emphasizing the negative trend. A small yellow plus sign is also visible, potentially signifying a point of reference or a contrasting element. The clean white background isolates the graphical elements, making them ideal for conveying concepts of loss, recession, or negative growth. Decrease business graph illustrations Declining Business Graph with Downward Arrows. This graphic illustration depicts a stark representation of declining business performance. It features a bar chart with three colorful bars (yellow, orange, green) suggesting varying data points, overlaid with three distinct lines in yellow, blue, and orange, all sharply descending downwards. A prominent red arrow points downwards, emphasizing the negative trend. A small yellow plus sign is also visible, potentially signifying a point of reference or a contrasting element. The clean white background isolates the graphical elements, making them ideal for conveying concepts of loss, recession, or negative growth.
Free with trial This image depicts a visual representation of financial or business growth and decline using a series of ascending and descending three-dimensional bar charts, where the left side shows smaller bars gradually increasing in height, transitioning through a central flat bar, and shifting to taller bars on the right side that progressively decrease, all set against a plain white background to. Decrease business graph illustrations Growth and progress concept with ascending and descending bar charts illustrating business success and financial improvement over. This image depicts a visual representation of financial or business growth and decline using a series of ascending and descending three-dimensional bar charts, where the left side shows smaller bars gradually increasing in height, transitioning through a central flat bar, and shifting to taller bars on the right side that progressively decrease, all set against a plain white background to
Free with trial A magnifying glass focuses on a declining bar graph and a file folder, symbolizing a decrease in sales and the need for. Decrease business graph illustrations Declining Sales Analysis Magnifying Glass, Downward Graph. A magnifying glass focuses on a declining bar graph and a file folder, symbolizing a decrease in sales and the need for.
Free with trial An isometric 3D bar graph with three descending steps, made of a glossy, reflective material with a blue and purple gradient. This illustrates a decrease or decline. Concept of financial loss or reduced metrics. Decrease business graph vectors Blue and Purple Isometric Bar Graph Showing a Downtrend. An isometric 3D bar graph with three descending steps, made of a glossy, reflective material with a blue and purple gradient. This illustrates a decrease or decline. Concept of financial loss or reduced metrics
Free with trial Hands of businessman with graph increase on background ,teamwork concept,business sign. vector illustration. Decrease business graph vectors Hands of businessman with graph increase on background
Free with trial Financial crisis, economic downturn, bankruptcy concept. 3D blue glass bar chart icon with arrow down, recession graph. Falling price, decline profit or asset value, decrease in sales. 3D illustration. Decrease business graph illustrations Financial crisis, economic downturn, bankruptcy concept. 3D blue glass bar chart icon with arrow down, recession graph. Falling. Price, decline profit or asset. Financial crisis, economic downturn, bankruptcy concept. 3D blue glass bar chart icon with arrow down, recession graph. Falling price, decline profit or asset value, decrease in sales. 3D illustration
Free with trial Black and white icon of a bar graph with short bars and a downward pointing arrow. Decrease business graph illustrations Bar graph with short bars and a downward pointing arrow bar chart decrease. Black and white icon of a bar graph with short bars and a downward pointing arrow