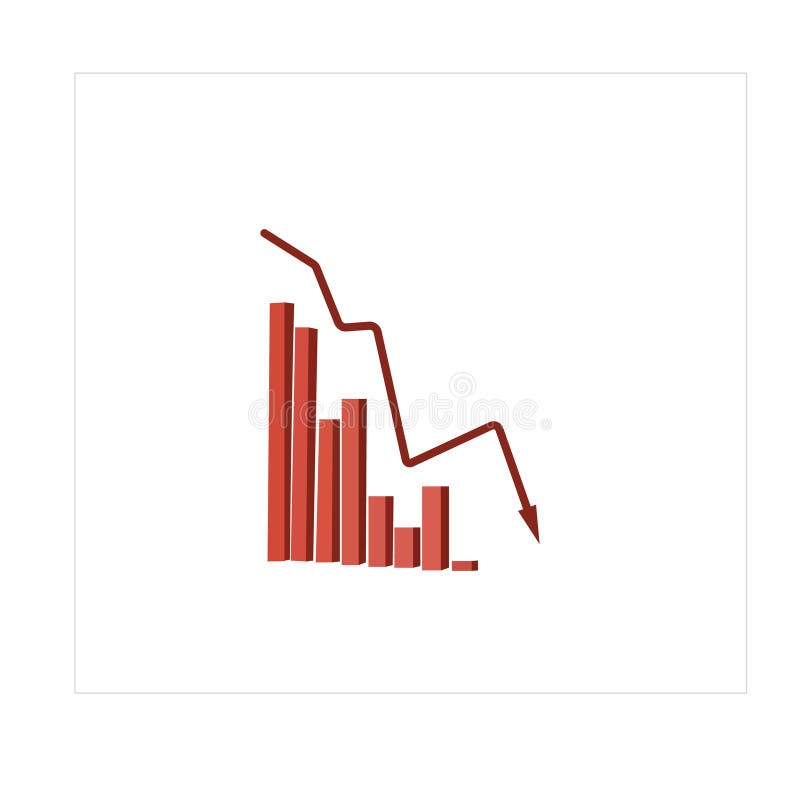
Free with trial 3d illustration of red decreasing graph on stand, financial presentation representing negative results or economic downturn. Decrease business graph vectors 3d illustration of red decreasing graph on stand, financial presentation representing negative results
Free with trial Illustration of a business activities. Decrease business graph vectors Illustration of a business activities
Free with trial Sad face near decreasing graph alongside warning triangle and green leaves conveying climate, environment, conservation, eco-crisis, risk, sustainability, and awareness. Simple flat metaphor. Decrease business graph illustrations Environmental crisis concept with decrease graph, warning triangle, sad face, and green leaves. Sad face near decreasing graph alongside warning triangle and green leaves conveying climate, environment, conservation, eco-crisis, risk, sustainability, and awareness. Simple flat metaphor
Free with trial A black upward arrow merges into a downward curving line graph on a white background. Decrease business graph illustrations Black upward arrow and downward curve graph on white background chart. A black upward arrow merges into a downward curving line graph on a white background
Free with trial A green line graph illustrating data points over time, with the y-axis labeled 'Value' and the x-axis labeled 'Time', showcasing significant ups and downs in the data. Decrease business graph illustrations Line graph showing fluctuating values over time. A green line graph illustrating data points over time, with the y-axis labeled 'Value' and the x-axis labeled 'Time', showcasing significant ups and downs in the data
Free with trial This 3D rendering showcases gold bars and coins against a backdrop of a dynamic stock market graph, generated by AI. The image evokes themes of wealth, investment, and market fluctuations. The high-quality rendering emphasizes the precious nature of gold. Decrease business graph illustrations Gold Bullion & Market Graph. This 3D rendering showcases gold bars and coins against a backdrop of a dynamic stock market graph, generated by AI. The image evokes themes of wealth, investment, and market fluctuations. The high-quality rendering emphasizes the precious nature of gold.
Free with trial A comprehensive collection of hand-drawn business and data visualization icons. This doodle-style set features a variety of essential elements, including different types of arrows, bar graphs, line charts, and pie charts. The sketchy, black and white illustrations are perfect for infographics, presentations, financial reports, and marketing materials. Each icon is isolated on a white background, representing concepts like growth, statistics, process flow, and direction. This versatile vector set is ideal for adding a creative, hand-made touch to any project related to analytics, finance, or strategy. Decrease business graph illustrations Hand Drawn Business and Finance Doodle Icon Set. A comprehensive collection of hand-drawn business and data visualization icons. This doodle-style set features a variety of essential elements, including different types of arrows, bar graphs, line charts, and pie charts. The sketchy, black and white illustrations are perfect for infographics, presentations, financial reports, and marketing materials. Each icon is isolated on a white background, representing concepts like growth, statistics, process flow, and direction. This versatile vector set is ideal for adding a creative, hand-made touch to any project related to analytics, finance, or strategy.
Free with trial Robotic Hand Interacting with Digital Cost Reduction Interface in a Futuristic Cityscape with Data Graphs and Business Icons Quark. Decrease business graph illustrations Robotic Hand Interacting with Digital Cost Reduction Interface in a Futuristic Cityscape with Data Graphs and Business
Free with trial A vibrant red arrow curves downwards, symbolizing a decrease, loss, or negative trajectory in a business or financial context. Decrease business graph illustrations Red arrow indicating downward trend and decline. A vibrant red arrow curves downwards, symbolizing a decrease, loss, or negative trajectory in a business or financial context
Free with trial Businessman in suit drawing a downward trending graph with the word RISK Clear details and vibrant colors enha. Decrease business graph illustrations Businessman drawing a downward trending graph with the word RISK risk chart. Businessman in suit drawing a downward trending graph with the word RISK Clear details and vibrant colors enha
Free with trial Black and white line graph comparing nominal and real return over time with axes labeled. Decrease business graph illustrations Black and white line graph showing nominal and real return over time chart nominal return. Black and white line graph comparing nominal and real return over time with axes labeled
Free with trial A black line graph icon showing a downward trend with an arrow pointing down on a white background. Decrease business graph illustrations Downward Trend Graph Icon with Arrow on White Background chart decline. A black line graph icon showing a downward trend with an arrow pointing down on a white background
Free with trial Black icon of a fluctuating graph with a downward trend arrow on a white background. Decrease business graph illustrations Black icon of a fluctuating graph with downward trend arrow chart data. Black icon of a fluctuating graph with a downward trend arrow on a white background
Free with trial Abstract 3d bar charts illustrating data visualization, financial statistics, and business analysis, presenting growth and decline trends in a report format. Decrease business graph illustrations Business data visualization showing 3d bar graphs. Abstract 3d bar charts illustrating data visualization, financial statistics, and business analysis, presenting growth and decline trends in a report format
Free with trial Ethanol price goes down drop decrease cheap in global commodity market trade export transaction vector. Decrease business graph vectors Ethanol price goes down drop decrease cheap in global commodity market trade export transaction
Free with trial Analyze the crash in the stock market crash. Learn from investment failure mistakes. Assess the damage from the business sector. Experts find the cause of the stock chart fall. Decrease business graph vectors Analyze the crash in the stock market crash. Learn from investment failure mistakes. Assess the damage from the business
Free with trial Black icon illustrating a downward sloping graph with an arrow indicating decline on a white background. Decrease business graph illustrations Black icon showing a downward sloping graph with an arrow chart decline. Black icon illustrating a downward sloping graph with an arrow indicating decline on a white background
Free with trial Black bar graph with downward arrows indicating a decline or loss on a white background. Decrease business graph illustrations Falling bar graph with downward arrows indicating decline or loss chart. Black bar graph with downward arrows indicating a decline or loss on a white background
Free with trial Aerial View of Business Professionals Collaborating on Cost Analysis with Laptop and Digital Graphs on Table in Modern Office Setting Quark. Decrease business graph illustrations Aerial View of Business Professionals Collaborating on Cost Analysis with Laptop and Digital Graphs on Table in Modern
Free with trial A close-up view of black financial and business chart icons arranged in a grid on a light background. Decrease business graph illustrations Close-up of financial and business chart icons on a grid finance charts. A close-up view of black financial and business chart icons arranged in a grid on a light background
Free with trial Set line Financial growth decrease Binary code Data analysis Search data with folder and Pie chart infographic icon. Vector. Decrease business graph illustrations Set line Financial growth decrease, Binary code, Data analysis, Search data, with folder and Pie chart infographic icon
Free with trial Set line Drop in crude oil price Dollar rate decrease Global economic crisis Safe Money bag and Calculation of expenses icon. Vector. Decrease business graph vectors Set line Drop in crude oil price, Dollar rate decrease, Global economic crisis, Safe, Money bag and Calculation of. Set line Drop in crude oil price Dollar rate decrease Global economic crisis Safe Money bag and Calculation of expenses icon. Vector.
Free with trial Collection of business growth and financial analysis icons featuring bar charts and arrows with editable line art and flat shape style. Editable vector icon set. Decrease business graph vectors Collection of business growth and financial analysis icons featuring bar charts and arrows with editable line art and flat shape
Free with trial Stock market. The rise and fall of securities. Successful trading. Market trend up green and red down arrows, financial graphs. Business investment growth and loss arrow. Graph going up and down symbol vector illustration. Decrease business graph vectors Stock market. The rise and fall of securities. Successful trading. Market trend up green and red down arrows, financial graphs.
Free with trial Stock market. The rise and fall of securities. Successful trading. Market trend up green and red down arrows, financial graphs. Business investment growth and loss arrow. Graph going up and down symbol vector illustration. Decrease business graph vectors Stock market. The rise and fall of securities. Successful trading. Market trend up green and red down arrows, financial graphs.
Free with trial Stock market. The rise and fall of securities. Successful trading. Market trend up green and red down arrows, financial graphs. Business investment growth and loss arrow. Graph going up and down symbol vector illustration. Decrease business graph vectors Stock market. The rise and fall of securities. Successful trading. Market trend up green and red down arrows, financial graphs.
Free with trial Stock market. The rise and fall of securities. Successful trading. Market trend up green and red down arrows, financial graphs. Business investment growth and loss arrow. Graph going up and down symbol vector illustration. Decrease business graph vectors Stock market. The rise and fall of securities. Successful trading. Market trend up green and red down arrows, financial graphs.
Free with trial Stock market. The rise and fall of securities. Successful trading. Market trend up green and red down arrows, financial graphs. Business investment growth and loss arrow. Graph going up and down symbol vector illustration. Decrease business graph vectors Stock market. The rise and fall of securities. Successful trading. Market trend up green and red down arrows, financial graphs.
Free with trial Stock market. The rise and fall of securities. Successful trading. Market trend up green and red down arrows, financial graphs. Business investment growth and loss arrow. Graph going up and down symbol vector illustration. Decrease business graph vectors Stock market. The rise and fall of securities. Successful trading. Market trend up green and red down arrows, financial graphs.
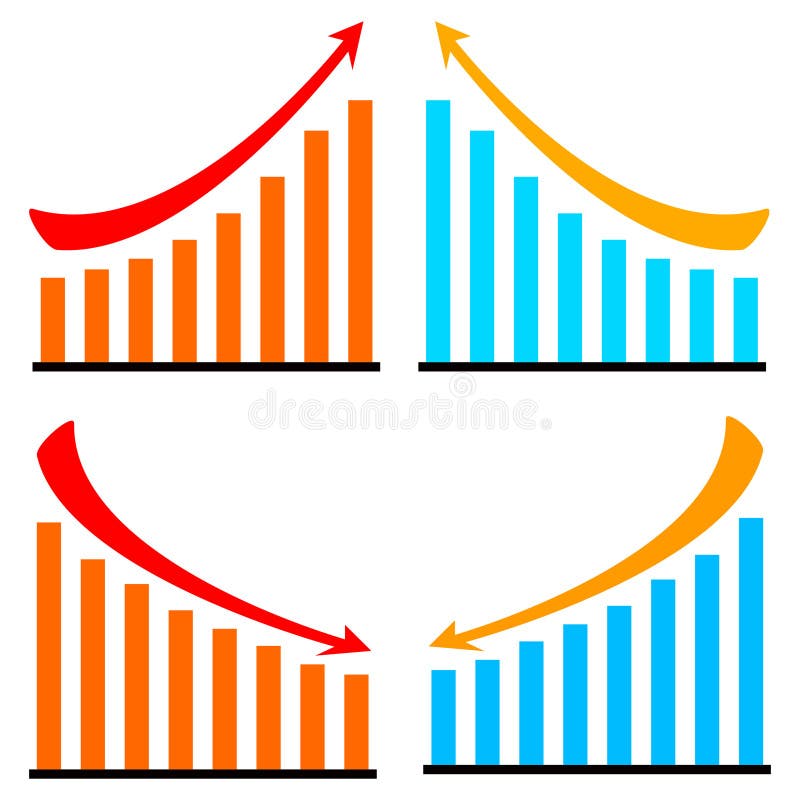
Free with trial Ascending and descending graph set. Vector illustration. Decrease business graph vectors Ascending and descending graph set.
Free with trial Displaying purple world map with rising red bars, red line graph on slide with green grid. Infographic, analytics, digital, technology, finance, strategic, modern. Decrease business graph illustrations Displaying purple world map with rising red bars, red line graph on slide with green grid
Free with trial Black icon of a falling graph with a downward arrow on a white background. Clear details and vibrant colors en. Decrease business graph illustrations Falling Graph with Downward Arrow Icon on White Background downward trend decline. Black icon of a falling graph with a downward arrow on a white background. Clear details and vibrant colors en
Free with trial Ascending and descending graph set. Vector illustration. Decrease business graph vectors Ascending and descending graph set.
Free with trial A collage of nine distinct charts and graphs, primarily displaying financial data, growth trends, and economic indicators. The visuals feature line graphs, area charts, and bar charts with various colored lines and shaded areas representing different metrics over time. Accompanying text and labels suggest analysis of business performance, economic growth, and financial markets. This collection is ideal for presentations, reports, and articles related to finance, economics, and business analytics. Decrease business graph illustrations Collection of Financial and Business Growth Charts. A collage of nine distinct charts and graphs, primarily displaying financial data, growth trends, and economic indicators. The visuals feature line graphs, area charts, and bar charts with various colored lines and shaded areas representing different metrics over time. Accompanying text and labels suggest analysis of business performance, economic growth, and financial markets. This collection is ideal for presentations, reports, and articles related to finance, economics, and business analytics.
Free with trial Grey Financial growth decrease icon isolated on purple-blue background. Increasing revenue. Minimalism concept. 3D render illustration. Decrease business graph illustrations Grey Financial growth decrease icon isolated on purple-blue background. Increasing revenue. Minimalism concept. 3D
Free with trial Up and down directional arrows in vector format for versatile use. Perfect for business infographics and data visualization. EPS 10. Decrease business graph vectors Up and down directional arrows in vector format for versatile use. Perfect for business infographics and data visualization. EPS 10
Free with trial A downward trending graph line with arrow is featured against a dark night sky filled with stars, suggesting economic downturn. Decrease business graph illustrations Decreasing Graph in Night Sky. A downward trending graph line with arrow is featured against a dark night sky filled with stars, suggesting economic downturn
Free with trial Purple-blue Financial growth decrease icon isolated on grey background. Increasing revenue. Minimalism concept. 3D render illustration. Decrease business graph illustrations Purple-blue Financial growth decrease icon isolated on grey background. Increasing revenue. Minimalism concept. 3D
Free with trial Illustration of a business activities. Decrease business graph vectors Illustration of a business activities
Free with trial Illustration of a business activities. Decrease business graph vectors Illustration of a business activities
Free with trial Illustration of a business activities. Decrease business graph vectors Illustration of a business activities
Free with trial Illustration of a business activities. Decrease business graph vectors Illustration of a business activities
Free with trial Illustration of a business activities. Decrease business graph vectors Illustration of a business activities
Free with trial Illustration of a business activities. Decrease business graph vectors Illustration of a business activities
Free with trial Illustration of a business activities. Decrease business graph vectors Illustration of a business activities
Free with trial Illustration of a business activities. Decrease business graph vectors Illustration of a business activities
Free with trial Illustration of a business activities. Decrease business graph vectors Illustration of a business activities
Free with trial Illustration of a business activities. Decrease business graph vectors Illustration of a business activities
Free with trial Illustration of a business activities. Decrease business graph vectors Illustration of a business activities
Free with trial Illustration of a business activities. Decrease business graph vectors Illustration of a business activities
Free with trial Illustration of a business activities. Decrease business graph vectors Illustration of a business activities
Free with trial Illustration of a business activities. Decrease business graph vectors Illustration of a business activities
Free with trial Illustration of a business activities. Decrease business graph illustrations Illustration of a business activities
Free with trial A visual representation of declining performance, with red bars and a descending line graph on a white background. Decrease business graph illustrations Red bar chart showing downward trend and line graph. A visual representation of declining performance, with red bars and a descending line graph on a white background.
Free with trial A black curve graph depicts a revenue slowdown on a white background. Clear details and vibrant colors enhance. Decrease business graph illustrations Black curve graph showing revenue slowdown on white background chart line. A black curve graph depicts a revenue slowdown on a white background. Clear details and vibrant colors enhance
Free with trial Illustration of a business activities. Decrease business graph vectors Illustration of a business activities
Free with trial A white line graph with connected points and a bar chart are shown within a dark gray circle icon, representing data analysis. Decrease business graph illustrations White line graph and bar chart in a dark gray circle icon data statistics. A white line graph with connected points and a bar chart are shown within a dark gray circle icon, representing data analysis
Free with trial A downward trend is shown on a graph. The graph is black and white. Decrease business graph illustrations A downward trend is shown on a graph
Free with trial Set Coal mine trolley Server Pie chart infographic Financial growth Data analysis decrease and Sales funnel with icon. Vector. Decrease business graph vectors Set Coal mine trolley, Server, Pie chart infographic, Financial growth, Data analysis, decrease, and Sales funnel with. Set Coal mine trolley Server Pie chart infographic Financial growth Data analysis decrease and Sales funnel with icon. Vector.
Free with trial Logotype line Financial growth decrease icon isolated on grey background. Increasing revenue. Logo design template element. Vector. Decrease business graph illustrations Logotype line Financial growth decrease icon isolated on grey background. Increasing revenue. Logo design template
Free with trial A 3D blue bar chart and a dark blue line graph illustrate a significant downward trend, indicating a decline in data over time. Decrease business graph illustrations Blue bar chart and line graph showing downward trend. A 3D blue bar chart and a dark blue line graph illustrate a significant downward trend, indicating a decline in data over time.
Free with trial A conceptual image featuring a series of ascending wooden blocks, with a green upward arrow on a lower block and a red downward arrow on a higher block, symbolizing the fluctuating nature of business, market trends, and financial performance. The image conveys concepts of success, failure, progress, and setback in a clear and concise manner. Decrease business graph illustrations Wooden Blocks with Up and Down Arrows Representing Business Growth and Decline. A conceptual image featuring a series of ascending wooden blocks, with a green upward arrow on a lower block and a red downward arrow on a higher block, symbolizing the fluctuating nature of business, market trends, and financial performance. The image conveys concepts of success, failure, progress, and setback in a clear and concise manner
Free with trial Smiling blue face beside a decreasing bar graph, signifying satisfaction, feedback, or performance trends. Ideal for analytics, feedback, emotions, surveys, performance data presentation simple. Decrease business graph vectors Positive Feedback Represented by Happy Face and Declining Bar Graph. Smiling blue face beside a decreasing bar graph, signifying satisfaction, feedback, or performance trends. Ideal for analytics, feedback, emotions, surveys, performance data presentation simple
Free with trial A bright blue neon arrow points downwards against a dark industrial wall, symbolizing loss or decrease for illustrative purposes. Decrease business graph illustrations Neon Arrow Down Indicator Graph. A bright blue neon arrow points downwards against a dark industrial wall, symbolizing loss or decrease for illustrative purposes
Free with trial White Financial growth decrease icon isolated with long shadow background. Increasing revenue. Circle button. Vector. Decrease business graph vectors White Financial growth decrease icon isolated with long shadow background. Increasing revenue. Circle button. Vector
Free with trial A visual representation of declining trends, depicted by a graph with red and blue lines moving downwards, symbolizing a negative trajectory or market shift. Decrease business graph illustrations Downward trending graph with word trends. A visual representation of declining trends, depicted by a graph with red and blue lines moving downwards, symbolizing a negative trajectory or market shift
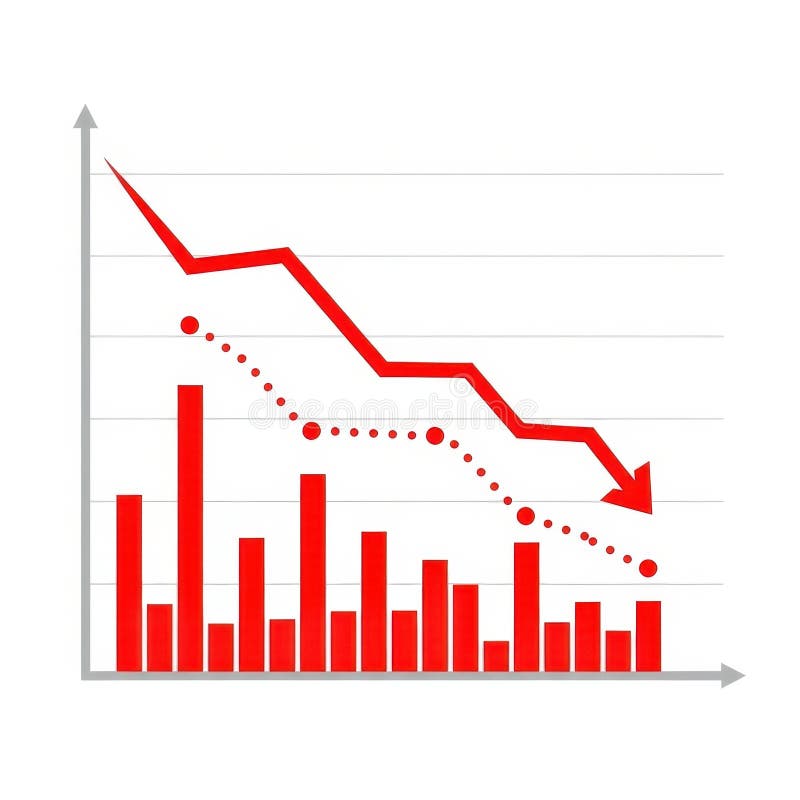
Free with trial A visual representation of negative financial performance. It features red bars and a red line graph showing a downward trend, accompanied by a dotted line indicating a similar pattern. Decrease business graph illustrations Red downward trending graph with bars and dotted line. A visual representation of negative financial performance. It features red bars and a red line graph showing a downward trend, accompanied by a dotted line indicating a similar pattern
Free with trial Stock market display with a red line graph indicating a downward trend on a digital screen. The graph is composed of jagged peaks and troughs, suggesting instability. Surrounding the graph are numeric data and grid lines, highlighting market performance details. The screen is located in a financial setting with a blurred, busy background, possibly an office or trading floor, enhancing the context of economic activity. The color red typically signifies a decrease or negative trend in market terms. Decrease business graph illustrations Red Stock Market Crash On Screen. Stock market display with a red line graph indicating a downward trend on a digital screen. The graph is composed of jagged peaks and troughs, suggesting instability. Surrounding the graph are numeric data and grid lines, highlighting market performance details. The screen is located in a financial setting with a blurred, busy background, possibly an office or trading floor, enhancing the context of economic activity. The color red typically signifies a decrease or negative trend in market terms.
Free with trial Blue sad face next to a declining line graph in a calendar frame under a cloud. Ideal for business loss, economic crisis, emotional impact, failure, disappointment, analytics, trends. Simple flat. Decrease business graph vectors Sad face and declining data chart representing failure, downturn, or negative outcome concept. Blue sad face next to a declining line graph in a calendar frame under a cloud. Ideal for business loss, economic crisis, emotional impact, failure, disappointment, analytics, trends. Simple flat
Free with trial Set line Global economic crisis Gold bars Debt ball chained to coin Dollar rate decrease Prison cell door Safe and icon. Vector. Decrease business graph illustrations Set line Global economic crisis, Gold bars, Debt ball chained to coin, Dollar rate decrease, Prison cell door, Safe and
Free with trial Financial arrows up and down. Financial growth and decline. Graph with green and red arrows. Finance diagram, graphic charts icon set. Decrease business graph vectors Financial arrows up and down. Financial growth and decline. Graph with green and red arrows. Finance diagram, graphic charts icon
Free with trial A visual representation of a financial or business trend showing a steady decrease over time. The bar chart illustrates negative performance with a prominent downward arrow. Decrease business graph illustrations Declining bar chart showing downward trend with arrow. A visual representation of a financial or business trend showing a steady decrease over time. The bar chart illustrates negative performance with a prominent downward arrow
Free with trial Stack of gold coins are arranged against a backdrop of a red descending graph line, signifying financial loss, economic downturn, and market challenges. Image is generated using AI. Decrease business graph illustrations Stack Of Coins With Falling Graph. Stack of gold coins are arranged against a backdrop of a red descending graph line, signifying financial loss, economic downturn, and market challenges. Image is generated using AI
Free with trial Abstract 3D render of a financial growth chart. The image features a series of vertical bars, some in teal and others in orange, representing data points on a graph. The bars increase in height towards the right, suggesting positive growth or progress. The chart is set against a dark background with a subtle grid pattern and a reflective surface, adding depth and visual interest. Suitable for illustrating financial reports, market analysis, or business trends. Decrease business graph illustrations Abstract Financial Growth Chart. Abstract 3D render of a financial growth chart. The image features a series of vertical bars, some in teal and others in orange, representing data points on a graph. The bars increase in height towards the right, suggesting positive growth or progress. The chart is set against a dark background with a subtle grid pattern and a reflective surface, adding depth and visual interest. Suitable for illustrating financial reports, market analysis, or business trends.
Free with trial A silver laptop sits on a light brown wooden surface. Its screen displays a dark background with a grid pattern and a prominent red line graph sharply declining from left to right. The red line is brightly lit, creating a strong visual contrast against the dark background. The overall mood is one of concern or warning, suggesting a negative trend or decline. The image is clean and simple, focusing, generated by AI. Decrease business graph illustrations Laptop Screen Showing Red Downward Trend Graph computer. A silver laptop sits on a light brown wooden surface. Its screen displays a dark background with a grid pattern and a prominent red line graph sharply declining from left to right. The red line is brightly lit, creating a strong visual contrast against the dark background. The overall mood is one of concern or warning, suggesting a negative trend or decline. The image is clean and simple, focusing, generated by AI.
Free with trial A blue bar and line graph showing upward financial trends against a backdrop of a world map, symbolizing global economic growth and market expansion. Decrease business graph illustrations Global business growth chart with world map background. A blue bar and line graph showing upward financial trends against a backdrop of a world map, symbolizing global economic growth and market expansion
Free with trial Line Financial growth decrease icon isolated on white background. Increasing revenue. Colorful outline concept. Vector. Decrease business graph illustrations Line Financial growth decrease icon isolated on white background. Increasing revenue. Colorful outline concept. Vector
Free with trial Set Financial growth decrease Cloud computing lock Pie chart infographic Server Sales funnel with and Data analysis icon. Vector. Decrease business graph illustrations Set Financial growth decrease, Cloud computing lock, Pie chart infographic, Server, Sales funnel with, and Data analysis
Free with trial 3D red bar graph with downward arrows indicating decline. Suitable for diverse creative needs. Decrease business graph illustrations 3D red bar graph with downward arrows indicating decline.
Free with trial Isometric line Financial growth decrease icon isolated on pink and blue background. Increasing revenue. Square button. Vector. Decrease business graph vectors Isometric line Financial growth decrease icon isolated on pink and blue background. Increasing revenue. Square button