Free with trial Red wooden arrow points downwards on dark black background. Economic decline market downturn. Close-up image highlights negative direction in business. Image represent various economic. Decrease business graph illustrations Red wooden arrow points downwards on dark black background. Economic decline market downturn. Close-up image highlights negative
Free with trial A hand adds to a graph depicting a sharp decline in the global economy, shown as a cracked map. This AI-generated image symbolizes the fragility of the world's financial systems and the potential for widespread economic crisis. The red line emphasizes the severity of the downturn. Decrease business graph illustrations Global Economic Decline. A hand adds to a graph depicting a sharp decline in the global economy, shown as a cracked map. This AI-generated image symbolizes the fragility of the world's financial systems and the potential for widespread economic crisis. The red line emphasizes the severity of the downturn.
Free with trial A simple, bold red arrow trending downwards against a white background. The arrow zigzags downwards, ending with an arrowhead pointing down, resting on a horizontal red line. This image represents concepts like financial loss, economic downturn, market crash, failure, and negative trends. It's suitable for illustrating articles, presentations, or reports dealing with business, finance, and economics. Decrease business graph illustrations Red Downward Trend Arrow. A simple, bold red arrow trending downwards against a white background. The arrow zigzags downwards, ending with an arrowhead pointing down, resting on a horizontal red line. This image represents concepts like financial loss, economic downturn, market crash, failure, and negative trends. It's suitable for illustrating articles, presentations, or reports dealing with business, finance, and economics.
Free with trial A striking and impactful collection of illustrations depicting a stock market crash with dramatic downward trend graphs. Decrease business graph vectors Stock market crash down graph illustration. A striking and impactful collection of illustrations depicting a stock market crash with dramatic downward trend graphs
Free with trial Multicolored graph trending downward icon. Decrease business graph illustrations Wfh140125. Multicolored graph trending downward icon
Free with trial Vector 3D illustration of green arrow falling down. Decline graph. For diagrams and infographics. Business achievements. Isolated background. Render. Minimalism. Cursor. Decrease business graph vectors Vector 3D illustration of green arrow falling down.
Free with trial Red 3d arrow going down stock icon on white background. Bankruptcy, financial market crash icon for your web site design, logo, app, UI. graph chart downtrend symbol. chart going down sign. Decrease business graph vectors Red 3d arrow going down stock icon on white background. Bankruptcy, financial market crash icon for your web
Free with trial Reduction chart icon Vector symbol or sign set collection in black and white outline. Decrease business graph vectors Decline Chart Icon Illustrating Decrease in Performance, Economic Downturn, and Analytical Data. Reduction chart icon Vector symbol or sign set collection in black and white outline
Free with trial Clean animated bar chart visualizing rising and falling market trends with green bars representing growth, profit, and positive performance, and red bars indicating decline, loss, and negative movement. Symbolizes financial volatility, stock market cycles, economic fluctuations, investment performance, and business analytics. Ideal for illustrating bullish and bearish phases, economic indicators, trading activity, and financial data visualization. Decrease business graph illustrations Financial Market Trend Animation Showing Upturn and Downturn Phases. Clean animated bar chart visualizing rising and falling market trends with green bars. Clean animated bar chart visualizing rising and falling market trends with green bars representing growth, profit, and positive performance, and red bars indicating decline, loss, and negative movement. Symbolizes financial volatility, stock market cycles, economic fluctuations, investment performance, and business analytics. Ideal for illustrating bullish and bearish phases, economic indicators, trading activity, and financial data visualization.
Free with trial Illustration of a businessman running from the rock of problems, investment asset fall down, World economic recession, problem on business, decline concept, Debt problem, finance problem. Decrease business graph illustrations Illustration of a businessman running from the rock of problems, investment asset fall down, World economic recession, problem on
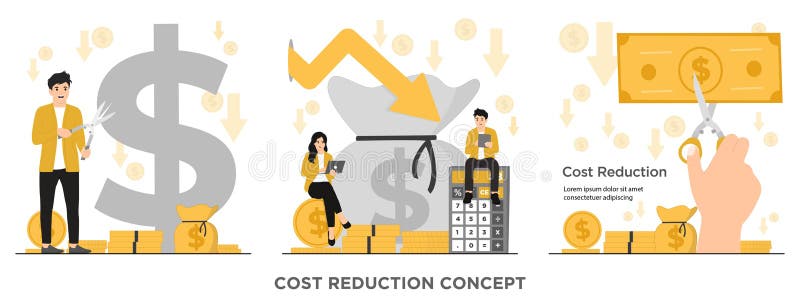
Free with trial Discover the power of cost reduction and optimization with our flat vector illustration. Cut costs and boost your business's efficiency today!. Decrease business graph vectors Flat vector costs reduction costs cut costs optimization business concept illustration. Discover the power of cost reduction and optimization with our flat vector illustration. Cut costs and boost your business's efficiency today!
Free with trial Cost reduction icon web design logo set collection in flat vector. Decrease business graph vectors Cost Reduction Icon Illustrating Business Efficiency Strategies, Budget Management Solutions, and Expense Reduction Programs for. Cost reduction icon web design logo set collection in flat vector
Free with trial Set Data analysis, Binary code, Folder and lock, Financial growth, Search data, and decrease icon. Vector. Decrease business graph vectors Set Data analysis, Binary code, Folder and lock, Financial growth, Search data, and decrease icon. Vector
Free with trial Economic downturn shown with large red arrow pointing down, financial decline and recession graph concept. Decrease business graph illustrations Economic downturn shown with large red arrow pointing down
Free with trial Set Dollar rate decrease, Drop in crude oil price, Gold bars and Hanging sign with Sale on seamless pattern. Vector. Decrease business graph vectors Set Dollar rate decrease, Drop in crude oil price, Gold bars and Hanging sign with Sale on seamless pattern. Vector
Free with trial Recession concept. Falling market. The trading broker is horrified at the falling market. Financial graph down. Vector illustration isometric design. Decrease business graph illustrations Recession concept. Falling market. Vector illustration isometric design. Recession concept. Falling market. The trading broker is horrified at the falling market. Financial graph down. Vector illustration isometric design.
Free with trial Recession concept. Falling market. The trading broker is horrified at the falling market. Financial graph down. Vector illustration isometric design. Decrease business graph vectors Recession concept. Falling market. Vector illustration isometric design. Recession concept. Falling market. The trading broker is horrified at the falling market. Financial graph down. Vector illustration isometric design.
Free with trial Recession concept. Falling market. The trading broker is horrified at the falling market. Financial graph down. Vector illustration isometric design. Decrease business graph vectors Recession concept. Falling market. Vector illustration isometric design. Recession concept. Falling market. The trading broker is horrified at the falling market. Financial graph down. Vector illustration isometric design.
Free with trial Gold coins stacked with a red downward arrow and graph line on a red background. Concept of economic decline. 3D Rendering. Decrease business graph illustrations Gold coins and downtrend arrow on red background. 3D Rendering. Gold coins stacked with a red downward arrow and graph line on a red background. Concept of economic decline. 3D Rendering
Free with trial Global financial crisis trade war downfall graph design vector. Decrease business graph vectors Global financial crisis trade war downfall graph design
Free with trial A 3D icon depicting an orange arrow pointing downwards in a zigzag pattern. The icon suggests downward movement, decline, decrease, or negative progress. It's commonly used to represent falling trends, negative changes, or downward movement in data or statistics. Decrease business graph vectors Arrow Chart Down 3D Icon. A 3D icon depicting an orange arrow pointing downwards in a zigzag pattern. The icon suggests downward movement, decline, decrease, or negative progress. It's commonly used to represent falling trends, negative changes, or downward movement in data or statistics.
Free with trial A vibrant pink graph line ascends diagonally against a dark background, representing upward growth. The image evokes a sense of dynamic increase. The style is reminiscent of a modern, technological aesthetic. The subtle grid pattern in the background adds depth, created to simulate a data visualizat. Decrease business graph illustrations Uptrend. A vibrant pink graph line ascends diagonally against a dark background, representing upward growth. The image evokes a sense of dynamic increase. The style is reminiscent of a modern, technological aesthetic. The subtle grid pattern in the background adds depth, created to simulate a data visualizat
Free with trial A man is writing in a notebook while looking at a graph. The graph shows a downward trend, which may indicate a decrease in sales or a negative outcome. Decrease business graph illustrations A man is writing in a notebook while looking at a graph
Free with trial Bull Market, Bull or bullish run Bear or bearish market trend in stocks. Trade exchange, green up or red down arrows graph. Cryptocurrency price chart. Global economy crash or boom. Decrease business graph vectors Bull Market
Free with trial This image depicts a global economic downturn using a visual representation. A large, white downward-pointing arrow dominates the scene, positioned over a grayscale world map. The map is overlaid on a dark red background, which further emphasizes the negative trend. Red bar graphs, scattered across the map, visually represent the economic decline in different regions, highlighting the severity of the situation. Numerical data points on the graph add to the visual impact and sense of decline. The overall effect creates a powerful and alarming visual metaphor for a worldwide economic crisis or recession. Decrease business graph illustrations Global Economic Downturn Illustrated with World Map and Charts. This image depicts a global economic downturn using a visual representation. A large, white downward-pointing arrow dominates the scene, positioned over a grayscale world map. The map is overlaid on a dark red background, which further emphasizes the negative trend. Red bar graphs, scattered across the map, visually represent the economic decline in different regions, highlighting the severity of the situation. Numerical data points on the graph add to the visual impact and sense of decline. The overall effect creates a powerful and alarming visual metaphor for a worldwide economic crisis or recession.
Free with trial A 3D red downward arrow on financial graph, symbolizing decline and loss. Decrease business graph illustrations 3D red downward arrow isolated. A 3D red downward arrow on financial graph, symbolizing decline and loss
Free with trial Red arrow graph depicting a downward trend on a white background. The arrow has a zigzag shape, indicating a decrease or decline, often used in financial contexts to represent falling figures or negative growth. The bold red color enhances its visibility and conveys urgency or alert. Decrease business graph vectors Red downturn arrow. Red arrow graph depicting a downward trend on a white background. The arrow has a zigzag shape, indicating a decrease or decline, often used in financial contexts to represent falling figures or negative growth. The bold red color enhances its visibility and conveys urgency or alert.
Free with trial Reduction chart icon isolated on white background. Eps 10. Decrease business graph vectors Reduction Chart Icon Set. Downward graph vector symbol in a black filled and outlined style. Decline Trend Sign. Reduction chart icon isolated on white background. Eps 10
Free with trial Reduction chart icon isolated on white background. Eps 10. Decrease business graph vectors Reduction Chart Icon Set. Downward graph vector symbol in a black filled and outlined style. Decline Trend Sign. Reduction chart icon isolated on white background. Eps 10
Free with trial Reduction chart icon isolated on white background. Eps 10. Decrease business graph vectors Reduction Chart Icon Set. Downward graph vector symbol in a black filled and outlined style. Decline Trend Sign. Reduction chart icon isolated on white background. Eps 10
Free with trial Reduction chart icon isolated on white background. Eps 10. Decrease business graph vectors Reduction Chart Icon Set. Downward graph vector symbol in a black filled and outlined style. Decline Trend Sign. Reduction chart icon isolated on white background. Eps 10
Free with trial Spilled oil beside a sharply downward trending graph, generated by AI, visually represents the dramatic fall in oil prices. The image suggests instability and economic downturn within the oil market. Decrease business graph illustrations Oil Price Crash. Spilled oil beside a sharply downward trending graph, generated by AI, visually represents the dramatic fall in oil prices. The image suggests instability and economic downturn within the oil market.
Free with trial Reduction chart icon isolated on white background. Eps 10. Decrease business graph vectors Reduction Chart Icon Set. Downward graph vector symbol in a black filled and outlined style. Decline Trend Sign. Reduction chart icon isolated on white background. Eps 10
Free with trial This image shows a declining bar graph and a person reacting to a financial crisis. Vector illustration design using ai tool. Decrease business graph vectors Economic collapse is coming. This image shows a declining bar graph and a person reacting to a financial crisis. Vector illustration design using ai tool.
Free with trial Image is generated with the use of an AI. Decrease business graph illustrations Chart market stock technology indicator crisis visualization economy crash diagram glow background shiny data finance graph money. image is generated with the use of an AI
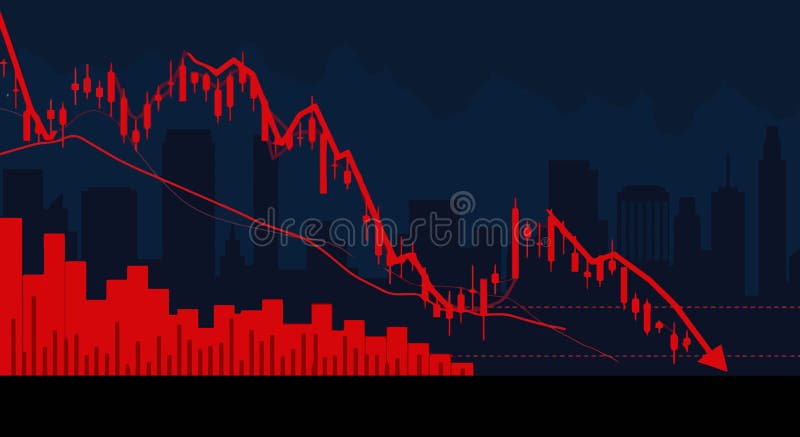
Free with trial This image shows a declining stock market graph with red candlesticks and bars. Vector illustration design using ai tool. Decrease business graph vectors Stock market crash recession. This image shows a declining stock market graph with red candlesticks and bars. Vector illustration design using ai tool.
Free with trial Reduction chart icon isolated on white background. Eps 10. Decrease business graph vectors Reduction Chart Icon Set. Downward graph vector symbol in a black filled and outlined style. Decline Trend Sign. Reduction chart icon isolated on white background. Eps 10
Free with trial Market fluctuation in British Pound or Sterling currency. Devaluation and decrease in exchange rate value of Sterling. Recession, inflation, depression and falling economy. 3D render. Decrease business graph illustrations Market fluctuation in British Pound or Sterling currency
Free with trial A downward trending red arrow, generated by AI, rests on a smartphone displaying a graph, symbolizing a market decline. This visualization is a powerful representation of negative financial trends and economic downturn, ideal for illustrating news reports or financial analyses. Decrease business graph illustrations Mobile Market Crash. A downward trending red arrow, generated by AI, rests on a smartphone displaying a graph, symbolizing a market decline. This visualization is a powerful representation of negative financial trends and economic downturn, ideal for illustrating news reports or financial analyses.
Free with trial Red arrow is pointing down over a cliff, representing failure and decline in business. 3D render. Decrease business graph illustrations Red arrow pointing down over a cliff representing failure. Red arrow is pointing down over a cliff, representing failure and decline in business. 3D render
Free with trial This image, generated by AI, depicts a downward trending graph inside a caged cube, symbolizing economic downturn. A jar of coins nearby further emphasizes the financial implications. The red arrow dramatically highlights the severity of the decline. Decrease business graph illustrations Declining Economy: AI. This image, generated by AI, depicts a downward trending graph inside a caged cube, symbolizing economic downturn. A jar of coins nearby further emphasizes the financial implications. The red arrow dramatically highlights the severity of the decline.
Free with trial This image shows a declining bar graph with broken bars and a downward trend line. Vector illustration design using ai tool. Decrease business graph vectors Stock market crash. This image shows a declining bar graph with broken bars and a downward trend line. Vector illustration design using ai tool.
Free with trial A blue line chart illustrates a downward trend, suggesting decline and loss and can be used to show financial or business performance. Decrease business graph illustrations Downward Trend Chart. A blue line chart illustrates a downward trend, suggesting decline and loss and can be used to show financial or business performance
Free with trial Analyzing the business failure and decline. White magnifying glass analyzing a growth chart on a blue background, representing market analysis and business growth. 3D render. Decrease business graph illustrations Magnifying glass analyzing growth chart on blue background. Analyzing the business failure and decline. White magnifying glass analyzing a growth chart on a blue background, representing market analysis and business growth. 3D render
Free with trial Cost optimization concept. Idea of financial and marketing strategy. Cost and income balance. Spending and cost reduction, while maximizing business value. flat vector modern illustration. Decrease business graph vectors Cost optimization concept. Idea of financial and marketing strategy. Cost and income balance.
Free with trial Analyzing causes of financial difficulties, finding survival strategy during economic crisis or market crash, team brainstorm to solve problems of declining business value, men near broken euro sign. Decrease business graph vectors Men near broken euro sign
Free with trial Creative abstract background with multiple glowing downward arrows in red and orange tones. Graphic representation of financial loss, bear market, economic downturn, and business failure. High-tech digital design with selective focus and light effects for financial and data analysis concepts. Decrease business graph illustrations Glowing downward arrows on red background representing economic crash and market decline. Creative abstract background with multiple glowing downward arrows in red and orange tones. Graphic representation of financial loss, bear market, economic downturn, and business failure. High-tech digital design with selective focus and light effects for financial and data analysis concepts.
Free with trial Abstract isometric view of multiple red arrows moving downward on a dark grid texture with selective focus. Business and finance concept illustrating a market crash, economic downturn, negative growth, and decreasing investment value. Decrease business graph illustrations Red down arrows on grid background representing financial decline and stock market crash. Abstract isometric view of multiple red arrows moving downward on a dark grid texture with selective focus. Business and finance concept illustrating a market crash, economic downturn, negative growth, and decreasing investment value.
Free with trial A close-up of a stock market chart showing a sharp downturn. The orange line graph against a dark background with gridlines illustrates the volatility and potential risks in financial markets. The image captures the urgency and anxiety associated with market fluctuations. The "MA 1000" text is visib. Decrease business graph illustrations Stock Market Downturn. A close-up of a stock market chart showing a sharp downturn. The orange line graph against a dark background with gridlines illustrates the volatility and potential risks in financial markets. The image captures the urgency and anxiety associated with market fluctuations. The "MA 1000" text is visib
Free with trial This image depicts a sharply declining stock market graph, generated by AI, highlighting the severity of the downturn. The red arrow emphasizes the dramatic fall in market values, representing a potential crisis for investors. Decrease business graph illustrations Market Crash: Red Alert. This image depicts a sharply declining stock market graph, generated by AI, highlighting the severity of the downturn. The red arrow emphasizes the dramatic fall in market values, representing a potential crisis for investors.
Free with trial A 3D rendered illustration depicting business growth. The image showcases two upward-trending arrow charts, one in gold and the other in blue, representing positive trends, progress, and success. The charts are set against a clean, light background, emphasizing the upward movement and potential for financial gain. Suitable for illustrating economic growth, investment strategies, and business performance. Decrease business graph illustrations Growth Chart with Arrows. A 3D rendered illustration depicting business growth. The image showcases two upward-trending arrow charts, one in gold and the other in blue, representing positive trends, progress, and success. The charts are set against a clean, light background, emphasizing the upward movement and potential for financial gain. Suitable for illustrating economic growth, investment strategies, and business performance.
Free with trial Power decrease schedule RGB color icon. Monthly planner. Time management. Energy, voltage. Declining chart. Isolated vector illustration. Simple filled line drawing. Editable stroke. Decrease business graph illustrations Power decrease schedule RGB color icon
Free with trial This image shows a financial report with bar graphs and numerical data, generated by AI, suggesting business performance or investment analysis. The document rests on a wooden desk, with coins blurred in the background, hinting at financial matters. Decrease business graph illustrations Financial Report Analysis. This image shows a financial report with bar graphs and numerical data, generated by AI, suggesting business performance or investment analysis. The document rests on a wooden desk, with coins blurred in the background, hinting at financial matters.
Free with trial Three red, 3D arrows curving downwards, generated by AI, symbolize decline, decrease, or downturn. The image offers a visual representation of negative trends or a downward trajectory, suitable for presentations or reports. Decrease business graph illustrations Red Arrows Pointing Down. Three red, 3D arrows curving downwards, generated by AI, symbolize decline, decrease, or downturn. The image offers a visual representation of negative trends or a downward trajectory, suitable for presentations or reports.
Free with trial A computer displays a dramatic downward trending graph, generated by AI, symbolizing a market crash or economic downturn. The image is a 3D rendering showing a clean, modern workspace setting, highlighting the severity of the financial decline depicted on screen. Decrease business graph illustrations Market Crash Simulation. A computer displays a dramatic downward trending graph, generated by AI, symbolizing a market crash or economic downturn. The image is a 3D rendering showing a clean, modern workspace setting, highlighting the severity of the financial decline depicted on screen.
Free with trial A minimalist bar chart with a descending line graph overlay, symbolizing financial loss, performance decline, or negative data trends. Ideal for presentations, dashboards, economic reports, and warning visuals. Decrease business graph vectors Downward Trend Bar Chart Icon. A minimalist bar chart with a descending line graph overlay, symbolizing financial loss, performance decline, or negative data trends. Ideal for presentations, dashboards, economic reports, and warning visuals
Free with trial Set line Dollar rate decrease Glass money jar with coin Global economic crisis Broken piggy bank Calculation of expenses Hanging sign Sale and Drop crude oil price icon. Vector. Decrease business graph vectors Set line Dollar rate decrease, Glass money jar with coin, Global economic crisis, Broken piggy bank, Calculation of. Set line Dollar rate decrease Glass money jar with coin Global economic crisis Broken piggy bank Calculation of expenses Hanging sign Sale and Drop crude oil price icon. Vector.
Free with trial A man stands in front of a bar and line graph showing a downward trend. Vector art design using ai tool. Decrease business graph vectors Stock Market Downward Illustration. A man stands in front of a bar and line graph showing a downward trend. Vector art design using ai tool.
Free with trial A stock market graph depicting a downturn is shown through a rain-covered window. The image, generated by AI, creates a mood of economic uncertainty and pessimism. The blurred background adds to the overall sense of ambiguity. Decrease business graph illustrations Rainy Day Market Decline. A stock market graph depicting a downturn is shown through a rain-covered window. The image, generated by AI, creates a mood of economic uncertainty and pessimism. The blurred background adds to the overall sense of ambiguity.
Free with trial This image depicts a downward trending arrow formed by a series of red dots against a bright blue sky with fluffy white clouds. The trajectory is clearly negative, visually representing a decline or decrease. This graphic was generated by AI, offering a simple yet effective visual representation of. Decrease business graph illustrations AI Generated Downward Trend. This image depicts a downward trending arrow formed by a series of red dots against a bright blue sky with fluffy white clouds. The trajectory is clearly negative, visually representing a decline or decrease. This graphic was generated by AI, offering a simple yet effective visual representation of
Free with trial Dollar Vector illustration on a transparent background. Premium quality symmbols. Line Color vector icons for concept and graphic design. Decrease business graph illustrations Dollar coin money down business. Dollar Vector illustration on a transparent background. Premium quality symmbols. Line Color vector icons for concept and graphic design
Free with trial Descending white cylinder steps. Empty podium for product display. Bar chart and business decline or failure. Financial profit loss and economic crisis. 3D render. Decrease business graph illustrations Descending white cylinder steps. Empty podium for product display
Free with trial Three orange bar graphs illustrating different data patterns increasing, decreasing, and varied. Ideal for presentations or data visualization. Simple and visually appealing design. Decrease business graph illustrations Orange Bar Graph Variations. Three orange bar graphs illustrating different data patterns increasing, decreasing, and varied. Ideal for presentations or data visualization. Simple and visually appealing design.
Free with trial A collection of hand-drawn, black and white icons representing growth, decline, and financial concepts. The set includes upward and downward arrows, percentage symbols, and a bar graph illustrating trends. The simple line art style makes these icons versatile for various applications, including presentations, infographics, and website design. They convey concepts of progress, success, loss, and market fluctuations. Decrease business graph illustrations Growth and Decline Icons Set. A collection of hand-drawn, black and white icons representing growth, decline, and financial concepts. The set includes upward and downward arrows, percentage symbols, and a bar graph illustrating trends. The simple line art style makes these icons versatile for various applications, including presentations, infographics, and website design. They convey concepts of progress, success, loss, and market fluctuations.
Free with trial A row of colorful wooden blocks, resembling a bar graph, sits on a dark wooden surface. The blocks are various heights and colors, creating a visually appealing and potentially symbolic representation of growth or data. Decrease business graph illustrations Colorful Wooden Blocks Chart. A row of colorful wooden blocks, resembling a bar graph, sits on a dark wooden surface. The blocks are various heights and colors, creating a visually appealing and potentially symbolic representation of growth or data.
Free with trial This image showcases a colorful bar graph with a downward-pointing arrow, generated by AI, illustrating a negative trend or decline. The vibrant colors and simplistic design make the message clear and easily understood. The image is perfect for representing economic downturns, market dips, or any s. Decrease business graph illustrations Downward Trend Visualization. This image showcases a colorful bar graph with a downward-pointing arrow, generated by AI, illustrating a negative trend or decline. The vibrant colors and simplistic design make the message clear and easily understood. The image is perfect for representing economic downturns, market dips, or any s
Free with trial A 3D rendering showing stacks of coins under a magnifying glass focusing on a bar graph, generated by AI. This image symbolizes financial analysis, investment, and wealth management. It's perfect for illustrating articles or presentations related to economic trends and monetary growth. Decrease business graph illustrations Financial Analysis Magnifier. A 3D rendering showing stacks of coins under a magnifying glass focusing on a bar graph, generated by AI. This image symbolizes financial analysis, investment, and wealth management. It's perfect for illustrating articles or presentations related to economic trends and monetary growth.
Free with trial This image depicts a dramatic stock market decline, visualized as a falling graph in intense orange and red hues, generated by AI. The dark background emphasizes the severity of the downturn, suggesting potential financial instability or market volatility. The bokeh effect adds a sense of depth and. Decrease business graph illustrations AI-Generated Stock Market Dip. This image depicts a dramatic stock market decline, visualized as a falling graph in intense orange and red hues, generated by AI. The dark background emphasizes the severity of the downturn, suggesting potential financial instability or market volatility. The bokeh effect adds a sense of depth and
Free with trial Flipping of wooden blocks with arrow up and down. Business planning for target achievement. Measure of performance for a specific objective. 3d render. Decrease business graph illustrations Flipping of wooden blocks with arrow up and down
Free with trial Flipping of wooden blocks with arrow up and down. Business planning for target achievement. Measure of performance for a specific objective. 3d render. Decrease business graph illustrations Flipping of wooden blocks with arrow up and down
Free with trial A digital screen shows a sharp decline in stock market indices, indicated by a red arrow and graph. Numbers flash, reflecting significant losses. Decrease business graph illustrations Stock Market Crash. A digital screen shows a sharp decline in stock market indices, indicated by a red arrow and graph. Numbers flash, reflecting significant losses
Free with trial Up vs down balance on economic scale. Balance on scale. Business Concept. Vector stock illustration. Decrease business graph vectors Up vs down balance on economic scale
Free with trial A robotic arm interacts with a declining green graph, generated by AI. This futuristic image symbolizes automation's impact on production, potentially highlighting efficiency drops or market downturns within a technologically advanced manufacturing setting. The scene suggests technological challeng. Decrease business graph illustrations AI-Generated Production Decline. A robotic arm interacts with a declining green graph, generated by AI. This futuristic image symbolizes automation's impact on production, potentially highlighting efficiency drops or market downturns within a technologically advanced manufacturing setting. The scene suggests technological challeng
Free with trial This image, generated by AI, depicts a hand placing a small, metallic object onto a graph showing a sharp market decline. It visually represents the fragility and potential for sudden drops in financial markets. The image is a high-quality 3D rendering. Decrease business graph illustrations AI-Generated Market Crash Image. This image, generated by AI, depicts a hand placing a small, metallic object onto a graph showing a sharp market decline. It visually represents the fragility and potential for sudden drops in financial markets. The image is a high-quality 3D rendering.
Free with trial This image depicts a long line of miniature people following a downward trending stock market graph, generated by AI. It visually represents economic downturn and its impact on a large population. The contrast between the dense crowd and the falling graph is striking. Decrease business graph illustrations People and Stock Market Decline. This image depicts a long line of miniature people following a downward trending stock market graph, generated by AI. It visually represents economic downturn and its impact on a large population. The contrast between the dense crowd and the falling graph is striking.
Free with trial A conceptual illustration depicting the effects of inflation on long-term investments. The image features golden coins, stacked and scattered, alongside a rising arrow graph, and bar charts, all symbolizing financial growth and the challenges posed by inflation. The overall design conveys the concept of the impact of inflation on investment strategies and financial planning. Suitable for articles, presentations, and educational materials related to economics and finance. Decrease business graph illustrations Inflation\'s Impact on Long-Term Investments. A conceptual illustration depicting the effects of inflation on long-term investments. The image features golden coins, stacked and scattered, alongside a rising arrow graph, and bar charts, all symbolizing financial growth and the challenges posed by inflation. The overall design conveys the concept of the impact of inflation on investment strategies and financial planning. Suitable for articles, presentations, and educational materials related to economics and finance.
Free with trial Simple lineart icon of an eye looking at a bar chart, representing market analysis. Decrease business graph vectors Human eye monitoring business bar chart icon. Simple lineart icon of an eye looking at a bar chart, representing market analysis
Free with trial A minimalist, flat design illustration of a bar chart featuring three vertical bars of varying heights. The bars are colored in orange, teal, and a lighter orange, set against a clean white background. This graphic represents data visualization, trends, and comparisons, suitable for business reports, educational materials, or web design elements. Decrease business graph illustrations Simple Bar Chart with Three Bars. A minimalist, flat design illustration of a bar chart featuring three vertical bars of varying heights. The bars are colored in orange, teal, and a lighter orange, set against a clean white background. This graphic represents data visualization, trends, and comparisons, suitable for business reports, educational materials, or web design elements.
Free with trial A symbolic illustration representing a journey's downturn or a business decline. Decrease business graph vectors Mountain Path Decline Arrow Icon. A symbolic illustration representing a journey's downturn or a business decline
Free with trial A clean, minimalist 3D render of a blue bar chart with a blue trend line connecting circular data points. The bars vary in height, illustrating growth and fluctuations. The background is a bright, clean white, emphasizing the chart's elements. This graphic is ideal for representing financial data, business growth, market trends, statistics, and performance analysis in a modern and professional style. Decrease business graph illustrations 3D Blue Bar Chart with Trend Line. A clean, minimalist 3D render of a blue bar chart with a blue trend line connecting circular data points. The bars vary in height, illustrating growth and fluctuations. The background is a bright, clean white, emphasizing the chart's elements. This graphic is ideal for representing financial data, business growth, market trends, statistics, and performance analysis in a modern and professional style.