Free with trial SP 500 stock with red arrow point down 3d rendering. Decrease business graph illustrations SP 500 stock with red arrow point down
Free with trial That US economy is changing the trend and goes up instead of down (or vice versa). Supports PNG files with transparent backgrounds. Decrease business graph vectors That US economy is changing the trend and goes up instead of down (or vice versa).
Free with trial Top view of laptop with symbol of economic crisis concept. Decrease business graph illustrations Concept of economic crisis. Top view of laptop with symbol of economic crisis concept
Free with trial Close-Up of Newspaper Article Featuring Bold \'Lower Demand\' Headline. Decrease business graph illustrations Close-Up of Newspaper Article Featuring Bold \'Lower Demand\' Headline
Free with trial A smooth, black arrow curves in an arc, its point directed downward. The arrow sits on a light gray or white background, creating a simple and minimalist presentation. The glossy finish of the arrow reflects light. Decrease business graph illustrations Black Curved Arrow Points Downward on a White Background. A smooth, black arrow curves in an arc, its point directed downward. The arrow sits on a light gray or white background, creating a simple and minimalist presentation. The glossy finish of the arrow reflects light.
Free with trial The image shows a close-up view of a yellow percentage symbol on a plain white background. The symbol is composed of two zeros with a slash in between, representing the mathematical percentage sign. Decrease business graph illustrations A close-up view of a yellow percentage symbol on a white background. The image shows a close-up view of a yellow percentage symbol on a plain white background. The symbol is composed of two zeros with a slash in between, representing the mathematical percentage sign
Free with trial A golden, reflective euro coin symbol is depicted with a sharp, downward-trending golden arrow piercing through it, symbolizing financial decline and economic loss. The metallic objects are rendered in 3D and presented against a clean white background. Decrease business graph illustrations Golden Euro Coin Symbol with Downward Trending Arrow Indicating Financial Decline currency. A golden, reflective euro coin symbol is depicted with a sharp, downward-trending golden arrow piercing through it, symbolizing financial decline and economic loss. The metallic objects are rendered in 3D and presented against a clean white background
Free with trial A bold red arrow with a wavy shape is depicted, indicating a downward trend or decline. The object is isolated against a clean white background, emphasizing its symbolic meaning. Decrease business graph illustrations A red wavy arrow pointing downwards isolated on white background. A bold red arrow with a wavy shape is depicted, indicating a downward trend or decline. The object is isolated against a clean white background, emphasizing its symbolic meaning
Free with trial Businessmen analyze oil market trends in a warehouse filled with barrels. They discuss statistics, focusing on the decline in oil prices and future implications. Decrease business graph illustrations Businessmen Analyze Oil Market Trends with Barrels in Background. Businessmen analyze oil market trends in a warehouse filled with barrels. They discuss statistics, focusing on the decline in oil prices and future implications
Free with trial Bar chart with a downward trending orange arrow indicating decline. Decrease business graph vectors Bar chart with a downward trending orange arrow indicating decline
Free with trial A symbolic representation of a stock market crash. A downward trending arrow made of green and red blocks against a blue background. Visualizes financial decline and economic downturn. A powerful image for finance concepts. Decrease business graph illustrations Stock market crash concept image showing a downward trend arrow made of blocks on a blue background. A symbolic representation of a stock market crash. A downward trending arrow made of green and red blocks against a blue background. Visualizes financial decline and economic downturn. A powerful image for finance concepts.
Free with trial Silhouette of a man in despair against a backdrop of exploding red stock market candlestick charts. A powerful visual representation of financial crisis, economic collapse, investment loss, and the stress of a market crash. Decrease business graph illustrations Financial Market Crash and Economic Crisis Concept Illustration. Silhouette of a man in despair against a backdrop of exploding red stock market candlestick charts. A powerful visual representation of financial crisis, economic collapse, investment loss, and the stress of a market crash
Free with trial 3d render icon Declining euro coins with descending red arrow symbolizing economic downturn, transparent financial graphic highlighting monetary instability. Decrease business graph vectors 3d render icon Stacks of declining euro coins and descending red arrow representing financial crisis, with transparent background. 3d render icon Declining euro coins with descending red arrow symbolizing economic downturn, transparent financial graphic highlighting monetary instability
Free with trial 3d render icon Declining euro coins with descending red arrow symbolizing economic downturn, transparent financial graphic highlighting monetary instability. Decrease business graph vectors 3d render icon Stacks of declining euro coins and descending red arrow representing financial crisis, with transparent background. 3d render icon Declining euro coins with descending red arrow symbolizing economic downturn, transparent financial graphic highlighting monetary instability
Free with trial Hand Drawn Bar Chart Demonstrating Negative Trend with Downward Arrow. Decrease business graph vectors Hand Drawn Bar Chart Demonstrating Negative Trend with Downward Arrow
Free with trial Robot Pushing Bitcoin Downward Arrow, Crypto Market Decline Concept, illustration. Decrease business graph illustrations Robot Pushing Bitcoin Downward Arrow, Crypto Market Decline Concept
Free with trial Japanese Yen Exchange Rate Chart Illustration Forecast. Decrease business graph illustrations Japanese Yen Exchange Rate Chart Illustration Forecast
Free with trial Green glossy arrow pointing upwards isolated on white background. Direction guide. Close-up. Decrease business graph illustrations Green glossy arrow pointing upwards isolated on white background. Direction guide
Free with trial Budget cut strategy cost reduction arrow over coin stacks on blocks. Generative AI. Decrease business graph illustrations Budget cut strategy cost reduction arrow over coin stacks on blocks
Free with trial Budget cut strategy cost reduction chart with robot and human touch. Generative AI. Decrease business graph illustrations Budget cut strategy cost reduction chart with robot and human touch
Free with trial Hand showing hand pressing yellow arrow down on bar chart with gray background. resolution use. Clear details and vibrant colors enhance visual appeal. hand, yellow arrow, downward arrow. Decrease business graph illustrations Hand pressing yellow arrow down on bar chart with gray background
Free with trial The image shows a golden dollar sign placed at the intersection of a downward red arrow and an upward green arrow, symbolizing economic decline and growth or contrasting financial performance. Decrease business graph illustrations Financial trends depicted by contrasting arrows and dollar symbol. The image shows a golden dollar sign placed at the intersection of a downward red arrow and an upward green arrow, symbolizing economic decline and growth or contrasting financial performance
Free with trial A sharp, red zigzag arrow points downwards, visually representing a significant decline or negative trend in financial markets, economic performance, or any data set showing a downward trajectory. Decrease business graph vectors Red downward trending arrow graphic, isolated on transparent background. A sharp, red zigzag arrow points downwards, visually representing a significant decline or negative trend in financial markets, economic performance, or any data set showing a downward trajectory
Free with trial This image represents a declining global economy with a dramatic drop in financial performance illustrated by a bright blue arrow pointing downwards. Decrease business graph illustrations Global economic downturn with financial chart on world map background. This image represents a declining global economy with a dramatic drop in financial performance illustrated by a bright blue arrow pointing downwards
Free with trial Person's hand points to stock market data displayed on laptop screen indicating analysis Use for finance or investment themes. Decrease business graph illustrations Analyzing Stock Market Data on Laptop Screen with Hand Pointing. Person's hand points to stock market data displayed on laptop screen indicating analysis Use for finance or investment themes
Free with trial Hand drawn bar chart illustrating a downward trend with a large arrow. Decrease business graph vectors Hand drawn bar chart illustrating a downward trend with a large arrow
Free with trial The image shows a close-up view of a yellow percentage symbol on a plain white background. The symbol is composed of two zeros with a slash in between, representing the mathematical percentage sign. Decrease business graph illustrations A close-up view of a yellow percentage symbol on a white background. The image shows a close-up view of a yellow percentage symbol on a plain white background. The symbol is composed of two zeros with a slash in between, representing the mathematical percentage sign
Free with trial A vibrant red and orange arrow symbolizes a downward trend against a dark chart. This image represents financial decline, market analysis, and economic challenges. Decrease business graph illustrations Red and Orange Arrow Indicating Downward Trend on Chart Background. A vibrant red and orange arrow symbolizes a downward trend against a dark chart. This image represents financial decline, market analysis, and economic challenges
Free with trial This image captures a downward trend line, symbolizing a financial market decline and representing challenges faced by investors. Decrease business graph illustrations Downward Trend Line Representing Financial Market Decline and Loss. This image captures a downward trend line, symbolizing a financial market decline and representing challenges faced by investors
Free with trial This image showcases data analysis icons, representing data processing, visualization, and interpretation, which are crucial for gaining valuable insights. Decrease business graph vectors Vector art of data analysis icons representing various aspects of data processing, visualization, and interpretation for insights. This image showcases data analysis icons, representing data processing, visualization, and interpretation, which are crucial for gaining valuable insights
Free with trial The image depicts a small yellow figure standing on a green circular platform. Above the figure, there are multiple red arrows pointing downwards, suggesting a downward trend or pressure. Decrease business graph illustrations Yellow figure standing under red downward arrows on green platform. The image depicts a small yellow figure standing on a green circular platform. Above the figure, there are multiple red arrows pointing downwards, suggesting a downward trend or pressure
Free with trial Several stacks of gold coins are arranged in a descending diagonal line against a bright white background. The coins are uniform in size and appear to be made of polished gold, reflecting light. The arrangement suggests a financial trend, such as a decrease in value or a decline in savings, with each stack progressively shorter than the one before it. Decrease business graph illustrations Stacked Gold Coins Arranged in a Descending Diagonal Line on White Background money currency. Several stacks of gold coins are arranged in a descending diagonal line against a bright white background. The coins are uniform in size and appear to be made of polished gold, reflecting light. The arrangement suggests a financial trend, such as a decrease in value or a decline in savings, with each stack progressively shorter than the one before it
Free with trial Icons on a white background depict percentage symbols combined with arrows and bar graphs. The top row includes red, blue, and yellow arrows with percentage symbols. The middle row shows a multicolored bar graph, green percentage symbols, and a black percentage symbol with a black arrow. The bottom row contains a black bar graph, a downward arrow, and a large black percentage symbol. These elements visually represent data trends, growth, and decline. Decrease business graph vectors Percentage Growth and Decline Arrow Icon Set Multi Color and Silhouette. Icons on a white background depict percentage symbols combined with arrows and bar graphs. The top row includes red, blue, and yellow arrows with percentage symbols. The middle row shows a multicolored bar graph, green percentage symbols, and a black percentage symbol with a black arrow. The bottom row contains a black bar graph, a downward arrow, and a large black percentage symbol. These elements visually represent data trends, growth, and decline.
Free with trial Unemployment line icon of unemployed man on labor market, vector symbol. Economic crisis, global financial downturn and bankruptcy icon of economy recession and unemployment problem. Decrease business graph vectors Unemployment line icon, economic financial crisis. Unemployment line icon of unemployed man on labor market, vector symbol. Economic crisis, global financial downturn and bankruptcy icon of economy recession and unemployment problem
Free with trial Plummeting Oil Prices, Barrel and Downward Trend Chart. Decrease business graph vectors Plummeting Oil Prices Barrel and Downward Trend Chart
Free with trial This striking image presents the concept of economic decline symbolized by a tank, wooden figures, and stacks of coins, representing the urgent need for strategic financial awareness and planning. Decrease business graph illustrations Economic Decline Represented by Tank and Wooden Figures with Coins. This striking image presents the concept of economic decline symbolized by a tank, wooden figures, and stacks of coins, representing the urgent need for strategic financial awareness and planning
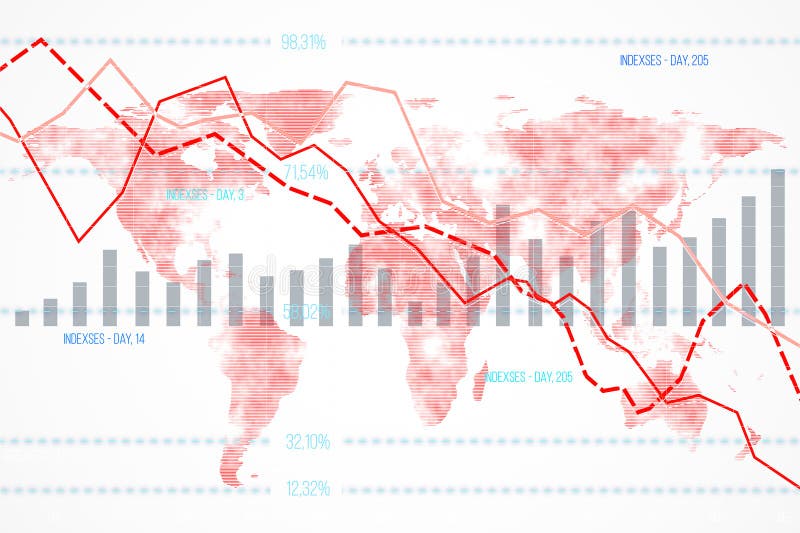
Free with trial Financial data chart featuring declining indexes and bar graphs overlaid on a world map background. Concept of global economic downturn. 3D Rendering. Decrease business graph illustrations Financial data chart with declining indexes on a world map background. 3D Rendering. Financial data chart featuring declining indexes and bar graphs overlaid on a world map background. Concept of global economic downturn. 3D Rendering
Free with trial Detailed statistics, a white background, and a downward arrow depicting a stock market crash. 3D rendering. Decrease business graph illustrations Detailed statistics, a white background, and a downward arrow depicting a stock market crash. 3D rendering.
Free with trial The image shows a bar chart with a downward trend line overlaid in red, indicating a decline. A green dollar symbol is positioned at the end of the chart, suggesting a connection to financial loss or decreasing revenue. Decrease business graph illustrations Graphic depicting a declining financial trend with a dollar symbol. The image shows a bar chart with a downward trend line overlaid in red, indicating a decline. A green dollar symbol is positioned at the end of the chart, suggesting a connection to financial loss or decreasing revenue
Free with trial Stock market data with candlestick chart and declining arrow on a blurred light background. Concept of financial decline. 3D Rendering. Decrease business graph illustrations Abstract image of financial stock market data with declining arrow on light background. 3D Rendering. Stock market data with candlestick chart and declining arrow on a blurred light background. Concept of financial decline. 3D Rendering
Free with trial A minimalist bar chart graphic showcasing fluctuating data points. This visual element is perfect for representing financial growth, performance metrics, or statistical analysis in various applications. Decrease business graph illustrations Simple bar chart icon representing data growth and analysis trends. A minimalist bar chart graphic showcasing fluctuating data points. This visual element is perfect for representing financial growth, performance metrics, or statistical analysis in various applications
Free with trial Laptop on desk shows red downward stock chart against light background, symbolizing global financial crisis, investment loss and market collapse. 3D Rendering. Decrease business graph illustrations Laptop displaying downward red stock chart on wooden desk with coffee and smartphone, symbolizing financial crisis and market. Laptop on desk shows red downward stock chart against light background, symbolizing global financial crisis, investment loss and market collapse. 3D Rendering
Free with trial This image shows a large, three-dimensional blue percentage symbol against a dark, textured background. The symbol is slightly tilted to the right and appears to be made of a shiny, metallic material. Decrease business graph illustrations A close-up view of a large blue percentage symbol on a dark background. This image shows a large, three-dimensional blue percentage symbol against a dark, textured background. The symbol is slightly tilted to the right and appears to be made of a shiny, metallic material
Free with trial This creative image features a tilted angle view of coins stacked to depict financial growth while a businessman rushes past, reflecting the dynamic nature of the economy. Decrease business graph illustrations Financial Growth Concept with Coins and Businessman on Tilted Angle. This creative image features a tilted angle view of coins stacked to depict financial growth while a businessman rushes past, reflecting the dynamic nature of the economy
Free with trial A conceptual portrayal of economic decline, featuring a man walking near stacked coins and a tank. The downward trend signifies market struggles and financial crisis. Decrease business graph illustrations Economic Decline Illustration with Man and Tank Representing Crisis. A conceptual portrayal of economic decline, featuring a man walking near stacked coins and a tank. The downward trend signifies market struggles and financial crisis
Free with trial A flat style vector illustration showcasing a laptop displaying a colorful bar chart and a downward trending arrow indicating financial decline or loss. Decrease business graph illustrations Laptop Screen Displaying Colorful Bar Chart and Downward Trending Arrow Symbolizing Financial Loss. A flat style vector illustration showcasing a laptop displaying a colorful bar chart and a downward trending arrow indicating financial decline or loss.
Free with trial The image showcases a large, three-dimensional yellow percentage sign against a plain background. The sign is composed of two circles connected by a horizontal line, creating a bold and eye-catching symbol. Decrease business graph illustrations A close-up view of a large, three-dimensional yellow percentage sign. The image showcases a large, three-dimensional yellow percentage sign against a plain background. The sign is composed of two circles connected by a horizontal line, creating a bold and eye-catching symbol
Free with trial Broken coin showing a red arrow pointing down, representing economic decline and financial loss. Decrease business graph illustrations Broken coin featuring red downturn arrow symbolizing financial crisis. Broken coin showing a red arrow pointing down, representing economic decline and financial loss
Free with trial The image features a close-up view of a large, three-dimensional blue percentage symbol against a stark white background. The symbol is slightly tilted to the right, giving it a dynamic appearance. The blue color is vibrant and glossy, reflecting light and adding a sense of depth to the image. Decrease business graph illustrations A close-up view of a large blue percentage symbol on a white background. The image features a close-up view of a large, three-dimensional blue percentage symbol against a stark white background. The symbol is slightly tilted to the right, giving it a dynamic appearance. The blue color is vibrant and glossy, reflecting light and adding a sense of depth to the image
Free with trial An image depicting a red arrow pointing downwards above a stack of gold coins that decreases in size, symbolizing financial decline or loss. Decrease business graph illustrations A descending red arrow above a diminishing stack of gold coins. An image depicting a red arrow pointing downwards above a stack of gold coins that decreases in size, symbolizing financial decline or loss
Free with trial A large green upward arrow stands tall, surrounded by multiple red downward arrows, symbolizing contrasting trends of growth and decline. Decrease business graph illustrations Green up arrow dominates red down arrows showing growth and decline. A large green upward arrow stands tall, surrounded by multiple red downward arrows, symbolizing contrasting trends of growth and decline
Free with trial Abstract red chart illustrating data trends and fluctuations in finance. This graphic represents market analysis, ideal for professional reports and presentations. Decrease business graph vectors Red Chart Illustration Showing Data Trends and Variations in Finance. Abstract red chart illustrating data trends and fluctuations in finance. This graphic represents market analysis, ideal for professional reports and presentations
Free with trial That US economy is changing the trend and goes up instead of down (or vice versa). Supports PNG files with transparent backgrounds. Decrease business graph vectors That US economy is changing the trend and goes up instead of down (or vice versa)
Free with trial That US economy is changing the trend and goes up instead of down (or vice versa). Supports PNG files with transparent backgrounds. Decrease business graph vectors That US economy is changing the trend and goes up instead of down (or vice versa)
Free with trial That US economy is changing the trend and goes up instead of down (or vice versa). Supports PNG files with transparent backgrounds. Decrease business graph vectors That US economy is changing the trend and goes up instead of down (or vice versa)
Free with trial Reduction chart icon Black line art vector in black and white outline set collection sign. Decrease business graph vectors Reduction chart icon Thin line art collection. Reduction chart icon Black line art vector in black and white outline set collection sign
Free with trial This image illustrates a financial downturn using a descending stock chart superimposed on a tall skyscraper, symbolizing economic decline. Decrease business graph illustrations Financial downturn depicted by descending stock chart on skyscraper. This image illustrates a financial downturn using a descending stock chart superimposed on a tall skyscraper, symbolizing economic decline
Free with trial A black jagged arrow points downwards, indicating a sharp decline on a white background. Decrease business graph illustrations Black jagged arrow pointing down on a white background sharp decline. A black jagged arrow points downwards, indicating a sharp decline on a white background
Free with trial A collection of eight black icons featuring robot heads and bar graphs within speech bubbles, symbolizing data analysis and AI communication. Decrease business graph vectors Set of eight black icons representing robots and data analysis white. A collection of eight black icons featuring robot heads and bar graphs within speech bubbles, symbolizing data analysis and AI communication
Free with trial The image depicts a 3D bar chart with bars in varying heights. The bars are colored in shades of green and blue, with the green bars being shorter and the blue bars being taller. The chart is set against a plain white background, which highlights the colors of the bars. Decrease business graph illustrations Colorful 3d bar chart with green and blue bars on a white background. The image depicts a 3D bar chart with bars in varying heights. The bars are colored in shades of green and blue, with the green bars being shorter and the blue bars being taller. The chart is set against a plain white background, which highlights the colors of the bars
Free with trial Three prominent red arrows point downwards, each displaying a white percentage symbol. This imagery powerfully represents declining prices, sales, and financial reduction, ideal for marketing and economic contexts. Decrease business graph illustrations Three red downward arrows with percentage symbols symbolizing falling prices and discounts isolated on white background. Three prominent red arrows point downwards, each displaying a white percentage symbol. This imagery powerfully represents declining prices, sales, and financial reduction, ideal for marketing and economic contexts
Free with trial A group of people standing around a large red arrow pointing downwards created AI. Decrease business graph illustrations A group of people standing around a large red arrow pointing downwards
Free with trial Ethereum symbol cracking ground with red market chart representing cryptocurrency crash. Decrease business graph illustrations Ethereum cryptocurrency crash showing market fall and financial crisis. Ethereum symbol cracking ground with red market chart representing cryptocurrency crash
Free with trial A businessman in a suit uses a magnifying glass to show cost reduction with graphs and financial data visuals. Decrease business graph illustrations Businessman demonstrating cost reduction with data and graphs for financial analysis purpose image. A businessman in a suit uses a magnifying glass to show cost reduction with graphs and financial data visuals.
Free with trial Bankruptcy icon vector logo set collection for web app ui. Decrease business graph vectors Bankruptcy icon Outline flat Icon. Bankruptcy icon vector logo set collection for web app ui
Free with trial This image shows a large, three-dimensional blue percentage symbol against a dark, textured background. The symbol is slightly tilted to the right and appears to be made of a shiny, metallic material. Decrease business graph illustrations A close-up view of a large blue percentage symbol on a dark background. This image shows a large, three-dimensional blue percentage symbol against a dark, textured background. The symbol is slightly tilted to the right and appears to be made of a shiny, metallic material
Free with trial House icon on wooden cube from stack block with percent and rise arrow, Real estate property investment concept. Asset management, Interest rates, inflation, loan mortgage, increase tax. 3d render. Decrease business graph illustrations House icon on wooden cube from stack block with percent and rise arrow
Free with trial Red arrow chart is rapidly declining, representing a financial crisis. Decrease business graph vectors Red arrow chart showing economic crisis and recession. Red arrow chart is rapidly declining, representing a financial crisis
Free with trial The image depicts a city map overlaid with stock market trend lines, illustrating various financial movements. Different colored lines represent upward and downward trends with percentage changes, indicating stock performance or indices across different regions. The visual juxtaposition of financial data against a geographical layout highlights how market movements correlate with specific. Decrease business graph illustrations Stock market trends and performance analysis on a city map background. The image depicts a city map overlaid with stock market trend lines, illustrating various financial movements. Different colored lines represent upward and downward trends with percentage changes, indicating stock performance or indices across different regions. The visual juxtaposition of financial data against a geographical layout highlights how market movements correlate with specific
Free with trial Laptop showing a bitcoin symbol and a financial chart with a red arrow going down. Decrease business graph illustrations Bitcoin value down chart displaying on laptop screen. Laptop showing a bitcoin symbol and a financial chart with a red arrow going down
Free with trial An abstract 3D bar chart showing growth and decline trend in silver and yellow colors. Decrease business graph illustrations Growth and decline concept using 3D bar chart in silver and yellow colors. An abstract 3D bar chart showing growth and decline trend in silver and yellow colors
Free with trial Red zigzag arrow illustration shows financial decline with clear downward trend. Symbol represents economic recession, market crash, investment loss. Ideal for presentations on finance. Decrease business graph illustrations Red zigzag arrow illustration shows financial decline with clear downward trend. Symbol represents economic recession, market
Free with trial The image depicts a dollar sign symbol flanked by a downward red arrow on the left and an upward green arrow on the right, representing contrasting financial trends such as economic decline and growth. Decrease business graph illustrations Financial trends illustrated by contrasting arrows and dollar symbol. The image depicts a dollar sign symbol flanked by a downward red arrow on the left and an upward green arrow on the right, representing contrasting financial trends such as economic decline and growth
Free with trial Grayscale Illustration of a Decreasing Bar Chart with a Downward Trend Arrow. Decrease business graph vectors Grayscale Illustration of a Decreasing Bar Chart with a Downward Trend Arrow
Free with trial Three bold red downward-pointing arrows, each featuring a prominent percentage symbol. This imagery effectively communicates concepts of decline, discounts, or cost reduction in a clear and impactful visual format. Decrease business graph illustrations Red downward arrows with percentage symbols representing financial decreases and savings opportunities isolated on white. Three bold red downward-pointing arrows, each featuring a prominent percentage symbol. This imagery effectively communicates concepts of decline, discounts, or cost reduction in a clear and impactful visual format
Free with trial A 3D rendered visualization of a stock market candlestick chart is presented on a white background. The chart displays a series of red and green candlesticks, representing price movements over time. Red candles indicate a price decrease, while green candles signify a price increase, illustrating market fluctuations and trends. Decrease business graph illustrations 3D Rendered Candlestick Stock Market Chart with Red and Green Bars on White Background trading. A 3D rendered visualization of a stock market candlestick chart is presented on a white background. The chart displays a series of red and green candlesticks, representing price movements over time. Red candles indicate a price decrease, while green candles signify a price increase, illustrating market fluctuations and trends
Free with trial Red stock market ticker display showing declining trend, ideal for financial news. Decrease business graph illustrations Abstract Red Stock Market Data Visualization with Upward Trend. Red stock market ticker display showing declining trend, ideal for financial news
Free with trial Color-coded bars with arrows indicate up/down movements and are separated by a line. Decrease business graph vectors Color-coded vertical bars separated by a grey line with up/down arrows. Color-coded bars with arrows indicate up/down movements and are separated by a line.
Free with trial A hand is seen drawing an upward trend arrow with yellow chalk on a dark chalkboard. Below the upward trend, there is a smaller downward arrow already drawn. Decrease business graph illustrations Hand drawing an upward trend arrow on a chalkboard with a downward arrow below. A hand is seen drawing an upward trend arrow with yellow chalk on a dark chalkboard. Below the upward trend, there is a smaller downward arrow already drawn