Free with trial A person's hand is reaching out towards a holographic display that shows various financial data charts and an infinity symbol, representing continuous growth and success in the financial market. Decrease business graph illustrations Hand interacting with a holographic display showing financial data and an infinity symbol. A person's hand is reaching out towards a holographic display that shows various financial data charts and an infinity symbol, representing continuous growth and success in the financial market
Free with trial A red arrow pointing downwards with a white percentage symbol on its surface. Isolated on a transparent background. Decrease business graph vectors Red Arrow with Percentage Symbol Pointing Down isolated on a transparent background. A red arrow pointing downwards with a white percentage symbol on its surface. Isolated on a transparent background
Free with trial Ascending green chart indicates positive financial growth in stock market investment ,Generative ai. Decrease business graph illustrations Ascending green stock chart symbolizes positive financial growth and investment success in market. Ascending green chart indicates positive financial growth in stock market investment ,Generative ai
Free with trial Illustration of a financial crisis concept. Decrease business graph illustrations Concept of financial crisis. Illustration of a financial crisis concept
Free with trial Financial market analysis document with diamond icon, representing a stock investment value increasing or decreasing. Decrease business graph illustrations Diamond value stock market investment report with percentage sign. Financial market analysis document with diamond icon, representing a stock investment value increasing or decreasing
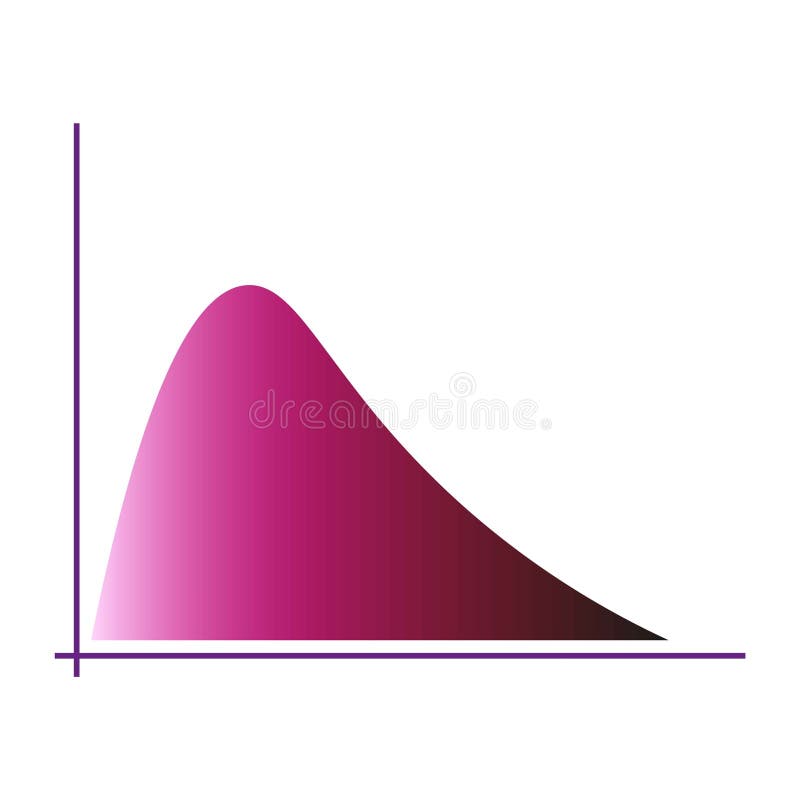
Free with trial Gradient curve chart. Pink color distribution. Graphical data visualization. Modern vector graphic. EPS 10. Decrease business graph vectors Gradient curve chart. Pink color distribution. Graphical data visualization. Modern vector graphic.
Free with trial Man points red arrow on bar chart for analysis professional highlights data trend with arrow on chart,Generative AI. Decrease business graph illustrations Man points red arrow on bar chart for analysis professional highlights data trend with arrow on chart
Free with trial Gold coins stack with red arrow zigzag down representing economic recession and market crash. Generative AI. Decrease business graph illustrations Gold coins stack with red arrow zigzag down representing economic recession and market crash
Free with trial 3D coin background with finance chart. Financial investment, currency, successful market growth, technology report concept. Bitcoin or cryptocurrency trading, online banking digital. Decrease business graph illustrations 3D coin background with finance chart. Financial investment, currency, successful market growth, technology report concept.
Free with trial A dynamic visual representation showcases interest rate volatility, featuring fluctuating lines, percentage symbols, and financial data analysis. The display creates a sense of market flux and economic shifts. Ideal for illustrating financial news, investment strategies, economic forecasts, and mark. Decrease business graph illustrations Interest Rate Volatility Display Showing Financial Data Trends and Fluctuations for Market Analysis. A dynamic visual representation showcases interest rate volatility, featuring fluctuating lines, percentage symbols, and financial data analysis. The display creates a sense of market flux and economic shifts. Ideal for illustrating financial news, investment strategies, economic forecasts, and mark
Free with trial A 3D golden house model on a digital tablet with colorful graphs and charts in the background,. Decrease business graph illustrations A 3D golden house model on a digital tablet with colorful graphs and charts in the background
Free with trial Flat graphic of a declining stock chart. Red arrow emphasizes a negative trend. Teal data points and a dollar sign icon complete the image. Decrease business graph vectors Illustrative Stock Chart Depicting Economic Decline with Dollar Sign in Flat Graphic Style. Flat graphic of a declining stock chart. Red arrow emphasizes a negative trend. Teal data points and a dollar sign icon complete the image.
Free with trial San Francisco skyline with a financial chart overlay showing red downward trends, glowing data, and buildings in the background, symbolizing market crisis. Decrease business graph illustrations Double exposure of San Francisco skyline and financial stock market chart with red downward trend, glowing data points, and. San Francisco skyline with a financial chart overlay showing red downward trends, glowing data, and buildings in the background, symbolizing market crisis
Free with trial Colorful flat design depicts bull and bear market fluctuation. Rising and falling arrows symbolize investment direction with a simple yet informative design. Decrease business graph vectors Bull and Bear Market Illustration with Price Fluctuation Indicators on Black Background. Colorful flat design depicts bull and bear market fluctuation. Rising and falling arrows symbolize investment direction with a simple yet informative design.
Free with trial This is an detailed set of clean line icons for infographic design, corporate data analysis, and finance. Decrease business graph vectors Clean infographic symbols for corporate data analysis and financial tracking applications. This is an detailed set of clean line icons for infographic design, corporate data analysis, and finance
Free with trial Burning red arrow falling over digital world map showing global economic crisis, financial recession, and market collapse visualization. Decrease business graph illustrations Burning red arrow falling over digital world map showing global economic crisis, financial recession
Free with trial Red glossy arrow pointing upwards isolated on white background. Direction guide. Close-up. Decrease business graph illustrations Red glossy arrow pointing upwards isolated on white background. Direction guide
Free with trial Red glossy arrow pointing upwards isolated on white background. Direction guide. Close-up. Decrease business graph illustrations Red glossy arrow pointing upwards isolated on white background. Direction guide
Free with trial Red glossy arrow pointing upwards isolated on white background. Direction guide. Close-up. Decrease business graph illustrations Red glossy arrow pointing upwards isolated on white background. Direction guide
Free with trial A conceptual illustration of a businessman facing financial difficulties with a warning sign indicating budget cuts. The image depicts a cliff with a yellow warning sign and green graphics representing budget cuts, such as scissors cutting through coins and a downward arrow. The scene symbolizes the challenges of managing finances during economic uncertainty and the importance of making strategic decisions to mitigate risks. Decrease business graph vectors A businessman navigating through financial challenges with a warning sign of budget cuts ahead. A conceptual illustration of a businessman facing financial difficulties with a warning sign indicating budget cuts. The image depicts a cliff with a yellow warning sign and green graphics representing budget cuts, such as scissors cutting through coins and a downward arrow. The scene symbolizes the challenges of managing finances during economic uncertainty and the importance of making strategic decisions to mitigate risks.
Free with trial Concept of volatile market with one stack of coins growing and another one decreasing. Decrease business graph illustrations Money stack growing while one is decreasing showing market volatility. Concept of volatile market with one stack of coins growing and another one decreasing
Free with trial Stacked cubes with red arrow down symbols showing step by step decreasing trend and negative growth. Generative AI. Decrease business graph illustrations Stacked cubes with red arrow down symbols showing step by step decreasing trend and negative growth
Free with trial Stock market chart with falling trends and financial metrics displayed on a digital screen, depicting a financial crisis and recession. 3D Rendering. Decrease business graph illustrations Stock market chart showing declining trends and financial crisis on a digital screen. 3D Rendering. Stock market chart with falling trends and financial metrics displayed on a digital screen, depicting a financial crisis and recession. 3D Rendering
Free with trial Simple up and down arrow icon on black circle. Decrease business graph vectors Simple up and down arrow on black circle
Free with trial Theory of Production for Total Product, Average Product, Marginal Product vector. Decrease business graph vectors Theory of Production for Total Product, Average Product, Marginal Product
Free with trial Cryptocurrency Day Trading vector Candlestick Chart Patterns concept outline icon or sign. Decrease business graph illustrations Cryptocurrency Day Trading vector Candlestick Chart Patterns outline icon or sign
Free with trial Shadows showing 3d orange arrow curving downward on a white background keywords: arrow, down, downward, curve, curving, orange, direction, symbol, sign, graphic, design, isolated, white background, 3d, render, concept, movement, decline, fall, decrease, negative, progress, business, finance, economy, stock market, trend, data, information, chart, graph, statistics, strategy, planning, decision,. Decrease business graph illustrations 3D Orange Arrow Curving Downward on a White Background Keywords: arrow, down, downward, curve, curving, orange, direction, symbol
Free with trial The image presents a comprehensive display of weekly trends through multiple graphs and charts. It features line graphs, bar charts, and other visual representations of data, each highlighting different aspects of trends and statistics. The use of various colors, including green, red, and blue, against a dark background with white text enhances the visual appeal and facilitates easy comprehension. This image was generated using artificial intelligence. Decrease business graph illustrations A collection of graphs and charts showcasing various weekly trends and statistics in a visually engaging format with multiple. The image presents a comprehensive display of weekly trends through multiple graphs and charts. It features line graphs, bar charts, and other visual representations of data, each highlighting different aspects of trends and statistics. The use of various colors, including green, red, and blue, against a dark background with white text enhances the visual appeal and facilitates easy comprehension. This image was generated using artificial intelligence.
Free with trial Paper cut Global economic crisis icon isolated on grey and black background. World finance crisis. Paper art style. Vector. Decrease business graph illustrations Paper cut Global economic crisis icon isolated on grey and black background. World finance crisis. Paper art style
Free with trial Financial chart shows falling market data with red and green candlesticks against a dark background, creating a dramatic effect suitable for investment and economic themed visuals. Decrease business graph illustrations Dramatic Financial Chart with Green and Red Candlesticks on Black Background. Financial chart shows falling market data with red and green candlesticks against a dark background, creating a dramatic effect suitable for investment and economic themed visuals
Free with trial The image shows a three-dimensional bar chart with alternating red and green bars, each varying in height. The bars are arranged on a green circular base, suggesting a comparison of data points, possibly financial metrics like stock prices, market performance, or growth analysis. The red bars indicate a decline or negative value, while the green bars suggest an increase or positive value. Decrease business graph illustrations Colorful 3d bar chart illustration depicting financial market trends or growth metrics. The image shows a three-dimensional bar chart with alternating red and. The image shows a three-dimensional bar chart with alternating red and green bars, each varying in height. The bars are arranged on a green circular base, suggesting a comparison of data points, possibly financial metrics like stock prices, market performance, or growth analysis. The red bars indicate a decline or negative value, while the green bars suggest an increase or positive value
Free with trial Colorful bar chart on a blue background showing data analysis and statistical growth. Generative AI. Decrease business graph illustrations Colorful bar chart on a blue background showing data analysis and statistical growth
Free with trial Current market price and expected market price to calculate desired profit and target cost vector. Decrease business graph vectors Current market price and expected market price to calculate desired profit and target cost
Free with trial Percent growth and decline arrow icon on black circle. Percentage up and down arrows vector concept. Decrease business graph vectors Percent growth and decline arrow icon on black circle. Percentage up and down arrows concept
Free with trial Decreasing stack of silver coins with red arrow down showing financial loss and investment risk. Generative AI. Decrease business graph illustrations Decreasing stack of silver coins with red arrow down showing financial loss and investment risk
Free with trial A clean, vector-style icon featuring a bar chart that displays a clear downward trend, symbolizing economic decline, financial loss, or diminishing performance metrics in a professional or digital context. Decrease business graph vectors A minimalist black and white icon showing a downward trend bar chart representing financial loss. A clean, vector-style icon featuring a bar chart that displays a clear downward trend, symbolizing economic decline, financial loss, or diminishing performance metrics in a professional or digital context
Free with trial A dramatic red financial chart shows a significant market decline. Illustrating economic downturn and financial risk. Decrease business graph illustrations Red Alert Stock Market Crash: Dramatic Decline in Financial Chart Displaying Economic Downturn. A dramatic red financial chart shows a significant market decline. Illustrating economic downturn and financial risk
Free with trial Arrow trend-down icon set in black and white filled and outlined stroke style. Decrease business graph vectors Arrow trend-down icon
Free with trial This image visually communicates economic distress with icons for crisis alert, a shield protecting a dollar symbol, and downward trending bar charts illustrating a recession. It's a strong representation of financial instability and protection measures. Decrease business graph illustrations Financial crisis alert symbol shield and downward trend graphs representing economic downturn. This image visually communicates economic distress with icons for crisis alert, a shield protecting a dollar symbol, and downward trending bar charts illustrating a recession. It's a strong representation of financial instability and protection measures
Free with trial Close Up of L. E. D. Stock Ticker Showing Market Data Prices and Numbers at Night With Blurred Crowd, Generated by AI. Decrease business graph illustrations Close Up of L.E.D. Stock Ticker Showing Market Data Prices and Numbers at Night With Blurred Crowd
Free with trial Stack of coins with upward arrow, symbolizing growth, savings, investment, and financial success ,Generative ai. Decrease business graph illustrations Ascending arrow on coin stack, visualizing financial growth, investment, savings, and wealth building. Stack of coins with upward arrow, symbolizing growth, savings, investment, and financial success ,Generative ai
Free with trial A photograph showing stacks of coins on a wooden table, decreasing in height from left to right, with a red arrow trending downwards, symbolizing a decline or loss. In the background, a businessman is seen reviewing documents. Decrease business graph illustrations Stacks of coins decreasing with a red arrow pointing down, indicating financial loss or decline. A photograph showing stacks of coins on a wooden table, decreasing in height from left to right, with a red arrow trending downwards, symbolizing a decline or loss. In the background, a businessman is seen reviewing documents
Free with trial Stock market crash concept with red arrow falling down on digital financial ticker display board. Generative AI. Decrease business graph illustrations Stock market crash concept with red arrow falling down on digital financial ticker display board
Free with trial Up down arrow icon isolated on white background. Upward downward arrows sign symbol vector. Decrease business graph vectors Up down arrow icon isolated on white background. Upward downward arrows sign symbol
Free with trial Green glossy arrow pointing upwards isolated on white background. Direction guide. Close-up. Decrease business graph illustrations Green glossy arrow pointing upwards isolated on white background. Direction guide
Free with trial Green glossy arrow pointing upwards isolated on white background. Direction guide. Close-up. Decrease business graph illustrations Green glossy arrow pointing upwards isolated on white background. Direction guide
Free with trial Green glossy arrow pointing upwards isolated on white background. Direction guide. Close-up. Decrease business graph illustrations Green glossy arrow pointing upwards isolated on white background. Direction guide
Free with trial Green glossy arrow pointing upwards isolated on white background. Direction guide. Close-up. Decrease business graph illustrations Green glossy arrow pointing upwards isolated on white background. Direction guide
Free with trial Up and down arrow icon in trendy style. Upward and downward sign symbol vector. Decrease business graph vectors Up and down arrow icon in trendy style. Upward and downward sign symbol
Free with trial Real estate market crash concept with red arrow falling down on wooden house model causing crisis. Generative AI. Decrease business graph illustrations Real estate market crash concept with red arrow falling down on wooden house model causing crisis
Free with trial Percentage wooden blocks on coins with red arrow down for interest rate cut and inflation concept. Generative AI. Decrease business graph illustrations Percentage wooden blocks on coins with red arrow down for interest rate cut and inflation concept
Free with trial Economic Loss icon outline collection or set in black and white. Decrease business graph vectors Economic Loss icon outline collection in black. Economic Loss icon outline collection or set in black and white
Free with trial Bar chart illustration showing a downward trend with a red arrow indicating a significant drop in values. Decrease business graph vectors Bar chart illustration showing a downward trend with a red arrow indicating a significant drop in values
Free with trial Bar chart illustrates financial decline. Dollar coin and downward arrow indicate loss and economic downturn. Represents decreasing revenue, poor performance and market slump. Decrease business graph illustrations Declining bar chart with dollar coin and downward arrow showing financial loss and economic downturn. Bar chart illustrates financial decline. Dollar coin and downward arrow indicate loss and economic downturn. Represents decreasing revenue, poor performance and market slump
Free with trial Colored miniature houses stand on real estate market analysis chart. Hand holds home loan. Housing market concept, mortgage rates rising falling. Property value increase decrease. Decrease business graph illustrations Colored miniature houses stand on real estate market analysis chart. Hand holds home loan. Housing market concept, mortgage rates
Free with trial Close-up view of city street with bar chart overlay, visualizing urban data analysis ,Generative AI. Decrease business graph illustrations Urban data analysis, closeup view of city street with bar chart visualization closeup. Close-up view of city street with bar chart overlay, visualizing urban data analysis ,Generative AI
Free with trial Arrow 3d vector illustration. Web design elements, pointer or cursor sign, increase of decrease financial sign. Up and down forward arrow, motion and navigation symbol. Decrease business graph vectors Arrow navigation pointer, forward upward. Arrow 3d vector illustration. Web design elements, pointer or cursor sign, increase of decrease financial sign. Up and down forward arrow, motion and navigation symbol
Free with trial A striking 3D rendering of a red downward-pointing arrow dramatically positioned over detailed financial charts Illustrates concepts of market downturn economic crisis recession and financial loss Perfect for illustrating articles or presentations relating to financial markets. Decrease business graph illustrations Red Down Arrow Over Financial Charts Showing Market Decline Recession Crisis Concept AI generated. A striking 3D rendering of a red downward-pointing arrow dramatically positioned over detailed financial charts Illustrates concepts of market downturn economic crisis recession and financial loss Perfect for illustrating articles or presentations relating to financial markets
Free with trial Minimalist 3D of pastel geometric shapes symbolizing financial growth, investment, profit, success, and progress. Great for illustrating your unique designs or attracting customer attention. Clear area for showcasing your products, copy space, banner, marketing. This AI image graphic representation. Generative AI. Decrease business graph illustrations Pastel Geometric Financial Growth Minimalist Marketing Minimalist 3D of pastel geometric shapes symbolizing financial growth. Minimalist 3D of pastel geometric shapes symbolizing financial growth, investment, profit, success, and progress. Great for illustrating your unique designs or attracting customer attention. Clear area for showcasing your products, copy space, banner, marketing. This AI image graphic representation. Generative AI
Free with trial This is an detailed set of line icons showing asset management techniques, cryptocurrency market trends, and professional trading chart indicators. Decrease business graph vectors Asset management and cryptocurrency trading icons featuring candlestick charts and trend indicators. This is an detailed set of line icons showing asset management techniques, cryptocurrency market trends, and professional trading chart indicators
Free with trial This striking visual depicts a steep downturn in data, signifying negative trends and potential instability within the economic landscape. Decrease business graph illustrations Dramatic red arrow pointing downward on financial chart representing market decline and economic loss. This striking visual depicts a steep downturn in data, signifying negative trends and potential instability within the economic landscape
Free with trial Economic Loss icon vector logo set collection for web app ui. Decrease business graph vectors Economic Loss icon vector set collection for web. Economic Loss icon vector logo set collection for web app ui
Free with trial Four distinct graphs and charts illustrating various data trends and patterns, each with unique colors and styles. Decrease business graph illustrations Collection of colorful graphs and charts displaying data trends isolated on transparent background. Four distinct graphs and charts illustrating various data trends and patterns, each with unique colors and styles
Free with trial Bear market financial concept with red candlestick chart and downward trend arrows on digital screen. Generative AI. Decrease business graph illustrations Bear market financial concept with red candlestick chart and downward trend arrows on digital screen
Free with trial Cryptocurrency Day Trading vector Candlestick Chart Patterns concept outline seamless pattern. Decrease business graph illustrations Cryptocurrency Day Trading vector Candlestick Chart Patterns outline seamless pattern
Free with trial Loss Bar Chart Icon vector set collection for web vector set collection for app ui. Decrease business graph vectors Loss Bar Chart Icon vector set collection for web
Free with trial A neon bar chart with downward arrow showing decline in data, glowing pink and blue on black background. Generative AI. Decrease business graph illustrations Neon bar chart with downward arrow showing decline in data glowing pink and blue on black background. A neon bar chart with downward arrow showing decline in data, glowing pink and blue on black background. Generative AI
Free with trial Percent up and down icon isolated on white background. Percentage arrow growth and decline sign symbol vector. Decrease business graph vectors Percent up and down icon isolated on white background. Percentage arrow growth and decline sign symbol
Free with trial A studio shot against a white background featuring a row of eight wooden peg dolls arranged in descending order of size from left to right. Above the figures, a large, solid red arrow points directly downwards, creating a conceptual representation of decline, reduction, downsizing, or diminishing returns. Decrease business graph illustrations A row of wooden peg dolls decreasing in size arranged under a large bold red downward arrow icon. A studio shot against a white background featuring a row of eight wooden peg dolls arranged in descending order of size from left to right. Above the figures, a large, solid red arrow points directly downwards, creating a conceptual representation of decline, reduction, downsizing, or diminishing returns
Free with trial A collection of colorful isometric bar charts and line graphs are displayed on a white background, representing data visualization and analysis. Decrease business graph illustrations Isometric colorful bar charts and line graphs displayed on a white background for data visualization. a collection of colorful isometric bar charts and line graphs are displayed on a white background, representing data visualization and analysis
Free with trial Uptrend and downtrend arrow icon with long shadow. Up and down arrows illustration concept. Decrease business graph vectors Uptrend and downtrend arrow icon with long shadow. Up and down arrows concept
Free with trial Red arrow crashing into gold coins stack representing financial crisis, inflation and stock market loss. Generative AI. Decrease business graph illustrations Red arrow crashing into gold coins stack representing financial crisis inflation and stock market loss
Free with trial Stacks of coins with green up arrow and red down arrow representing stock market fluctuation and investment risk. Generative AI. Decrease business graph illustrations Stacks of coins with green up arrow and red down arrow representing stock market fluctuation and investment risk
Free with trial Black and white icon of a dollar sign surrounded by arrows pointing up and down, representing market volatility. Decrease business graph illustrations Dollar currency fluctuating up and down with arrows icon. Black and white icon of a dollar sign surrounded by arrows pointing up and down, representing market volatility
Free with trial Two contrasting icons depict upward trends. On the left, a black percentage symbol inside a circle overlaps with two ascending black arrows on a white background. On the right, the design is reversed: a white percentage symbol and arrows on a black background. Both icons illustrate concepts of growth or increase, commonly associated with financial or statistical data. Decrease business graph vectors Increase Icon. Solid glyph series icon. Two contrasting icons depict upward trends. On the left, a black percentage symbol inside a circle overlaps with two ascending black arrows on a white background. On the right, the design is reversed: a white percentage symbol and arrows on a black background. Both icons illustrate concepts of growth or increase, commonly associated with financial or statistical data.
Free with trial Upward rightward, downward leftward, upward leftward, and downward rightward icon vector on black square. Decrease business graph vectors Upward rightward, downward leftward, upward leftward, and downward rightward icon on black square
Free with trial This image visually represents a downward trend, featuring three prominent red arrows with percentage symbols indicating a significant drop. It evokes concepts of financial loss, market crashes, or substantial sale events. Decrease business graph illustrations Three red descending arrows with percentage symbols symbolizing financial decline and sale discounts. This image visually represents a downward trend, featuring three prominent red arrows with percentage symbols indicating a significant drop. It evokes concepts of financial loss, market crashes, or substantial sale events
Free with trial This image depicts a group of black oil barrels with a red downward trend arrow, indicating a decline in oil prices or production. The scene suggests a negative impact on the economy, finance, and industry, and may be used to represent a crisis or recession in the oil market. Decrease business graph illustrations A group of black oil barrels with a red downward trend arrow indicating a decline in oil prices or production. This image depicts a group of black oil barrels with a red downward trend arrow, indicating a decline in oil prices or production. The scene suggests a negative impact on the economy, finance, and industry, and may be used to represent a crisis or recession in the oil market
Free with trial That US economy is changing the trend and goes up instead of down (or vice versa). 3D rendering on yellow background. Decrease business graph illustrations That US economy is changing the trend and goes up instead of down (or vice versa)