Free with trial Up and Down sign with green and red arrows isolated on a blue background vector illustration. Concept of sales bar chart symbol icon with arrow moving down and sales bar chart with arrow moving up. Decrease business graph vectors Up and Down sign with green and red arrows vector illustration. Concept of sales bar chart symbol icon with arrows. Up and Down sign with green and red arrows isolated on a blue background vector illustration. Concept of sales bar chart symbol icon with arrow moving down and sales bar chart with arrow moving up.
Free with trial Bitcoin BTC Cryptocurrency on the display board with red arrow down, 3d rendering. Decrease business graph illustrations Bitcoin BTC Cryptocurrency on the display board with red arrow down
Free with trial A laconic, simple infographic showing the fall of the Ethereum on the stock exchange. Decrease business graph illustrations Abstract infographic of falling Ethereum exchange rate. A laconic, simple infographic showing the fall of the Ethereum on the stock exchange.
Free with trial Up and Down sign with green and red arrows vector illustration. Concept of sales bar chart symbol icon with arrow moving down and sales bar chart with arrow moving up. Decrease business graph vectors Up and Down sign with green and red arrows vector illustration. Concept of sales bar chart symbol icon with arrows. Up and Down sign with green and red arrows vector illustration. Concept of sales bar chart symbol icon with arrow moving down and sales bar chart with arrow moving up.
Free with trial Up and Down sign with green and red arrows vector illustration. Concept of sales bar chart symbol icon with arrow moving down and sales bar chart with arrow moving up. Decrease business graph vectors Up and Down sign with green and red arrows vector illustration. Concept of sales bar chart symbol icon with arrows. Up and Down sign with green and red arrows vector illustration. Concept of sales bar chart symbol icon with arrow moving down and sales bar chart with arrow moving up.
Free with trial Currency exchange rate is fluctuating showing dollar gaining value while euro is decreasing. Decrease business graph vectors Dollar growing while euro is decreasing showing currency exchange rate. Currency exchange rate is fluctuating showing dollar gaining value while euro is decreasing
Free with trial A graphic illustration depicting the fluctuating value of digital currency, shown with a price performance chart and coins. this visual represents market ups and downs and financial trends. Decrease business graph vectors Stylized illustration showing digital currency market volatility and virtual coin price trends on financial growth chart. a graphic illustration depicting the fluctuating value of digital currency, shown with a price performance chart and coins. this visual represents market ups and downs and financial trends
Free with trial Red stock market chart crashing with downward arrow indicators on digital background, financial loss and economic recession concept. Generative AI. Decrease business graph illustrations Red stock market chart crashing with downward arrow indicators on digital background financial loss and economic recession. Red stock market chart crashing with downward arrow indicators on digital background, financial loss and economic recession concept. Generative AI
Free with trial Financial market crash concept with red arrow down and gold coins pile, economic crisis and investment loss, currency value drop and inflation risk, recession and money bankruptcy symbol on black. Generative AI. Decrease business graph illustrations Financial market crash concept with red arrow down and gold coins pile economic crisis and investment loss currency value drop. Financial market crash concept with red arrow down and gold coins pile, economic crisis and investment loss, currency value drop and inflation risk, recession and money bankruptcy symbol on black. Generative AI
Free with trial Golden bitcoin coin rests on wooden surface. Blurred red downward crypto chart in background. Digital currency investment risk, market loss financial volatility and value decrease. Decrease business graph illustrations Golden bitcoin coin rests on wooden surface. Blurred red downward crypto chart in background. Digital currency investment risk
Free with trial Red arrow 3D down shows decreasing sales. Conceptual vector illustration. Decrease business graph vectors Red arrow down increasing sales vector. Red arrow 3D down shows decreasing sales. Conceptual vector illustration
Free with trial A detailed data visualization illustrating market trends over time. The infographic combines a line chart, which shows fluctuating values and percentages, with a bar chart representing data for specific time intervals. The line chart highlights key data points, such as peaks annotated with values like '1. 24%' and '500K'. The x-axis represents a timeline from January to March, while the y-axis. Decrease business graph illustrations A modern market trend analysis visualization combining a bar and line chart for financial data isolated on white background. A detailed data visualization illustrating market trends over time. The infographic combines a line chart, which shows fluctuating values and percentages, with a bar chart representing data for specific time intervals. The line chart highlights key data points, such as peaks annotated with values like '1.24%' and '500K'. The x-axis represents a timeline from January to March, while the y-axis
Free with trial Up, down, left, and right arrow icon in rounded corner. Upward, downward, leftward, and rightward sign symbol vector. Decrease business graph vectors Up, down, left, and right arrow icon in rounded corner. Upward, downward, leftward, and rightward sign symbol
Free with trial Red chart shows financial market decline, loss. Candlestick pattern visualizes negative trend, crisis, fall. Bear market concept, economic recession, investment risks, stock collapse. Decrease business graph illustrations Red chart shows financial market decline, loss. Candlestick pattern visualizes negative trend, crisis, fall. Bear market concept
Free with trial 3d rendering red arrow crashing ground with financial chart background. Concept of stock market crash, economic recession and investment loss in dark blue tone. Generative AI. Decrease business graph illustrations 3d rendering red arrow crashing ground with financial chart background Concept of stock market crash economic recession and. 3d rendering red arrow crashing ground with financial chart background. Concept of stock market crash, economic recession and investment loss in dark blue tone. Generative AI
Free with trial Red bar chart displays a stock market decline against a dark background, representing a financial crisis or economic downturn. This image highlights negative trends and losses in the market. Decrease business graph illustrations Red Bar Chart Displaying Stock Market Decline on Dark Background for Financial Crisis Concept. Red bar chart displays a stock market decline against a dark background, representing a financial crisis or economic downturn. This image highlights negative trends and losses in the market
Free with trial Colorful cubes arranged in upward curve symbolize global economy facing inflation and recession risks during market slowdown and financial crisis. Generative AI. Decrease business graph illustrations Colorful cubes arranged in upward curve symbolize global economy facing inflation and recession risks during market slowdown and
Free with trial Crisis financial concept, Economic recession, financial crisis and loosing money, Businessman shocked by broken piggy bank. Decrease business graph vectors Crisis financial concept, Economic recession, financial crisis and loosing money, Businessman shocked by broken piggy bank
Free with trial Economic critical crisis concept. The bar garph with dropdown arrow on red table background. Recession financial, cryptocurrency, gold, and the stock market. Losing money and cash. Bearish. Decrease business graph vectors Economic critical crisis concept. The bar garph with dropdown arrow on red table background. Recession financial, cryptocurrency
Free with trial A striking 3D representation of a world globe with a declining arrow and oil barrels, symbolizing economic downturn and market struggles. Decrease business graph illustrations Global downturn concept with declining arrow, oil barrels, and world map in 3D representation, illustrating market challenges. A striking 3D representation of a. A striking 3D representation of a world globe with a declining arrow and oil barrels, symbolizing economic downturn and market struggles
Free with trial Discount percentage arrow icon representing price reductions, financial market decline, interest rate drops, economic recession, and sales promotions, isolated on white & transparent background, this image is generated using AI. Decrease business graph vectors Discount percentage arrow icon representing price reductions, financial market decline, interest rate drops, economic recession
Free with trial A businessman in suit pushing a percent sign for your needs. Concept for online bank or your finance company. Special offer, sale, gift. Vector illustration. Decrease business graph vectors A businessman in suit pushing a percent sign for your needs. Concept for online bank or your finance company. Special
Free with trial Up down arrow icon on black circle. Upward downward sign symbol vector. Decrease business graph vectors Up down arrow icon on black circle. Upward downward sign symbol
Free with trial Three stacks of gold coins decrease in height from left to right, overlaid by a downward-trending red arrow, visually representing financial decline, economic recession, or a stock market crash. Decrease business graph illustrations Declining coin stacks symbolize financial crisis economic downturn recession stock market crash isolated on white background. Three stacks of gold coins decrease in height from left to right, overlaid by a downward-trending red arrow, visually representing financial decline, economic recession, or a stock market crash
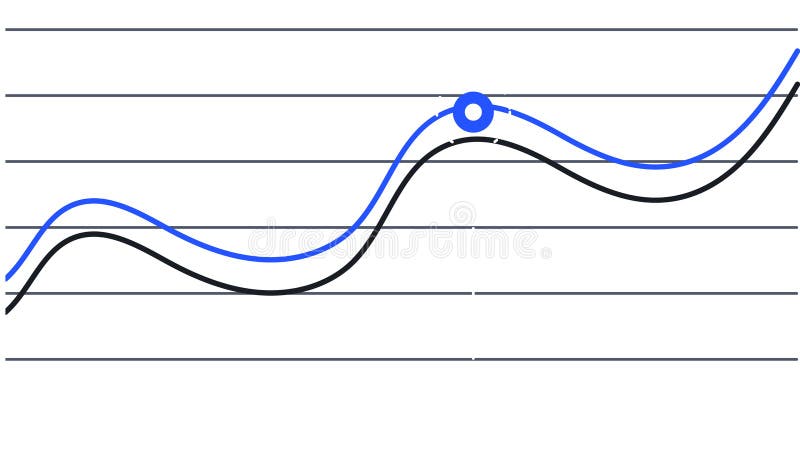
Free with trial Two lines are representing data progression over time, one blue and one black, creating a visual representation of trends and a key intersection point is marked with a blue circle. Decrease business graph illustrations Two lines are representing data progression over time, one blue and one black, creating a visual representation of
Free with trial Two lines are representing data progression over time, one blue and one black, creating a visual representation of trends and a key intersection point is marked with a blue circle. Decrease business graph vectors Two lines are representing data progression over time, one blue and one black, creating a visual representation of
Free with trial Up, down, left, and right arrow icon set on black square. Upward, downward, leftward, and rightward sign symbol vector. Decrease business graph vectors Up, down, left, and right arrow icon set on black square. Upward, downward, leftward, and rightward sign symbol
Free with trial Global decline icon. Downward financial chart. Dollar and globe image. Black vector. EPS 10. Decrease business graph vectors Global decline icon. Downward financial chart. Dollar and globe image. Black vector.
Free with trial Downward arrow icon. Percentage drop symbol. Financial decline vector. Economic crisis. EPS 10. Decrease business graph vectors Downward arrow icon. Percentage drop symbol. Financial decline vector. Economic crisis.
Free with trial Economy crisis icon logo sign vector outline in black and white color. Decrease business graph vectors Economy crisis icon symbol set collection. Economy crisis simple vector sign bundle. Economy crisis icon logo sign vector outline in black and white color
Free with trial This image depicts two contrasting scenarios of the housing market, one showing a positive upward trend and the other a negative downward trend. Decrease business graph illustrations Visual representation of real estate market trends showing both upward and downward fluctuations in housing prices and investment. This image depicts two contrasting scenarios of the housing market, one showing a positive upward trend and the other a negative downward trend
Free with trial Futuristic digital red arrow moving downward showing stock market crash, technology financial loss, and economic recession concept. Generative AI. Decrease business graph illustrations Futuristic digital red arrow moving downward showing stock market crash technology financial loss and economic recession concept
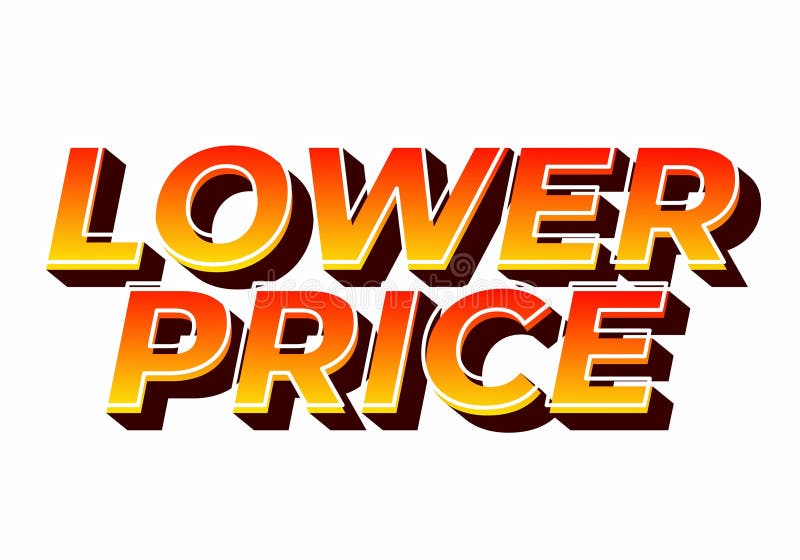
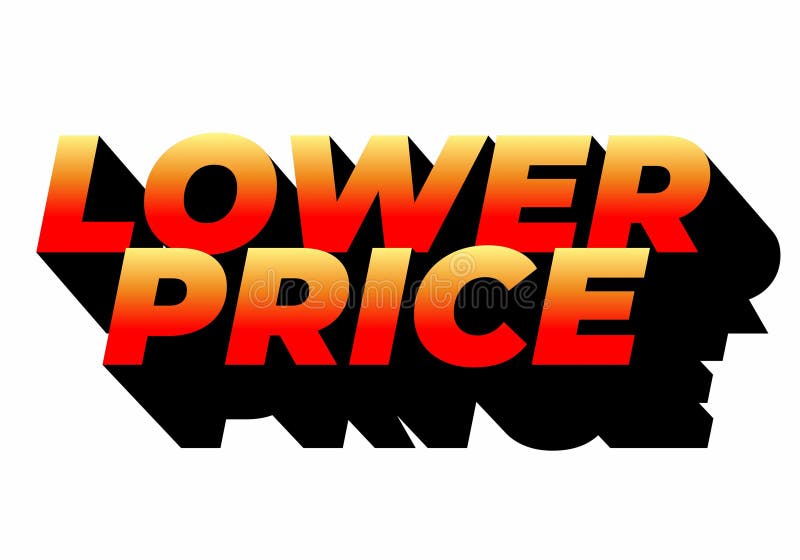
Free with trial Lower price. Text effect design with modern colors and 3D font look. Decrease business graph vectors Lower price. Text effect with modern colors and 3D font look
Free with trial Lower price. Text effect design with modern colors and 3D font look. Decrease business graph vectors Lower price. Text effect with modern colors and 3D font look
Free with trial Lower price. Text effect design with modern colors and 3D font look. Decrease business graph vectors Lower price. Text effect with modern colors and 3D font look
Free with trial Decreasing bar chart icon in generic style. Market crash sign symbol illustration. Decrease business graph vectors Decreasing bar chart icon in generic style. Market crash sign symbol
Free with trial Decline Visualization Dark Blue Background, Vibrant Pink Zigzags, and Yellow Bars Shown as Decreasing ThreeDimensional Cubes with Arrows Indicating the Trend by SD. Decrease business graph illustrations Decline Visualization Dark Blue Background, Vibrant Pink Zigzags, and Yellow Bars Shown as Decreasing ThreeDimensional Cubes with
Free with trial Seamless pattern featuring colorful financial arrows pointing up and down representing market trends isolated on a bright white. Generative AI Illustration. Decrease business graph illustrations Seamless pattern featuring colorful financial arrows pointing up and down representing market trends isolated on a bright white
Free with trial Seamless pattern featuring colorful financial arrows pointing up and down representing market trends isolated on a bright white. Generative AI Illustration. Decrease business graph illustrations Seamless pattern featuring colorful financial arrows pointing up and down representing market trends isolated on a bright white
Free with trial Seamless pattern featuring colorful financial arrows pointing up and down representing market trends isolated on a bright white. Generative AI Illustrations. Decrease business graph illustrations Seamless pattern featuring colorful financial arrows pointing up and down representing market trends isolated on a bright white
Free with trial Seamless pattern featuring colorful financial arrows pointing up and down representing market trends isolated on a bright white. Generative AI Illustration. Decrease business graph illustrations Seamless pattern featuring colorful financial arrows pointing up and down representing market trends isolated on a bright white
Free with trial Up and down arrow icon on circle line. Upward and downward sign symbol vector. Decrease business graph vectors Up and down arrow icon on circle line. Upward and downward sign symbol
Free with trial Decline Curve A Visual Representation of Increasing Trends Curving Downward and Overcoming Previous Bars Against a Dark Blue Background by SD. Decrease business graph illustrations Decline Curve A Visual Representation of Increasing Trends Curving Downward and Overcoming Previous Bars Against a Dark Blue Backg
Free with trial Up and down arrow icon on black circle. Upward and downward sign symbol vector. Decrease business graph vectors Up and down arrow icon on black circle. Upward and downward sign symbol
Free with trial This illustration features two colorful bar graphs on a white background, showcasing data comparison with distinct color palettes for engaging visual analysis and presentations. Decrease business graph illustrations Colorful Bar Graphs on White Background Representing Data Comparison and Growth with Different Color Schemes for Visual Analysis. This illustration features two colorful bar graphs on a white background, showcasing data comparison with distinct color palettes for engaging visual analysis and presentations
Free with trial Striking AI-generated visualization of a sharp financial crisis. This 3D render, featuring a bar chart and a glowing downward arrow, clearly communicates economic distress and market volatility, providing essential data imagery for investors and businesses tracking performance decline. Decrease business graph illustrations Conceptual 3D bar chart illustrating drastic market collapse and financial loss with a glowing downward arrow on a neutral backgro. Striking AI-generated visualization of a sharp financial crisis. This 3D render, featuring a bar chart and a glowing downward arrow, clearly communicates economic distress and market volatility, providing essential data imagery for investors and businesses tracking performance decline.
Free with trial Red Downward Arrow Showing Global Stock Market Crash and Economic Recession with Falling Percentages Representing Tariff Effects and Financial Crisis 3d rendering. Decrease business graph illustrations Red Downward Arrow Showing Global Stock Market Crash and Economic Recession with Falling Percentages Representing Tariff Effects
Free with trial This illustration portrays money circulation with arrows around a dollar coin, symbolizing financial flow and economic activity in a dynamic system. Decrease business graph vectors Vector art of illustration depicting money circulation with arrows around a dollar coin, representing financial flow and economic. This illustration portrays money circulation with arrows around a dollar coin, symbolizing financial flow and economic activity in a dynamic system
Free with trial Modern abstract zigzag-shaped chart depicting fluctuations in data analysis representing concept. Decrease business graph illustrations Modern abstract zigzag-shaped line chart representing fluctuations in data analysis concept. Modern abstract zigzag-shaped chart depicting fluctuations in data analysis representing concept
Free with trial Lower price. Text effect design with modern colors and 3D font look. Decrease business graph illustrations Lower price. Text effect with modern colors and 3D font look
Free with trial Curved red down arrow and green up arrow icons for visualizing growth, decline, trends, performance metrics, charts, and financial data. Decrease business graph vectors Curved red down and green up arrows for growth and decline indicators. Curved red down arrow and green up arrow icons for visualizing growth, decline, trends, performance metrics, charts, and financial data
Free with trial Percent growth and decline arrow icon vector isolated on white background. Percentage up and down sign symbol. Decrease business graph vectors Percent growth and decline arrow icon isolated on white background. Percentage up and down sign symbol
Free with trial Curved down arrow icon. Bankrupt, market crisis vector concept. Decrease business graph vectors Curved down arrow icon. Bankrupt, market crisis concept
Free with trial Economic critical crisis concept. The down arrow on red world map background. Recession financial, cryptocurrency, gold, and the stock market. Losing money and cash. Bearish. Decrease business graph vectors Economic critical crisis concept. The down arrow on red world map background. Recession financial, cryptocurrency, gold, and the
Free with trial Elevate your financial presentations and data visualizations with these captivating vintage-style arrow graphics. Perfect for illustrating price fluctuations, interest rate movements, and market trends, these retro-inspired up and down arrow designs are a visually engaging way to convey complex information. The sepia tone and textured background add a touch of vintage charm, bringing a classic. Decrease business graph illustrations Vintage-Inspired Arrow Graphics for Illustrating Price & Interest Rate Trends: A Retro Style Design Element. Elevate your financial presentations and data visualizations with these captivating vintage-style arrow graphics. Perfect for illustrating price fluctuations, interest rate movements, and market trends, these retro-inspired up and down arrow designs are a visually engaging way to convey complex information. The sepia tone and textured background add a touch of vintage charm, bringing a classic
Free with trial Market Downturn Red candlestick chart on a grid background with metallic cylinder accents. Depth of field effect. Stock photo. Decrease business graph illustrations Market Downturn Red candlestick chart on a grid background with metallic cylinder accents. Depth of field effect
Free with trial A clean, minimalist bar chart displays a gradual decline in financial performance, with rising bars depicted in soft blue against a serene teal background. Decrease business graph illustrations Minimalist financial bar chart illustrating gradual decline in economic performance. A clean, minimalist bar chart displays a gradual decline in financial performance, with rising bars depicted in soft blue against a serene teal background.
Free with trial This illustration features two colorful bar graphs on a white background, showcasing data comparison with distinct color palettes for engaging visual analysis and presentations. Decrease business graph illustrations Colorful Bar Graphs on White Background Representing Data Comparison and Growth with Different Color Schemes for Visual Analysis. This illustration features two colorful bar graphs on a white background, showcasing data comparison with distinct color palettes for engaging visual analysis and presentations
Free with trial Arrow trend-down icon vector set on white background. EPS 10. Decrease business graph vectors Arrow trend-down icon isolated on white background. Arrow trend-down icon vector set on white background. EPS 10
Free with trial Arrow trend-down icon vector set on white background. EPS 10. Decrease business graph vectors Arrow trend-down icon isolated on white background. Arrow trend-down icon vector set on white background. EPS 10
Free with trial Arrow trend-down icon vector set on white background. EPS 10. Decrease business graph vectors Arrow trend-down icon isolated on white background. Arrow trend-down icon vector set on white background. EPS 10
Free with trial A chart that shows a decline. A falling chart that goes down sharply, a market crash. Vector illustration. Decrease business graph vectors A chart that shows a decline. A falling chart that goes down sharply, a market crash. Vector
Free with trial Red arrow trending down against blue globe icon representing global economic crisis. Decrease business graph vectors Red arrow pointing down overlaying globe icon showing global economic crisis. Red arrow trending down against blue globe icon representing global economic crisis
Free with trial Vector illustration stacked coins and arrow trending down, decreasing statistical graphic concept. Decrease business graph vectors Vector illustration stack coin arrow downup trend. vector illustration stacked coins and arrow trending down, decreasing statistical graphic concept
Free with trial Reduce energy usage, in line design, green. Reduce, energy, usage, conservation, efficiency, sustainable, power on white background vector. Reduce energy usage editable stroke icon. Decrease business graph vectors Reduce energy usage, in line design, green. Reduce, energy, usage, conservation, efficiency, sustainable, power on white
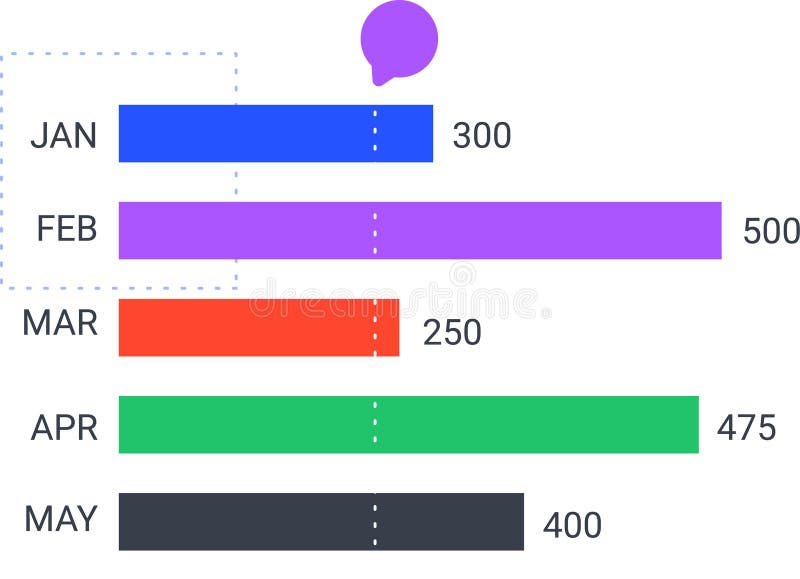
Free with trial Colorful horizontal bar chart is displaying monthly statistics from january to may, indicating trends and performance with a speech bubble above. Decrease business graph vectors Colorful horizontal bar chart is displaying monthly statistics from january to may, indicating trends and performance
Free with trial Up and down arrow icon set. Upward and downward illustration concept. Decrease business graph vectors Up and down arrow icon set. Upward and downward concept. Up and down arrow icon set. Upward and downward illustration concept
Free with trial Sine waves analysis outline icon in white and black colors. sine waves analysis flat vector icon from analytics collection for web, mobile apps and ui. Decrease business graph vectors Sine waves analysis outline icon in white and black colors. sine waves analysis flat vector icon from analytics collection for web
Free with trial Set line Many ways directional arrow Arrow Shopping bag with Sale Hierarchy organogram chart Delivery tracking Light bulb and Target icon. Vector. Decrease business graph vectors Set line Many ways directional arrow, Arrow, Shopping bag with Sale, Hierarchy organogram chart, Delivery tracking. Set line Many ways directional arrow Arrow Shopping bag with Sale Hierarchy organogram chart Delivery tracking Light bulb and Target icon. Vector.
Free with trial Laptop screen displays stock market analysis. Financial data shows investment trends. Person may trader analyst. Investment stock market analysis. Dynamic market graphs. Modern tech. Decrease business graph illustrations Laptop screen displays stock market analysis. Financial data shows investment trends. Person may trader analyst. Investment
Free with trial This abstract artwork illustrates financial market dynamics with intricate lines and colors, representing stock price movements and trading patterns artistically. Decrease business graph illustrations Abstract financial market analysis with intricate lines depicting stock price movements and trading patterns in shades of black. This abstract artwork illustrates financial market dynamics with intricate lines and colors, representing stock price movements and trading patterns artistically
Free with trial Colorful horizontal bar chart is displaying monthly statistics from january to may, indicating trends and performance with a speech bubble above. Decrease business graph vectors Colorful horizontal bar chart is displaying monthly statistics from january to may, indicating trends and performance
Free with trial Decline chart icon. Falling arrow symbol. Economic downturn illustration. Vector trend design. EPS 10. Decrease business graph vectors Decline chart icon. Falling arrow symbol. Economic downturn illustration. Vector trend design.
Free with trial Red crisis arrows on dark background. Economic recession, financial fall and crash concept. 3D Rendering. Decrease business graph illustrations Red crisis arrows on background. Economic recession, financial fall and crash concept. 3D Rendering
Free with trial Set Isometric Worker, Drop in crude oil price, Pie chart infographic and Global economic crisis news icon. Vector. Decrease business graph illustrations Set Isometric Worker, Drop in crude oil price, Pie chart infographic and Global economic crisis news icon. Vector
Free with trial 3d Up and Down sign with red arrows vector collection. Design vector illustration concept of sales bar chart symbol icon set with arrow moving down and sales bar chart with arrow moving up. Decrease business graph vectors 3d Up and Down sign with red arrows vector collection. Design vector illustration concept of sales bar chart symbol icon set
Free with trial Arrow trend-down icon vector set on white background. EPS 10. Decrease business graph vectors Arrow trend-down icon isolated on white background. Arrow trend-down icon vector set on white background. EPS 10
Free with trial Glowing neon Global economic crisis icon isolated on brick wall background. World finance crisis. Neon light alphabet. Vector. Decrease business graph illustrations Glowing neon Global economic crisis icon isolated on brick wall background. World finance crisis. Neon light alphabet
Free with trial A simple infographic that schematically depicts the dynamics of the decline in offshore oil production. Vector illustration. Decrease business graph vectors The dynamics of the decline in offshore oil production in laconic infographics. A simple infographic that schematically depicts the dynamics of the decline in offshore oil production. Vector illustration.