Free with trial Decrease icon or logo isolated sign symbol vector illustration - Collection of high quality black style vector icons, seles chart icon isolated sign symbol vector illustration - Collection of high quality. Decrease crash vectors Decrease icon or logo isolated sign symbol vector illustration
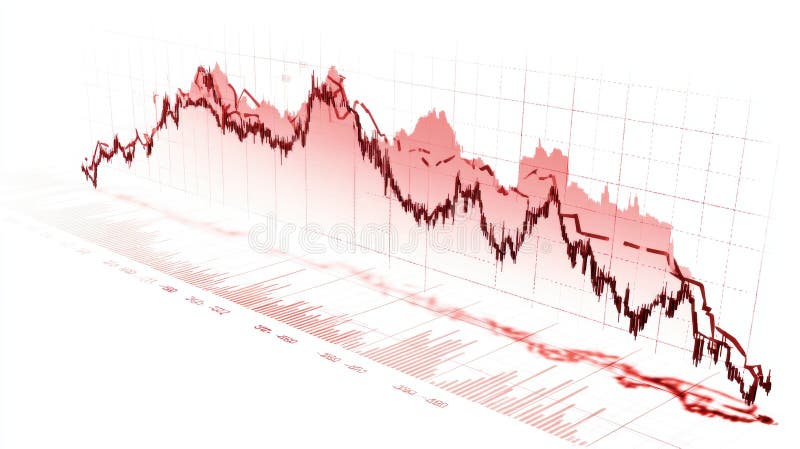
Free with trial Financial chart with red and orange bars on a dark background. Concept of market crash, recession, and falling stock index. 3D Rendering. Decrease crash illustrations Financial chart displaying a downward trend with red and orange bars. 3D Rendering. Financial chart with red and orange bars on a dark background. Concept of market crash, recession, and falling stock index. 3D Rendering
Free with trial Red stock market graph plummets on a laptop keyboard, indicating financial loss and market decline, great for business and finance themes. Decrease crash illustrations Stock market crash data on laptop keyboard. Red stock market graph plummets on a laptop keyboard, indicating financial loss and market decline, great for business and finance themes
Free with trial Stock market trading technical analysis bar chart fall banner. Business candlestick graph exchange down trend. Economic downturn and investment loss graph. Trader financial index crash and bankruptcy. Decrease crash illustrations Stock market trading technical analysis bar chart fall banner. Business candlestick graph exchange down trend. Economy. Stock market trading technical analysis bar chart fall banner. Business candlestick graph exchange down trend. Economic downturn and investment loss graph. Trader financial index crash and bankruptcy
Free with trial Stock market trading technical analysis bar chart fall banner. Business candlestick graph exchange down trend. Economic downturn and investment loss graph. Trader financial index crash and bankruptcy. Decrease crash vectors Stock market trading technical analysis bar chart fall banner. Business candlestick graph exchange down trend. Economy. Stock market trading technical analysis bar chart fall banner. Business candlestick graph exchange down trend. Economic downturn and investment loss graph. Trader financial index crash and bankruptcy
Free with trial Anxious Trader Female Character Panics As Ethereum Cryptocurrency Price Decrease, Fearing Financial Loss And Uncertainty In Market, Exacerbating The Downward Trend. Cartoon People Vector Illustration. Decrease crash vectors Anxious Trader Female Character Panics As Cryptocurrency Prices Decrease, Fearing Financial Loss And Uncertainty. Anxious Trader Female Character Panics As Ethereum Cryptocurrency Price Decrease, Fearing Financial Loss And Uncertainty In Market, Exacerbating The Downward Trend. Cartoon People Vector Illustration
Free with trial Close up of laptop and smartphone on desk with red crisis arrows on blurry background. Economic recession, financial fall and crash concept. Double exposure. Decrease crash illustrations Close up of laptop and smartphone on desk with red crisis arrows on blurry background. Economic recession, financial fall and
Free with trial Close up of bank card and laptop keyboard with red crisis arrows on blurry background. Economic recession, financial fall and crash concept. Double exposure. Decrease crash illustrations Close up of bank card and laptop keyboard with red crisis arrows on blurry background. Economic recession, financial fall and
Free with trial Sad businessman trader on stock index chart falling and investor finance loss banner concept. Stressed business man broker on exchange market trading decreasing data fall down graph. Economic crash. Decrease crash vectors Sad businessman trader on stock index chart falling and investor finance loss banner concept. Stressed business man
Free with trial 3D Isometric Flat Vector Illustration of Global Economic Crash, Entrepreneur Declares Bankruptcy And Shuts Down Company. Decrease crash vectors 3D Isometric Flat Vector Illustration of Global Economic Crash
Free with trial Reduction chart icon Vector symbol or sign set collection in black and white outline. Decrease crash vectors Decline Chart Icon Illustrating Decrease in Performance, Economic Downturn, and Analytical Data. Reduction chart icon Vector symbol or sign set collection in black and white outline
Free with trial Market red arrow down illustration decline decrease, drop fall, turn recession market red arrow down. Decrease crash illustrations Market red arrow down
Free with trial Bull Market, Bull or bullish run Bear or bearish market trend in stocks. Trade exchange, green up or red down arrows graph. Cryptocurrency price chart. Global economy crash or boom. Decrease crash vectors Bull Market
Free with trial Digital display featuring a red falling line graph and warning triangle icon in isometric perspective. Selective focus on financial crisis data, market crash, and global recession concept. Decrease crash illustrations Red digital graph showing sharp decline with warning sign on dark background. Digital display featuring a red falling line graph and warning triangle icon in isometric perspective. Selective focus on financial crisis data, market crash, and global recession concept.
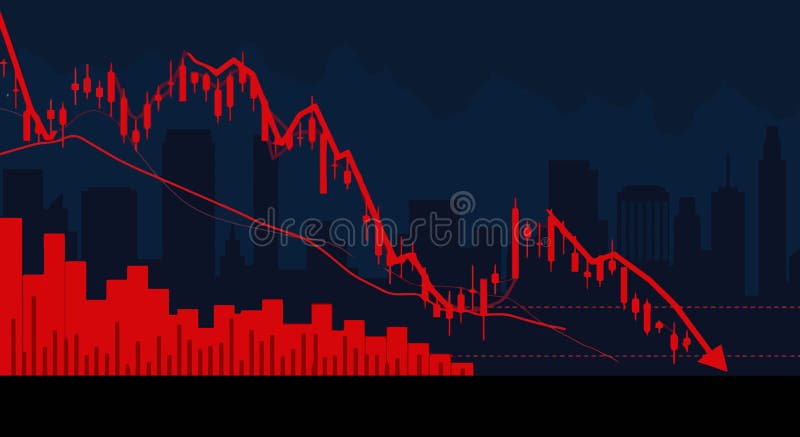
Free with trial The image shows a city skyline with a red downward trend line indicating a financial crisis. Vector illustration design using ai tool. Decrease crash vectors Economy crash coming. The image shows a city skyline with a red downward trend line indicating a financial crisis. Vector illustration design using ai tool.
Free with trial Set line Glass money jar with coin, Dollar rate decrease, Tearing banknote and Safe. Glowing neon icon. Vector. Decrease crash vectors Set line Glass money jar with coin, Dollar rate decrease, Tearing banknote and Safe. Glowing neon icon. Vector
Free with trial Spilled oil beside a sharply downward trending graph, generated by AI, visually represents the dramatic fall in oil prices. The image suggests instability and economic downturn within the oil market. Decrease crash illustrations Oil Price Crash. Spilled oil beside a sharply downward trending graph, generated by AI, visually represents the dramatic fall in oil prices. The image suggests instability and economic downturn within the oil market.
Free with trial A dynamic 3D illustration of a glossy red arrow pointing downwards in a jagged, volatile path. Isolated on a white background, this graphic icon is a powerful symbol for negative concepts. It represents decline, decrease, failure, loss, and crisis. This visual is perfect for illustrating stock market crashes, economic recession, financial downturns, poor business performance, or any downward trend in data and statistics. An ideal element for reports, presentations, and financial news, with ample copy space. Decrease crash illustrations Red Jagged Arrow of Decline - Financial Crisis Concept. A dynamic 3D illustration of a glossy red arrow pointing downwards in a jagged, volatile path. Isolated on a white background, this graphic icon is a powerful symbol for negative concepts. It represents decline, decrease, failure, loss, and crisis. This visual is perfect for illustrating stock market crashes, economic recession, financial downturns, poor business performance, or any downward trend in data and statistics. An ideal element for reports, presentations, and financial news, with ample copy space.
Free with trial Black and white illustration featuring two elements. The top section displays a speech bubble with a downward arrow and a Bitcoin symbol, suggesting a decrease. Below, a square frame contains a simplistic image of a landscape with a sun and a mountain, often used to represent digital images or NFTs. The design uses bold lines and minimalistic style to convey the concept of digital currency and media. Decrease crash vectors NFT Prices Down. Black and white illustration featuring two elements. The top section displays a speech bubble with a downward arrow and a Bitcoin symbol, suggesting a decrease. Below, a square frame contains a simplistic image of a landscape with a sun and a mountain, often used to represent digital images or NFTs. The design uses bold lines and minimalistic style to convey the concept of digital currency and media.
Free with trial Red arrows pointing downward over a world map symbolize global financial decline. Decrease crash vectors Global stock market crash with red falling arrows. Red arrows pointing downward over a world map symbolize global financial decline
Free with trial Image is generated with the use of an AI. Decrease crash illustrations Chart market stock technology indicator crisis visualization economy crash diagram glow background shiny data finance graph money. image is generated with the use of an AI
Free with trial This image shows a declining stock market graph with red candlesticks and bars. Vector illustration design using ai tool. Decrease crash vectors Stock market crash recession. This image shows a declining stock market graph with red candlesticks and bars. Vector illustration design using ai tool.
Free with trial Conceptual financial illustration of a falling stock market index. Red line graph showing sharp decline, volatility, and economic crisis point with a target circle on a dark grid background. Decrease crash illustrations Red stock market graph showing economic crash and financial crisis on dark background. Conceptual financial illustration of a falling stock market index. Red line graph showing sharp decline, volatility, and economic crisis point with a target circle on a dark grid background.
Free with trial Downturn collapsing sales graph illustration slump decrease, drop fall, dip shrinkage downturn collapsing sales graph. Decrease crash illustrations Downturn collapsing sales graph
Free with trial A downward trending red arrow, generated by AI, rests on a smartphone displaying a graph, symbolizing a market decline. This visualization is a powerful representation of negative financial trends and economic downturn, ideal for illustrating news reports or financial analyses. Decrease crash illustrations Mobile Market Crash. A downward trending red arrow, generated by AI, rests on a smartphone displaying a graph, symbolizing a market decline. This visualization is a powerful representation of negative financial trends and economic downturn, ideal for illustrating news reports or financial analyses.
Free with trial A hand-drawn chart on a napkin depicts a market downturn, alongside cash and coins. This image, generated by AI, symbolizes economic uncertainty and the informal nature of financial planning. It visually represents potential anxieties surrounding investments and personal finances. Decrease crash illustrations Napkin Market Crash. A hand-drawn chart on a napkin depicts a market downturn, alongside cash and coins. This image, generated by AI, symbolizes economic uncertainty and the informal nature of financial planning. It visually represents potential anxieties surrounding investments and personal finances.
Free with trial Financial difficulties, decrease in value of business or company shares, stock market crash, economic crisis, business failure and loss of cash, lose investments, a man falls off the chart. Decrease crash vectors Man falls off the chart
Free with trial This image shows a declining bar graph with broken bars and a downward trend line. Vector illustration design using ai tool. Decrease crash vectors Stock market crash. This image shows a declining bar graph with broken bars and a downward trend line. Vector illustration design using ai tool.
Free with trial Creative abstract background with multiple glowing downward arrows in red and orange tones. Graphic representation of financial loss, bear market, economic downturn, and business failure. High-tech digital design with selective focus and light effects for financial and data analysis concepts. Decrease crash illustrations Glowing downward arrows on red background representing economic crash and market decline. Creative abstract background with multiple glowing downward arrows in red and orange tones. Graphic representation of financial loss, bear market, economic downturn, and business failure. High-tech digital design with selective focus and light effects for financial and data analysis concepts.
Free with trial Financial difficulties, decrease in value of business or company shares, stock market crash, economic crisis, business failure, loss of cash, lose investments, man points a magnifier to broken arrow. Decrease crash vectors Man points to broken arrow. Financial difficulties, decrease in value of business or company shares, stock market crash, economic crisis, business failure, loss of cash, lose investments, man points a magnifier to broken arrow
Free with trial This image depicts a sharply declining stock market graph, generated by AI, highlighting the severity of the downturn. The red arrow emphasizes the dramatic fall in market values, representing a potential crisis for investors. Decrease crash illustrations Market Crash: Red Alert. This image depicts a sharply declining stock market graph, generated by AI, highlighting the severity of the downturn. The red arrow emphasizes the dramatic fall in market values, representing a potential crisis for investors.
Free with trial Downturn red stock chart illustration selloff recession, volatility dip, crash slump downturn red stock chart. Decrease crash illustrations Downturn red stock chart
Free with trial A simple, bold red arrow trending downwards against a white background. The arrow zigzags downwards, ending with an arrowhead pointing down, resting on a horizontal red line. This image represents concepts like financial loss, economic downturn, market crash, failure, and negative trends. It's suitable for illustrating articles, presentations, or reports dealing with business, finance, and economics. Decrease crash illustrations Red Downward Trend Arrow. A simple, bold red arrow trending downwards against a white background. The arrow zigzags downwards, ending with an arrowhead pointing down, resting on a horizontal red line. This image represents concepts like financial loss, economic downturn, market crash, failure, and negative trends. It's suitable for illustrating articles, presentations, or reports dealing with business, finance, and economics.
Free with trial This image depicts a downward trending arrow formed by a series of red dots against a bright blue sky with fluffy white clouds. The trajectory is clearly negative, visually representing a decline or decrease. This graphic was generated by AI, offering a simple yet effective visual representation of. Decrease crash illustrations AI Generated Downward Trend. This image depicts a downward trending arrow formed by a series of red dots against a bright blue sky with fluffy white clouds. The trajectory is clearly negative, visually representing a decline or decrease. This graphic was generated by AI, offering a simple yet effective visual representation of
Free with trial A line graph with a decreasing trend is commonly used to depict scenarios like declining sales, decreasing stock prices, or any situation where a decrease in values over time or across categories is a significant aspect of the data. It provides a clear and intuitive way to understand trends and make informed interpretations about the decreasing values being represented. Decrease crash illustrations Chart with decreasing line graph. A line graph with a decreasing trend is commonly used to depict scenarios like declining sales, decreasing stock prices, or any situation where a decrease in values over time or across categories is a significant aspect of the data. It provides a clear and intuitive way to understand trends and make informed interpretations about the decreasing values being represented.
Free with trial Financial difficulties, decrease in value of business or company shares, stock market crash, economic crisis, business failure and loss of cash, lose investments, a man falls off the broken arrow. Decrease crash vectors Man falls off the broken arrow
Free with trial Abstract financial background featuring multiple glowing arrows moving downward. High-tech digital design representing market loss, economic crisis, decreasing profit, and global recession concept with tech elements and light effects. Decrease crash illustrations Abstract red background with falling arrows representing financial crash and economic decline. Abstract financial background featuring multiple glowing arrows moving downward. High-tech digital design representing market loss, economic crisis, decreasing profit, and global recession concept with tech elements and light effects.
Free with trial This image shows a downward trend in stock prices with candlestick charts and arrows indicating the decline. Vector illustration design using ai tool. Decrease crash vectors Stock crash. This image shows a downward trend in stock prices with candlestick charts and arrows indicating the decline. Vector illustration design using ai tool.
Free with trial Stock crisis red price drop arrow down chart fall. Stock market exchange analysis or forex graph business and finance money losing moving economic inflation deflation investment loss crash. Illustration. Decrease crash illustrations Stock crisis red price drop arrow down chart fall
Free with trial Stock crisis red price drop arrow down chart fall. Stock market exchange analysis or forex graph business and finance money losing moving economic inflation deflation investment loss crash. Illustration. Decrease crash illustrations Stock crisis red price drop arrow down chart fall
Free with trial Stock crisis red price drop arrow down chart fall. Stock market exchange analysis or forex graph business and finance money losing moving economic inflation deflation investment loss crash. Illustration. Decrease crash illustrations Stock crisis red price drop arrow down chart fall
Free with trial Stock crisis red price drop arrow down chart fall. Stock market exchange analysis or forex graph business and finance money losing moving economic inflation deflation investment loss crash. Illustration. Decrease crash illustrations Stock crisis red price drop arrow down chart fall
Free with trial A hand holds a piece of paper with a hand-drawn graph showing a sharp decline. The downward trend is clearly visible, indicating a negative development. This image was generated by AI and is ideal for illustrating concepts like economic downturn, market crash, or business failure. Decrease crash illustrations Hand Holding Declining Graph. A hand holds a piece of paper with a hand-drawn graph showing a sharp decline. The downward trend is clearly visible, indicating a negative development. This image was generated by AI and is ideal for illustrating concepts like economic downturn, market crash, or business failure.
Free with trial A digital screen shows a sharp decline in stock market indices, indicated by a red arrow and graph. Numbers flash, reflecting significant losses. Decrease crash illustrations Stock Market Crash. A digital screen shows a sharp decline in stock market indices, indicated by a red arrow and graph. Numbers flash, reflecting significant losses
Free with trial This image, generated by AI, depicts a hand placing a small, metallic object onto a graph showing a sharp market decline. It visually represents the fragility and potential for sudden drops in financial markets. The image is a high-quality 3D rendering. Decrease crash illustrations AI-Generated Market Crash Image. This image, generated by AI, depicts a hand placing a small, metallic object onto a graph showing a sharp market decline. It visually represents the fragility and potential for sudden drops in financial markets. The image is a high-quality 3D rendering.
Free with trial A 3D red arrow is shown disintegrating into small cubes, symbolizing a sharp decline or market crash. The visual metaphor represents instability, loss, and negative trends in business, finance, or other areas. The design is minimalist and impactful. Decrease crash illustrations Collapsing Red Arrow. A 3D red arrow is shown disintegrating into small cubes, symbolizing a sharp decline or market crash. The visual metaphor represents instability, loss, and negative trends in business, finance, or other areas. The design is minimalist and impactful.
Free with trial A young woman sits dejectedly as a graph plummets dramatically. This AI-generated illustration depicts the emotional toll of economic downturns, symbolizing anxiety and uncertainty in the face of financial crisis. The image is perfect for articles discussing market volatility, investment strategies. Decrease crash illustrations Market Crash Anxiety. A young woman sits dejectedly as a graph plummets dramatically. This AI-generated illustration depicts the emotional toll of economic downturns, symbolizing anxiety and uncertainty in the face of financial crisis. The image is perfect for articles discussing market volatility, investment strategies
Free with trial A stylized illustration depicts a bar chart with blue bars of varying heights against a dark blue grid background. A prominent red and yellow arrow, symbolizing a downward trend, dramatically descends across the chart. This graphic represents financial decline, market crash, economic recession, or negative growth. Its clean, vector-style design makes it suitable for presentations, reports, and articles on business, finance, and economics. Decrease crash illustrations Declining Bar Chart with Red Arrow. A stylized illustration depicts a bar chart with blue bars of varying heights against a dark blue grid background. A prominent red and yellow arrow, symbolizing a downward trend, dramatically descends across the chart. This graphic represents financial decline, market crash, economic recession, or negative growth. Its clean, vector-style design makes it suitable for presentations, reports, and articles on business, finance, and economics.
Free with trial Downward arrow and declining stock chart on light background, representing financial crisis, market crash, and economic recession. 3D Rendering. Decrease crash illustrations Financial market collapse with downward arrow and declining chart. 3D Rendering. Downward arrow and declining stock chart on light background, representing financial crisis, market crash, and economic recession. 3D Rendering
Free with trial Decline red stock chart illustration downturn selloff, recession volatility, dip crash decline red stock chart. Decrease crash illustrations Decline red stock chart
Free with trial A striking white sculpture, generated by AI, depicts a figure slumping as a descending graph dramatically falls to the ground, symbolizing market downturn or economic crisis. The stark contrast between the white sculpture and the gray background emphasizes the gravity of the situation. The image i. Decrease crash illustrations AI-Generated Sculpture: Market Crash. A striking white sculpture, generated by AI, depicts a figure slumping as a descending graph dramatically falls to the ground, symbolizing market downturn or economic crisis. The stark contrast between the white sculpture and the gray background emphasizes the gravity of the situation. The image i
Free with trial This image depicts a dramatic market decline, visualized as a 3D graph showing a sharp downward trend. The red color emphasizes the severity of the losses, and the detailed chart is generated by AI, offering a realistic representation of financial instability. It can be used to illustrate economic. Decrease crash illustrations Red Market Crash Graph. This image depicts a dramatic market decline, visualized as a 3D graph showing a sharp downward trend. The red color emphasizes the severity of the losses, and the detailed chart is generated by AI, offering a realistic representation of financial instability. It can be used to illustrate economic
Free with trial Vector icon of a downward arrow or falling graph, symbolizing financial decline, loss trends, market crash, and negative economic performance. Ideal for finance apps, investment platforms, business reports, stock market analysis, and economic infographics. Clean, impactful, and scalable for both digital and print use. Decrease crash vectors Financial Decline Trend Loss Graph Icon. Vector icon of a downward arrow or falling graph, symbolizing financial decline, loss trends, market crash, and negative economic performance. Ideal for finance apps, investment platforms, business reports, stock market analysis, and economic infographics. Clean, impactful, and scalable for both digital and print use.
Free with trial Economic crisis line icon of investment decline with arrow down, vector outline symbol. Global economy downturn and bankruptcy or world crisis in banking business and stock exchange decrease. Decrease crash vectors Economic crisis line icon of investment decline
Free with trial A close-up view of a laptop displaying a stock market chart with fluctuating trends, illustrating concepts of financial volatility and market analysis - generated AI. Decrease crash illustrations Stock market crash concept with graph on laptop screen. A close-up view of a laptop displaying a stock market chart with fluctuating trends, illustrating concepts of financial volatility and market analysis - generated AI
Free with trial A minimalist vector icon representing a house with a prominent downward arrow. Decrease crash vectors Real Estate Market Decrease Vector Icon. A minimalist vector icon representing a house with a prominent downward arrow
Free with trial Economic crisis line icons of global financial downturn and business bankruptcy, vector banner. Money loss and banking crisis icons of depreciation, unemployment and price decrease of pandemic crisis. Decrease crash vectors Economic crisis icons of global financial downturn. Economic crisis line icons of global financial downturn and business bankruptcy, vector banner. Money loss and banking crisis icons of depreciation, unemployment and price decrease of pandemic crisis
Free with trial This icon of a portfolio with three downward arrows represents the concept of investment losses. Decrease crash vectors Portfolio money loss icon showing investment decrease. This icon of a portfolio with three downward arrows represents the concept of investment losses
Free with trial Red downward arrow and a percentage symbol on a white background, indicating a financial crisis, market recession, or stock market crash. 3D Rendering. Decrease crash illustrations Red downward arrow and percentage symbol on white background. 3D Rendering. Red downward arrow and a percentage symbol on a white background, indicating a financial crisis, market recession, or stock market crash. 3D Rendering
Free with trial This image shows a declining red arrow over a cityscape with sad figures and cracked ground. Vector illustration design using ai tool. Decrease crash vectors Economic crash. This image shows a declining red arrow over a cityscape with sad figures and cracked ground. Vector illustration design using ai tool.
Free with trial A conceptual 3D illustration depicting a white growth arrow on a collapsing bar chart. The crumbling blocks and debris symbolize a dramatic failure or downturn. This powerful metaphor represents concepts such as financial crisis, economic recession, stock market crash, business bankruptcy, or unsustainable growth built on a fragile foundation. The minimalist gray background focuses attention on the central theme of collapse and risk, making it ideal for financial reports, business presentations, and articles about economic instability. Decrease crash illustrations Economic Crisis and Crumbling Growth Chart. A conceptual 3D illustration depicting a white growth arrow on a collapsing bar chart. The crumbling blocks and debris symbolize a dramatic failure or downturn. This powerful metaphor represents concepts such as financial crisis, economic recession, stock market crash, business bankruptcy, or unsustainable growth built on a fragile foundation. The minimalist gray background focuses attention on the central theme of collapse and risk, making it ideal for financial reports, business presentations, and articles about economic instability.
Free with trial This minimalist vector illustration features two identical line graphs, presented in contrasting black and white themes. The left graph displays a black line on a white background, while the right shows a white line on a black background. Both graphs depict a clear downward trend with jagged fluctuations, symbolizing decline, loss, or negative growth over time. This versatile icon set is ideal for illustrating concepts such as economic downturns, financial losses, market crashes, business failures, or any data showing a significant decrease. Perfect for presentations, reports, infographics, and web design. Decrease crash vectors Declining Line Graph Icon Set - Black and White. This minimalist vector illustration features two identical line graphs, presented in contrasting black and white themes. The left graph displays a black line on a white background, while the right shows a white line on a black background. Both graphs depict a clear downward trend with jagged fluctuations, symbolizing decline, loss, or negative growth over time. This versatile icon set is ideal for illustrating concepts such as economic downturns, financial losses, market crashes, business failures, or any data showing a significant decrease. Perfect for presentations, reports, infographics, and web design.
Free with trial Visualize the sharp downturn in cryptocurrency markets with this dynamic graphic showing falling prices, a sell button, and a downward arrow. Perfect for financial news and investment analysis. Decrease crash vectors Cryptocurrency market crash graphic with sell button and falling arrow. Visualize the sharp downturn in cryptocurrency markets with this dynamic graphic showing falling prices, a sell button, and a downward arrow. Perfect for financial news and investment analysis
Free with trial This 3D bar graph, generated by AI, visually represents a significant downward trend. The red bars show a decrease in value over time, culminating in a sharp drop indicated by the prominent red arrow. This image is ideal for illustrating economic downturns, market crashes, or any scenario depicting. Decrease crash illustrations Declining Bar Graph. This 3D bar graph, generated by AI, visually represents a significant downward trend. The red bars show a decrease in value over time, culminating in a sharp drop indicated by the prominent red arrow. This image is ideal for illustrating economic downturns, market crashes, or any scenario depicting
Free with trial Red arrow pointing down and the word down illuminated on a digital stock ticker display, indicating a market downturn. Decrease crash illustrations Stock market crash showing downward trend on digital display. Red arrow pointing down and the word down illuminated on a digital stock ticker display, indicating a market downturn
Free with trial A 3D render illustrating the concept of financial decline and economic crisis. The image features a bar chart with progressively smaller bars and a prominent red arrow pointing downwards, signifying a sharp downturn. This visual metaphor represents a stock market crash, business failure, investment loss, or recession. The minimalist design on a yellow background is perfect for financial reports, business presentations, economic news articles, and web graphics discussing negative growth, losses, or bankruptcy. A small stack of coins reinforces the monetary theme. Decrease crash illustrations 3D Financial Decline Graph with Downward Arrow. A 3D render illustrating the concept of financial decline and economic crisis. The image features a bar chart with progressively smaller bars and a prominent red arrow pointing downwards, signifying a sharp downturn. This visual metaphor represents a stock market crash, business failure, investment loss, or recession. The minimalist design on a yellow background is perfect for financial reports, business presentations, economic news articles, and web graphics discussing negative growth, losses, or bankruptcy. A small stack of coins reinforces the monetary theme.
Free with trial Businessman stick figure character run away from falling down arrow chart and falling to ground. Business failure, investment loss or market crash. hand drawn vector doodle illustration. Decrease crash vectors Businessman stick figure character run away from falling down arrow chart and falling to ground. Business failure, investment loss
Free with trial A close-up view of a laptop screen showing a stock market crash with candlestick charts and financial data, highlighting market volatility and investment risks - generated AI. Decrease crash illustrations Stock market decline displayed on laptop with financial charts. A close-up view of a laptop screen showing a stock market crash with candlestick charts and financial data, highlighting market volatility and investment risks - generated AI
Free with trial A 3D-rendered image depicts a sharply declining red arrow on a bar graph, symbolizing a significant market downturn. The graph is set against a solid blue background. Decrease crash illustrations 3D Render of a Dramatic Stock Market Crash Graph. A 3D-rendered image depicts a sharply declining red arrow on a bar graph, symbolizing a significant market downturn. The graph is set against a solid blue background.
Free with trial A 3D rendered image of a bar graph disintegrating into dust, symbolizing economic decline or market crash. This powerful visual metaphor, generated by AI, highlights the fragility of growth and the potential for sudden collapse. Decrease crash illustrations Collapsing Growth Chart. A 3D rendered image of a bar graph disintegrating into dust, symbolizing economic decline or market crash. This powerful visual metaphor, generated by AI, highlights the fragility of growth and the potential for sudden collapse.
Free with trial Silver bullion broken showing economic recession and market crash. Silver bullion broken with a red down arrow symbolizing financial crisis and falling markets. Decrease crash illustrations Silver bullion broken showing economic recession and market crash. Silver bullion broken with a red down arrow symbolizing financial crisis and falling markets
Free with trial Businessman stick figure character looking bad result presentation chart with red crisis arrow down. failed diagram, bankruptcy, decrease financial problem. hand drawn style doodle illustration. Decrease crash vectors Businessman stick figure character looking bad result presentation chart with red crisis arrow down. failed diagram, bankruptcy
Free with trial A 3D rendered icon featuring a golden bar graph with a downward trend line and a red arrow indicating a decrease. The graph is set on a black circular background with a prominent gold rim. This symbol represents financial decline, loss, or negative performance. Decrease crash illustrations Golden Graph with Downward Trend Arrow on Black Circle with Gold Rim chart falling. A 3D rendered icon featuring a golden bar graph with a downward trend line and a red arrow indicating a decrease. The graph is set on a black circular background with a prominent gold rim. This symbol represents financial decline, loss, or negative performance
Free with trial Abstract pixel dotted arrows falling down on dark background, representing economic crisis, investment loss, negative growth, and digital finance instability. Decrease crash illustrations Digital dotted arrows pointing downward in glowing red light, symbolizing stock crash, market decline, financial risk, and. Abstract pixel dotted arrows falling down on dark background, representing economic crisis, investment loss, negative growth, and digital finance instability
Free with trial This striking image depicts a 3D rendering of a dramatic market downturn, generated by AI. The red, origami-style arrow plunges downwards, contrasting sharply with the clean, minimalist background. The visual emphasizes the severity of the economic decline. Decrease crash illustrations AI-Generated Market Crash Visualization. This striking image depicts a 3D rendering of a dramatic market downturn, generated by AI. The red, origami-style arrow plunges downwards, contrasting sharply with the clean, minimalist background. The visual emphasizes the severity of the economic decline.
Free with trial A hand draws a downward-trending line graph on a chalkboard using chalk, illustrating a negative market trend or decline. This visual representation, generated by AI, is often used to symbolize economic recession, stock market crashes, or other forms of decrease. Decrease crash illustrations Downward Trend. A hand draws a downward-trending line graph on a chalkboard using chalk, illustrating a negative market trend or decline. This visual representation, generated by AI, is often used to symbolize economic recession, stock market crashes, or other forms of decrease.
Free with trial Red downward chart. Financial market crash with red arrow. Flat vector illustration isolated on white background. Decrease crash vectors Red downward chart. Flat vector illustration isolated on white. Red downward chart. Financial market crash with red arrow. Flat vector illustration isolated on white background.
Free with trial An isometric view of decreasing coins isolated on a white background, representing financial loss, recession, and economic decline. Decrease crash illustrations Coins decrease isometric isolated on white background. An isometric view of decreasing coins isolated on a white background, representing financial loss, recession, and economic decline
Free with trial Businessman stick figure character run away from falling down dollar and arrow chart. Business failure, investment loss or market crash crisis. hand drawn style vector doodle illustration. Decrease crash vectors Businessman stick figure character run away from falling down dollar and arrow chart. Business failure, investment loss or market
Free with trial A bold, jagged red arrow points downwards, symbolizing a significant decrease or negative trend in a graph or chart. Decrease crash illustrations Sharp red arrow indicating downward trend and decline. A bold, jagged red arrow points downwards, symbolizing a significant decrease or negative trend in a graph or chart