Free with trial Abstract curved arrows in red light falling downward, representing stock market drop, loss, inflation, downturn, and risk concept for financial and business projects. Decrease crash illustrations Red glowing curved arrows pointing down on dark background, symbolizing economic decline, market crash, financial crisis, or. Abstract curved arrows in red light falling downward, representing stock market drop, loss, inflation, downturn, and risk concept for financial and business projects
Free with trial Red candlestick graph showing falling stock market prices during trading session with warm lights in the foreground. Decrease crash illustrations Stock market crash showing falling prices during trading session. Red candlestick graph showing falling stock market prices during trading session with warm lights in the foreground
Free with trial This long exposure photograph powerfully portrays the devastating impact of a plummeting market. Blurred light trails, indicative of rapid, downward movement, are a stark visual representation of falling prices and a stock market crash. The dark background emphasizes the mood of financial instability and economic hardship, creating a haunting stillness that encapsulates the uncertainty and risk. Decrease crash illustrations Long Exposure Captures the Haunting Stillness of a Plunging Stock Market and Economic Downturn. This long exposure photograph powerfully portrays the devastating impact of a plummeting market. Blurred light trails, indicative of rapid, downward movement, are a stark visual representation of falling prices and a stock market crash. The dark background emphasizes the mood of financial instability and economic hardship, creating a haunting stillness that encapsulates the uncertainty and risk
Free with trial Vector illustration of a falling stock market graph. Red candlestick and line charts show a bearish trend, representing financial crisis and economic recession. Decrease crash vectors Red Financial Chart Downtrend Stock Market Crash Concept. Vector illustration of a falling stock market graph. Red candlestick and line charts show a bearish. Vector illustration of a falling stock market graph. Red candlestick and line charts show a bearish trend, representing financial crisis and economic recession.
Free with trial Abstract fast falling arrows in red glow, representing stock collapse, bearish trend, investment risk, and negative business performance in modern financial industry. Decrease crash illustrations Glowing white arrows pointing downward with fast motion effect on dark background, symbolizing rapid market crash, economic. Abstract fast falling arrows in red glow, representing stock collapse, bearish trend, investment risk, and negative business performance in modern financial industry
Free with trial Nasdaq index falling showing a stock market crash with rain drops on a reflective surface. Decrease crash illustrations Stock market crashing with nasdaq index falling displayed on a screen. Nasdaq index falling showing a stock market crash with rain drops on a reflective surface
Free with trial Abstract digital red arrows with sharp edges falling downward, representing negative trend, collapse, market risk, recession, and downturn in global finance and economy. Decrease crash illustrations Glowing square edge red arrows pointing down on dark background, symbolizing stock crash, business loss, economic decline, and. Abstract digital red arrows with sharp edges falling downward, representing negative trend, collapse, market risk, recession, and downturn in global finance and economy
Free with trial Abstract red glowing arrow falling down fast, representing economic downturn, stock crash, negative growth, or crisis warning in modern business and financial industries. Decrease crash illustrations Dynamic glowing arrows pointing downward on dark background, symbolizing decline, loss, crisis, or business failure. Perfect for. Abstract red glowing arrow falling down fast, representing economic downturn, stock crash, negative growth, or crisis warning in modern business and financial industries
Free with trial This dynamic graphic depicts a sharp downward trend, visualized by a bold red arrow dramatically descending across a grey, jagged line graph. The graph itself shows significant fluctuations, but the overarching movement is a steep decline, symbolizing losses, negative growth, or a crisis. The clean white background isolates the data representation, making it ideal for conveying financial downturns, market crashes, or any situation involving a significant decrease. Decrease crash illustrations Sharp Decline: Red Arrow Graph Illustrating Downward Trend. This dynamic graphic depicts a sharp downward trend, visualized by a bold red arrow dramatically descending across a grey, jagged line graph. The graph itself shows significant fluctuations, but the overarching movement is a steep decline, symbolizing losses, negative growth, or a crisis. The clean white background isolates the data representation, making it ideal for conveying financial downturns, market crashes, or any situation involving a significant decrease.
Free with trial Red graph is rapidly declining, representing a market crash, with percentage and dollar signs indicating financial losses. Decrease crash illustrations Red graph showing market crashing down with percentage and dollar sign in background. Red graph is rapidly declining, representing a market crash, with percentage and dollar signs indicating financial losses
Free with trial Red graph falling down representing stock market crash with data and numbers on dark background. Decrease crash illustrations Stock market crashing down with red graph and numbers on dark background. Red graph falling down representing stock market crash with data and numbers on dark background
Free with trial A 3D rendering showcases a sharply declining stock market graph, with a large red arrow dramatically emphasizing the downturn. The image visually represents a significant financial crisis or market collapse. Decrease crash illustrations Dramatic Stock Market Crash: Red Arrow Plunges Through Chart. A 3D rendering showcases a sharply declining stock market graph, with a large red arrow dramatically emphasizing the downturn. The image visually represents a significant financial crisis or market collapse.
Free with trial Red digital ticker displays showing falling stock exchange prices during volatile trading. Decrease crash illustrations Stock market crash showing falling prices on digital screens. Red digital ticker displays showing falling stock exchange prices during volatile trading
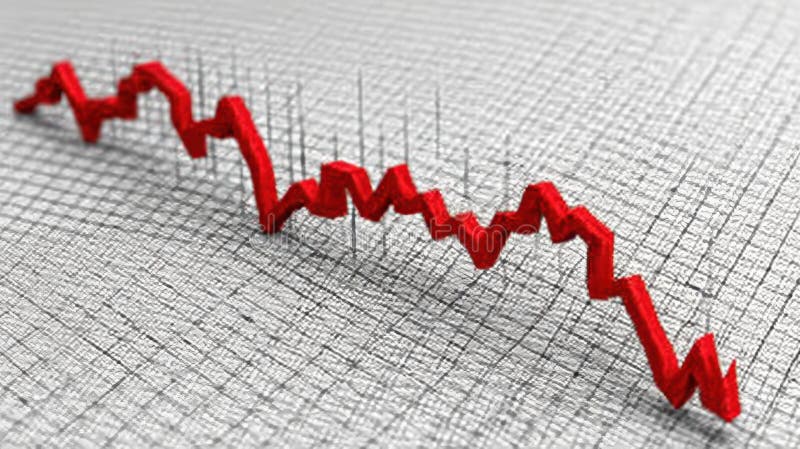
Free with trial A bold red arrow zigzags downwards, symbolizing a significant decrease, loss, or negative trend. Decrease crash vectors Red arrow indicating downward trend and decline. A bold red arrow zigzags downwards, symbolizing a significant decrease, loss, or negative trend
Free with trial Red stock market chart showing decreasing values, concept of financial crisis and economic recession. Decrease crash illustrations Stock market crash showing decreasing values with red numbers. Red stock market chart showing decreasing values, concept of financial crisis and economic recession
Free with trial Falling stock prices on the nasdaq exchange during trading session, indicating a potential market crash. Decrease crash illustrations Nasdaq stock market crashing showing falling values during trading session. Falling stock prices on the nasdaq exchange during trading session, indicating a potential market crash
Free with trial A person holds a graph showing a sharp market downturn, illustrating a significant decrease in value. The red line highlights the negative trend, generated by AI for illustrative purposes. This image is perfect for representing financial losses or economic instability. Decrease crash illustrations Declining Market Trend. A person holds a graph showing a sharp market downturn, illustrating a significant decrease in value. The red line highlights the negative trend, generated by AI for illustrative purposes. This image is perfect for representing financial losses or economic instability.
Free with trial A 3D bar graph with a red line graph indicating a significant decrease, isolated on a clean white background. Decrease crash illustrations Bar graph showing downward trend isolated on white background. A 3D bar graph with a red line graph indicating a significant decrease, isolated on a clean white background
Free with trial Falling stock exchange prices showing a financial crisis on a digital screen. Decrease crash illustrations Stock market crash showing falling prices on digital display in trading room. Falling stock exchange prices showing a financial crisis on a digital screen
Free with trial Minimalist line icon of a money bag with a circular arrow pointing down, symbolizing a decrease in funds. Decrease crash illustrations Money bag with a circular arrow pointing down representing decreasing funds. Minimalist line icon of a money bag with a circular arrow pointing down, symbolizing a decrease in funds
Free with trial Laptop displaying a stock market graph with red and green lines indicating a downward trend in share prices. Decrease crash illustrations Laptop showing decreasing chart representing stock market crash. Laptop displaying a stock market graph with red and green lines indicating a downward trend in share prices
Free with trial Laptop displaying a stock market graph with red and green lines indicating a downward trend in share prices. Decrease crash vectors Laptop showing decreasing chart representing stock market crash. Laptop displaying a stock market graph with red and green lines indicating a downward trend in share prices
Free with trial This image shows a graph depicting a sharp market downturn, generated by AI. The downward trend is emphasized by large black arrows, illustrating a significant and rapid decline. The rolled-up paper suggests the ongoing nature of the crisis, implying further potential losses. Decrease crash illustrations Market Crash Visualization. This image shows a graph depicting a sharp market downturn, generated by AI. The downward trend is emphasized by large black arrows, illustrating a significant and rapid decline. The rolled-up paper suggests the ongoing nature of the crisis, implying further potential losses.
Free with trial This striking image depicts a sharply declining stock market graph, generated by AI. The artistic style, combining a distressed frame and ink splatters, emphasizes the volatility and uncertainty of the market downturn. The red line dramatically highlights the severity of the fall. Decrease crash illustrations Market Crash Visualization. This striking image depicts a sharply declining stock market graph, generated by AI. The artistic style, combining a distressed frame and ink splatters, emphasizes the volatility and uncertainty of the market downturn. The red line dramatically highlights the severity of the fall.
Free with trial Illustration representing the concept of economic recession with a red arrow and a money bag. Decrease crash vectors Red arrow pointing down next to money bag with dollar sign illustrating market crash. Illustration representing the concept of economic recession with a red arrow and a money bag
Free with trial This striking image depicts a downward-pointing arrow composed of fragmented red and white blocks, generated by AI. The red blocks represent a decline, while the white blocks symbolize a potential recovery or past stability. The visual metaphor powerfully conveys market instability and potential col. Decrease crash illustrations Market Crash Visualization. This striking image depicts a downward-pointing arrow composed of fragmented red and white blocks, generated by AI. The red blocks represent a decline, while the white blocks symbolize a potential recovery or past stability. The visual metaphor powerfully conveys market instability and potential col
Free with trial A man in despair grips his head as a red stock market chart plunges around him, symbolizing financial loss, crisis, and economic downturn. Dark background enhances the mood. Decrease crash illustrations Market Crash Despair: Man Grips Head Amidst Plunging Red Stock Chart. A man in despair grips his head as a red stock market chart plunges around him, symbolizing financial loss, crisis, and economic downturn. Dark background enhances the mood
Free with trial Red financial chart with a sharp downward trend indicating a market crash or economic decline. The graph features jagged, descending lines with timestamps labeled on the x-axis as 06 231 and 08 231. The dark background enhances the focus on the bright red line, making the steep drop in value evident. Occasional data points are highlighted with small glowing dots, emphasizing key moments. The overall design conveys a sense of urgency and loss in financial markets. Decrease crash illustrations Dramatic downward trend financial chart illustrating market crash, economic decline, and losses. Red financial chart with a sharp downward trend indicating a market crash or economic decline. The graph features jagged, descending lines with timestamps labeled on the x-axis as 06 231 and 08 231. The dark background enhances the focus on the bright red line, making the steep drop in value evident. Occasional data points are highlighted with small glowing dots, emphasizing key moments. The overall design conveys a sense of urgency and loss in financial markets.
Free with trial Stock exchange screen showing falling prices impacting coins, illustrating financial crisis and market crash. Decrease crash illustrations Stock market crashing, showing red numbers and falling graph on a screen with coins. Stock exchange screen showing falling prices impacting coins, illustrating financial crisis and market crash
Free with trial Laptop showing downward stock chart on screen, realistic graphic style, on white office desk background, concept of financial crisis. 3D Rendering. Decrease crash illustrations Laptop displaying falling stock market chart on office desk showing financial crisis and global market crash in business. Laptop showing downward stock chart on screen, realistic graphic style, on white office desk background, concept of financial crisis. 3D Rendering
Free with trial Man using smartphone with stock market chart overlay, holographic style, dark background. Concept of financial crisis and investment loss. Decrease crash illustrations Man holding smartphone with stock market chart overlay on dark background, showing financial crisis and market crash concept. Man using smartphone with stock market chart overlay, holographic style, dark background. Concept of financial crisis and investment loss
Free with trial Laptop screen showing downward red stock chart and yellow trend line, with dark abstract background. Concept of market crash and recession. 3D Rendering. Decrease crash illustrations Laptop displaying red and yellow falling stock chart on dark geometric background, symbolizing financial crisis and market. Laptop screen showing downward red stock chart and yellow trend line, with dark abstract background. Concept of market crash and recession. 3D Rendering
Free with trial Planet earth with stock exchange data showing falling prices, indicating a global financial crisis. Decrease crash illustrations Stock market crash affecting global economy, showing falling prices and financial crisis. Planet earth with stock exchange data showing falling prices, indicating a global financial crisis
Free with trial A bold red arrow trends downwards, symbolizing financial loss or market decline, set against a somber gradient background Perfect for illustrating business failures. Decrease crash illustrations Red Arrow Graph Symbolizing Economic Downturn or Market Crash. A bold red arrow trends downwards, symbolizing financial loss or market decline, set against a somber gradient background Perfect for illustrating business failures
Free with trial A bold red arrow trends downwards, symbolizing financial loss or market decline, set against a somber gradient background Perfect for illustrating business failures. Decrease crash illustrations Red Arrow Graph Symbolizing Economic Downturn or Market Crash. A bold red arrow trends downwards, symbolizing financial loss or market decline, set against a somber gradient background Perfect for illustrating business failures
Free with trial A three-dimensional line graph depicts a significant decrease in market value over a period of four months, indicated by a sharp downward trend. Decrease crash illustrations Sharp market value decline over time illustrated by a downward trend graph. A three-dimensional line graph depicts a significant decrease in market value over a period of four months, indicated by a sharp downward trend
Free with trial A neon pink stock market chart with a downward trend and candlestick indicators against a dark blue background, symbolizing financial loss and economic downturn. Decrease crash illustrations Neon Pink Stock Market Crash Chart with Candlesticks on Dark Blue Background. A neon pink stock market chart with a downward trend and candlestick indicators against a dark blue background, symbolizing financial loss and economic downturn
Free with trial A man in silhouette clutches his head in despair, overlaid with a red stock market crash chart, symbolizing financial loss and economic crisis. Decrease crash illustrations Financial Crisis: Silhouette of Man in Despair with Falling Stock Market Chart. A man in silhouette clutches his head in despair, overlaid with a red stock market crash chart, symbolizing financial loss and economic crisis
Free with trial This 3D rendering shows a dramatic market downturn, with collapsing bars representing a significant economic decline. The falling graph, generated by AI, visually emphasizes the severity of the drop. The scattered cubes further illustrate instability and potential loss. Decrease crash illustrations AI-Generated Market Crash Visualization. This 3D rendering shows a dramatic market downturn, with collapsing bars representing a significant economic decline. The falling graph, generated by AI, visually emphasizes the severity of the drop. The scattered cubes further illustrate instability and potential loss.
Free with trial This 3D graph, generated by AI, depicts a sharp market downturn. The red line dramatically falls, illustrating significant financial losses and economic instability. The textured background enhances the visual impact, conveying a sense of crisis. Decrease crash illustrations AI-Generated Market Crash Visualization. This 3D graph, generated by AI, depicts a sharp market downturn. The red line dramatically falls, illustrating significant financial losses and economic instability. The textured background enhances the visual impact, conveying a sense of crisis.
Free with trial A cracked wall reveals a falling stock market graph, generated by AI. This striking image symbolizes market instability and the fragility of financial systems. The red color emphasizes the severity of the downturn, while the broken wall portrays the devastating consequences. Decrease crash illustrations Market Crash: AI-Generated Visualization. A cracked wall reveals a falling stock market graph, generated by AI. This striking image symbolizes market instability and the fragility of financial systems. The red color emphasizes the severity of the downturn, while the broken wall portrays the devastating consequences.
Free with trial A 3D rendered glossy red zigzag arrow points down, symbolizing a dramatic financial crash, recession, or business failure against a dark, moody background. Decrease crash illustrations Glossy Red Zigzag Arrow Plunging Downward, Symbolizing a Sharp Financial Decline. A 3D rendered glossy red zigzag arrow points down, symbolizing a dramatic financial crash, recession, or business failure against a dark, moody background.
Free with trial An isometric view of decreasing coins isolated on a white background, representing financial loss, recession, and economic decline. Decrease crash illustrations Coins decrease isometric isolated on white background. An isometric view of decreasing coins isolated on a white background, representing financial loss, recession, and economic decline
Free with trial Abstract red and yellow candlestick chart on dark background with descending arrow, representing global financial crisis and market crash. 3D Rendering. Decrease crash illustrations Abstract background showing downward yellow arrow and red candlestick chart indicating global financial crisis and stock market. Abstract red and yellow candlestick chart on dark background with descending arrow, representing global financial crisis and market crash. 3D Rendering
Free with trial Financial chart with red and yellow candlesticks and a downward yellow arrow, on a dark background, concept of market crash and recession. 3D Rendering. Decrease crash illustrations Abstract financial chart with red and yellow candlesticks showing a downward trend and falling market data on dark background. 3D. Financial chart with red and yellow candlesticks and a downward yellow arrow, on a dark background, concept of market crash and recession. 3D Rendering
Free with trial Close up of laptop at office workplace with falling red forex candlestick chart on blurry backdrop. Global economic recession, stock market crash, inflation concept. 3D Rendering. Decrease crash illustrations Close up of laptop at office workplace with falling red forex candlestick chart on blurry backdrop. Global economic recession
Free with trial A stark warning of an impending economic crisis is conveyed by this impactful image. A prominent red, downtrending financial market chart dominates the scene, visualized on a yellow road sign for emphasis. This powerful visual symbolizes a potential market crash and financial downturn, highlighting risk and loss in business and investment. Ideal for illustrating concepts related to recession,. Decrease crash illustrations Economic crisis ahead warning sign with a red downtrending financial market chart. A stark warning of an impending economic crisis is conveyed by this impactful image. A prominent red, downtrending financial market chart dominates the scene, visualized on a yellow road sign for emphasis. This powerful visual symbolizes a potential market crash and financial downturn, highlighting risk and loss in business and investment. Ideal for illustrating concepts related to recession,
Free with trial A 3D rendered graph displays a downward trend. Two tall green bars are followed by two shorter pink bars, indicating a decrease in value. A thick yellow arrow with a sharp point descends diagonally across the bars, emphasizing the decline. The background is a solid, light blue color. Decrease crash illustrations Falling graph with green and pink bars and a yellow arrow pointing down chart decline. A 3D rendered graph displays a downward trend. Two tall green bars are followed by two shorter pink bars, indicating a decrease in value. A thick yellow arrow with a sharp point descends diagonally across the bars, emphasizing the decline. The background is a solid, light blue color
Free with trial A stark pink line graph shows a dramatic downward trend against a dark green grid, symbolizing a significant loss or decrease. Decrease crash illustrations Sharp decline illustrated by a jagged pink line graph on a dark green grid background. A stark pink line graph shows a dramatic downward trend against a dark green grid, symbolizing a significant loss or decrease
Free with trial Dark grunge illustration of a red arrow pointing down over a blurred american flag and financial bar charts representing an economic crisis, inflation, or market crash. Decrease crash illustrations United states economic recession concept with red crashing arrow. Dark grunge illustration of a red arrow pointing down over a blurred american flag and financial bar charts representing an economic crisis, inflation, or market crash
Free with trial Stacks of gold coins decrease in size as a red arrow points downwards over a stock market chart, indicating financial decline. Decrease crash illustrations Stacks of gold coins decreasing in size with a red downward arrow and stock market chart red arrow. Stacks of gold coins decrease in size as a red arrow points downwards over a stock market chart, indicating financial decline
Free with trial Red stock market ticker showing falling prices during trading session. Decrease crash illustrations Stock market crash showing falling prices during trading session. Red stock market ticker showing falling prices during trading session
Free with trial Illustration represents falling market prices. Stacks of coins against falling chart. Digital numbers. Bear market, price drop, stock market crash, financial loss crypto crash. Decrease crash illustrations Illustration represents falling market prices. Stacks of coins against falling chart. Digital numbers. Bear market, price drop
Free with trial A vibrant red arrow zigzags downward against a stark white background The arrow's sharp angles create a dynamic visual representation of a negative trend. The image is clean and simple. Decrease crash illustrations Red Zigzag Arrow Downward Trending Graphic White Background Sharp Angles Decline Decrease Fall. A vibrant red arrow zigzags downward against a stark white background The arrow's sharp angles create a dynamic visual representation of a negative trend. The image is clean and simple
Free with trial A man's hand in a white shirt sleeve is holding a jagged red arrow pointing downward, representing a drop or decline. The arrow appears three-dimensional and zigzags as it moves lower. Set against a clean white background, the image conveys concepts such as financial loss, market crash, business downturn, or economic crisis. Image created with AI. Decrease crash illustrations Businessman hand holding red descending arrow symbolizing economic decline or financial loss. A man's hand in a white shirt sleeve is holding a jagged red arrow pointing downward, representing a drop or decline. The arrow appears three-dimensional and zigzags as it moves lower. Set against a clean white background, the image conveys concepts such as financial loss, market crash, business downturn, or economic crisis. Image created with AI.
Free with trial A red stock market chart declines sharply against a blurred dark city background. This image illustrates a financial crisis and economic downturn, showing a dramatic fall in market values. Decrease crash illustrations Red stock market crash with bar chart and blurred city background depicting financial decline. A red stock market chart declines sharply against a blurred dark city background. This image illustrates a financial crisis and economic downturn, showing a dramatic fall in market values
Free with trial This powerful visual concept depicts a devastating financial crisis and economic downturn. Symbolic wooden blocks, including a crumbling bank structure, represent bank failure and the ensuing recession. A cracked block and a falling arrow down highlight the downward trend and potential for loss in the stock market crash. Ideal for illustrating themes of investment risk, debt, finance, business. Decrease crash illustrations Financial crisis concept illustrating bank failure and economic decline with symbolic blocks. This powerful visual concept depicts a devastating financial crisis and economic downturn. Symbolic wooden blocks, including a crumbling bank structure, represent bank failure and the ensuing recession. A cracked block and a falling arrow down highlight the downward trend and potential for loss in the stock market crash. Ideal for illustrating themes of investment risk, debt, finance, business
Free with trial Red glossy 3d arrow going down stock icon on white background. Bankruptcy, financial market crash icon for your web site design, logo, app, UI. graph chart downtrend symbol. chart going down sign. Decrease crash vectors Red glossy 3d arrow going down stock icon on white background. Bankruptcy, financial market crash icon for your web site design
Free with trial Three stacks of gold coins are arranged from tallest to shortest on a plain pink background. A large, bold red arrow points diagonally downwards, indicating a decrease or loss. The visual represents a financial or economic downturn. Decrease crash illustrations Stacks of Gold Coins Decreasing in Height with a Red Arrow Pointing Downward on a Pink Background. Three stacks of gold coins are arranged from tallest to shortest on a plain pink background. A large, bold red arrow points diagonally downwards, indicating a decrease or loss. The visual represents a financial or economic downturn
Free with trial Stock market trading technical analysis bar chart fall. Business candlestick graph exchange down trend. Crisis economy and investment loss graph. Trader financial index crash concept. Eps banner. Decrease crash vectors Stock market trading technical analysis bar chart fall. Business candlestick graph exchange down trend. Crisis economy
Free with trial Stock market trading technical analysis bar chart fall. Business candlestick graph exchange down trend. Crisis economy and investment loss graph. Trader financial index crash concept. Black background. Decrease crash vectors Stock market trading technical analysis bar chart fall. Business candlestick graph exchange down trend. Crisis economy
Free with trial Stock market trading technical analysis bar chart fall. Business candlestick graph exchange down trend. Crisis economy and investment loss graph. Trader financial index crash concept. Money losing eps. Decrease crash vectors Stock market trading technical analysis bar chart fall. Business candlestick graph exchange down trend. Crisis economy
Free with trial Composite trend artwork sketch image photo collage of sale black friday shopping worker hold hammer crash usd symbol dollar crisis loss. Decrease crash illustrations Composite trend artwork sketch image photo collage of sale black friday shopping worker hold hammer crash usd symbol
Free with trial Stock market trading technical analysis bar chart fall. Business exchange graph downtrend. Crisis economy and investment loss graph. Trader financial index crash concept. Eps banner dark background. Decrease crash vectors Stock market trading technical analysis bar chart fall. Business exchange graph downtrend. Crisis economy and investment
Free with trial Reduction chart icon Black line art vector in black and white outline set collection sign. Decrease crash vectors Decline Chart Icon Illustrating Decrease in Performance, Economic Downturn, and Analytical Data. Reduction chart icon Black line art vector in black and white outline set collection sign
Free with trial A golden dollar coin with a blue downward arrow symbolizes financial loss or economic downturn. It represents a decrease in value, investment risk, and potential recession in the market. Decrease crash vectors A golden dollar coin with a downward pointing blue arrow indicating a loss or economic downturn situation. A golden dollar coin with a blue downward arrow symbolizes financial loss or economic downturn. It represents a decrease in value, investment risk, and potential recession in the market.
Free with trial This dynamic 3D visualization showcases a dramatic downward trend, depicted by numerous red arrows pointing downwards. The graphic effectively illustrates a decline in various economic indicators, such as stock market performance, negative growth, and business loss. The intense red color strongly emphasizes the negative impact, suggesting a potential stock market crash, a significant economic. Decrease crash illustrations 3D Rendered Red Arrow Graph Visualizing a Downward Trend in Financial Markets and Business Performance. This dynamic 3D visualization showcases a dramatic downward trend, depicted by numerous red arrows pointing downwards. The graphic effectively illustrates a decline in various economic indicators, such as stock market performance, negative growth, and business loss. The intense red color strongly emphasizes the negative impact, suggesting a potential stock market crash, a significant economic
Free with trial Illustrating a financial downturn with descending blocks. The image conveys a sense of economic decline, investment risk, and potential market instability. A visual representation of financial loss. Decrease crash illustrations Stock market decline concept showing decrease in value and investment risk with downward trend diagram. Illustrating a financial downturn with descending blocks. The image conveys a sense of economic decline, investment risk, and potential market instability. A visual representation of financial loss.
Free with trial A stark red arrow points downwards, dramatically descending across a series of stacked white bars that resemble coins or financial data points. The bars decrease in height from left to right, visually representing a significant decline or loss. The composition is clean and isolated on a white background, emphasizing the concept of financial downturn or economic recession. Decrease crash illustrations Red Downward Arrow Graph with Stacked White Coin- Like Bars Illustrating Financial Decline on White Background. A stark red arrow points downwards, dramatically descending across a series of stacked white bars that resemble coins or financial data points. The bars decrease in height from left to right, visually representing a significant decline or loss. The composition is clean and isolated on a white background, emphasizing the concept of financial downturn or economic recession
Free with trial A dramatic image depicting a significant decline in the Chinese economy. The Chinese flag overlays a nighttime Shanghai skyline, with a large red arrow dramatically pointing downwards, superimposed on a falling stock market graph. This image is ideal for illustrating economic news, financial reports, and articles about market volatility and global economic trends. Decrease crash illustrations China Economic Downturn: Stock Market Crash and Shanghai Skyline. A dramatic image depicting a significant decline in the Chinese economy. The Chinese flag overlays a nighttime Shanghai skyline, with a large red arrow dramatically pointing downwards, superimposed on a falling stock market graph. This image is ideal for illustrating economic news, financial reports, and articles about market volatility and global economic trends.
Free with trial A visual representation of a stock market crash or economic recession, featuring a downward trending graph and red color scheme. Illustrates financial loss and business crisis in the market. Decrease crash illustrations Stock market crash recession graph chart business finance investment economy crisis downtrend loss falling. A visual representation of a stock market crash or economic recession, featuring a downward trending graph and red color scheme. Illustrates financial loss and business crisis in the market.
Free with trial A visual representation of a financial downturn. The red graph and arrows symbolize market decline, economic recession, and potential business failure, highlighting investment risks and negative trends. Decrease crash illustrations Red graph chart falling down financial crisis stock market crash economic recession business failure concept. A visual representation of a financial downturn. The red graph and arrows symbolize market decline, economic recession, and potential business failure, highlighting investment risks and negative trends.
Free with trial Illustration of economic crisis, financial background. Stacks gold coins, US dollars with falling financial graph chart, global economic recession. Stock market crash, investment risk. Decrease crash illustrations Illustration of economic crisis, financial background. Stacks gold coins, US dollars with falling financial graph chart, global
Free with trial Vector illustration symbolizing conflict, trade war, or economic crisis between the USA and China. The US and Chinese flags clash on background financial candlestick chart. Concept represents political tension, economic downturn, recession, stock market crash, or financial instability related to US-China relations and global markets. Decrease crash vectors Concept of trade war or economic crisis in US-China relations. Vector illustration symbolizing conflict, trade war, or economic crisis between the USA and China. The US and Chinese flags clash on background financial candlestick chart. Concept represents political tension, economic downturn, recession, stock market crash, or financial instability related to US-China relations and global markets.
Free with trial A stark image depicting the perilous decline of financial markets. A red arrow, plummeting towards a scattering of coins on a rustic wooden table, symbolizes the devastating impact of a market crash. This visual metaphor effectively captures the loss of wealth and investment value during an economic downturn. The image represents a crucial juncture in the financial landscape, highlighting the. Decrease crash illustrations Financial Market Downturn Red Arrow Plunging Towards Coins on Wooden Table A Visual Representation of Investment Loss. A stark image depicting the perilous decline of financial markets. A red arrow, plummeting towards a scattering of coins on a rustic wooden table, symbolizes the devastating impact of a market crash. This visual metaphor effectively captures the loss of wealth and investment value during an economic downturn. The image represents a crucial juncture in the financial landscape, highlighting the
Free with trial Bear represents falling stock market on red chart background. Financial graph shows investment loss, price decrease. Bearish concept symbolizes economic recession, downturn global. Decrease crash illustrations Bear represents falling stock market on red chart background. Financial graph shows investment loss, price decrease. Bearish
Free with trial Illustration of dejected penguin observing red arrow pointing down on chart, symbolizing financial crisis. Economic downturn concept includes market decrease, trading loss investment. Decrease crash illustrations Illustration of dejected penguin observing red arrow pointing down on chart, symbolizing financial crisis. Economic downturn
Free with trial Red arrow graph indicates stock market decline, real estate downturn, financial loss. 3d illustration visualizes business concept of negative progress, sale reduction, profit decrease. Decrease crash illustrations Red arrow graph indicates stock market decline, real estate downturn, financial loss. 3d illustration visualizes business concept