Free with trial Economic critical crisis concept. The red lower arrow and graph icons on white background. Recession financial, cryptocurrency, gold, and the stock market. Losing money and cash. Bearish. Decrease crash vectors Economic critical crisis concept. The red lower arrow and graph icons on white background. Recession financial, cryptocurrency
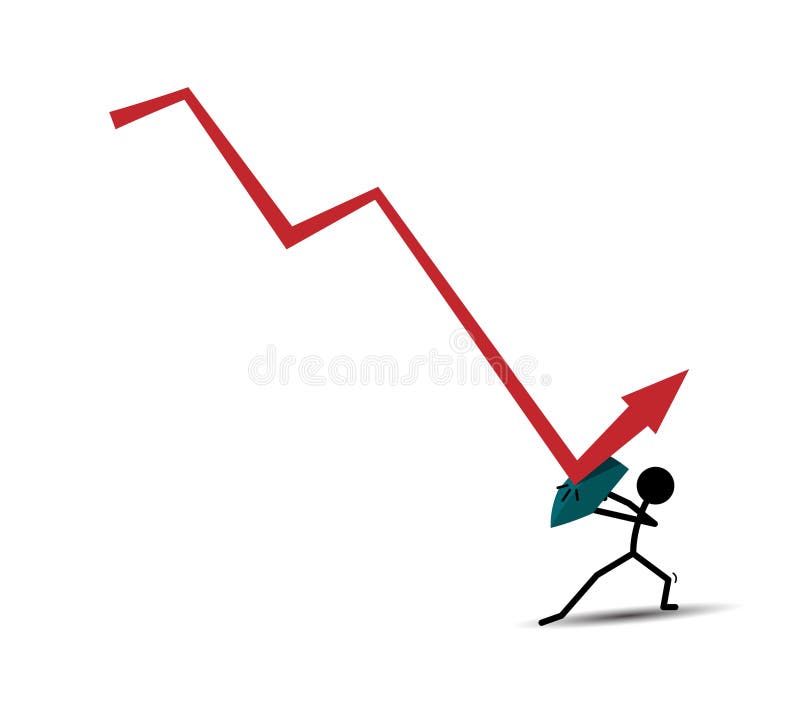
Free with trial Businessman watches red graph fall steeply. Economic crisis, sales drop sharply business faces severe risks. Financial downturn worries executive. Company decline. Decrease crash illustrations Businessman watches red graph fall steeply. Economic crisis, sales drop sharply, business faces severe risks. Financial downturn. Businessman watches red graph fall steeply. Economic crisis, sales drop sharply business faces severe risks. Financial downturn worries executive. Company decline.
Free with trial Red wooden arrow pointing down on black background. Business, market decline or economic challenges concept. Flat lay. Top view. Close-up. Decrease crash illustrations Red wooden arrow pointing down on black background. Business, market decline or economic
Free with trial Economic critical crisis concept. The drop down arrow and bar chart on red background. Recession financial, cryptocurrency, gold, and the stock market. Losing money and cash. Bearish. Decrease crash vectors Economic critical crisis concept. The drop down arrow and bar chart on red background. Recession financial, cryptocurrency, gold
Free with trial This compelling stock image showcases a stark red arrow pointing downwards, a powerful visual representation of decline. The minimalist design focuses solely on the downward trend, making the message of negative movement immediately apparent. Perfect for conveying a range of concepts, from a downturn in business performance to a falling market share or a project that's fallen behind schedule. Decrease crash illustrations Visualizing Declining Trends A Minimalist Stock Photo of a Dramatic Red Arrow Down Illustrating Business Performance. This compelling stock image showcases a stark red arrow pointing downwards, a powerful visual representation of decline. The minimalist design focuses solely on the downward trend, making the message of negative movement immediately apparent. Perfect for conveying a range of concepts, from a downturn in business performance to a falling market share or a project that's fallen behind schedule.
Free with trial Business graph with falling down arrow loss finance animation, city background. Decrease crash illustrations Business graph with falling down arrow loss finance animation, city background
Free with trial Business graph with falling down arrow loss finance animation, city background. Decrease crash illustrations Business graph with falling down arrow loss finance animation, city background
Free with trial Business graph with falling down arrow loss finance animation, city background. Decrease crash illustrations Business graph with falling down arrow loss finance animation, city background
Free with trial Business graph with falling down arrow loss finance animation, city background. Decrease crash illustrations Business graph with falling down arrow loss finance animation, city background
Free with trial Economic critical crisis concept. The lower line graph and bar chart on red background. Recession financial, cryptocurrency, gold, and the stock market. Losing money and cash. Bearish. Decrease crash vectors Economic critical crisis concept. The lower line graph and bar chart on red background. Recession financial, cryptocurrency, gold
Free with trial Inflation graph shows rising costs. Recession question mark graph indicates economic decline. Concepts of market fluctuation, financial crisis and budget challenges. Decrease crash illustrations Inflation graph shows rising costs. Recession question mark graph indicates economic decline. Concepts of market fluctuation
Free with trial Black and white descending graph diagram. loss or decline. flat design style. Suitable for use in reports, illustrations, presentations, etc. vector design template. Decrease crash vectors Black and white descending graph diagram. loss or decline. flat design style. Suitable for use in reports, illustrations
Free with trial Red wooden arrow points down on yellow background. Business, market decline. Indicates economic recession, financial loss, investment risk. Shows negative trends, bankruptcy. Useful for. Decrease crash illustrations Red wooden arrow points down on yellow background. Business, market decline. Indicates economic recession, financial loss
Free with trial Set Credit card, Broken piggy bank, Drop in crude oil price, Global economic crisis and Shutdown of factory icon. Vector. Decrease crash vectors Set Credit card, Broken piggy bank, Drop in crude oil price, Global economic crisis and Shutdown of factory icon. Vector
Free with trial Red stock chart with values sharply declining, highlighting financial crisis economic recession. Dramatic fall in market values is emphasized against dark background. Business and. Decrease crash illustrations Red stock chart with values sharply declining, highlighting financial crisis, economic recession. Dramatic fall in market values. Red stock chart with values sharply declining, highlighting financial crisis economic recession. Dramatic fall in market values is emphasized against dark background. Business and.
Free with trial Red declining stock market chart displayed over a digital world map. Numerous downward arrows emphasize financial downturn. The world map features continents in a dotted digital design. The vivid red suggests market instability and economic crisis. The chart's steep decline with arrows originating from various locations symbolizes global economic impact. The background is dark, highlighting the stark contrast and severity of the financial situation depicted. Decrease crash illustrations Global economic crisis concept with a red declining stock market chart and arrows pointing down over a digital world map. Red declining stock market chart displayed over a digital world map. Numerous downward arrows emphasize financial downturn. The world map features continents in a dotted digital design. The vivid red suggests market instability and economic crisis. The chart's steep decline with arrows originating from various locations symbolizes global economic impact. The background is dark, highlighting the stark contrast and severity of the financial situation depicted.
Free with trial Glowing neon line Global economic crisis news icon isolated on brick wall background. World finance crisis. Vector. Decrease crash illustrations Glowing neon line Global economic crisis news icon isolated on brick wall background. World finance crisis. Vector
Free with trial Red arrow pointing downward on financial spreadsheet. Magnifying glass focuses on economic decline trend. No people. Business recession. Analyzing financial data. Spreadsheet with. Decrease crash illustrations Red arrow pointing downward on financial spreadsheet. Magnifying glass focuses on economic decline trend. No people. Business
Free with trial Miniature shopping cart with red upward trending arrow declining retail sales, negative economic trends. Conceptual image represents falling consumer spending, market downturn financial. Decrease crash illustrations Miniature shopping cart with red upward trending arrow declining retail sales, negative economic trends. Conceptual image
Free with trial Economic downturn with falling red arrow and bearish stock market trend concept. Generative AI. Decrease crash illustrations Economic downturn with falling red arrow and bearish stock market trend concept
Free with trial Colorful Property and housing market collapse icon isolated on white background. Falling property prices. Real estate stock risk or economic recession. Square button. 3D render illustration. Decrease crash illustrations Colorful Property and housing market collapse icon isolated on white background. Falling property prices. Real estate
Free with trial Colorful Property and housing market collapse icon isolated on white background. Falling property prices. Real estate stock risk or economic recession. Minimalism concept. 3D render illustration. Decrease crash illustrations Colorful Property and housing market collapse icon isolated on white background. Falling property prices. Real estate
Free with trial Red wooden arrow points down on black background. Symbolizes business, market decline or economic crisis. Concept for bad debt, bankruptcy, diagram, investment loss and negative. Decrease crash illustrations Red wooden arrow points down on black background. Symbolizes business, market decline or economic crisis. Concept for bad debt
Free with trial Money Loss, risk line flat icon for mobile application, button and website design. Illustration isolated on white background illustration. Decrease crash illustrations Money Loss, risk line flat icon for mobile application, button and website design. Illustration isolated on white background
Free with trial This 3d image of a floating golden dollar coin over a falling arrow shows flying signs of financial loss value drop and market downturn in a modern clean economic concept. Decrease crash illustrations A floating dollar coin with a downward arrow represents flying financial signs of loss decline and economic downfall in 3d. this 3d image of a floating golden dollar coin over a falling arrow shows flying signs of financial loss value drop and market downturn in a modern clean economic concept
Free with trial This 3d illustration of a floating dollar coin with a flying downward arrow line represents signs of market decline loss in value and financial downturn in a visual economic concept. Decrease crash illustrations A floating dollar coin with a purple down arrow shows flying signs of financial loss and currency devaluation in 3d design. this 3d illustration of a floating dollar coin with a flying downward arrow line represents signs of market decline loss in value and financial downturn in a visual economic concept
Free with trial That US economy is changing the trend and goes up instead of down (or vice versa). 3D rendering on blue background. Decrease crash illustrations That US economy is changing the trend and goes up instead of down (or vice versa).
Free with trial That US economy is changing the trend and goes up instead of down (or vice versa). 3D rendering on green background. Decrease crash illustrations That US economy is changing the trend and goes up instead of down (or vice versa).
Free with trial That US economy is changing the trend and goes up instead of down (or vice versa). 3D rendering on wooden background. Decrease crash illustrations That US economy is changing the trend and goes up instead of down (or vice versa).
Free with trial That US economy is changing the trend and goes up instead of down (or vice versa). 3D rendering on green background. Decrease crash illustrations That US economy is changing the trend and goes up instead of down (or vice versa).
Free with trial That US economy is changing the trend and goes up instead of down (or vice versa). 3D rendering on red background. Decrease crash illustrations That US economy is changing the trend and goes up instead of down (or vice versa).
Free with trial That US economy is changing the trend and goes up instead of down (or vice versa). 3D rendering on orange background. Decrease crash illustrations That US economy is changing the trend and goes up instead of down (or vice versa).
Free with trial That US economy is changing the trend and goes up instead of down (or vice versa). 3D rendering on yellow background. Decrease crash illustrations That US economy is changing the trend and goes up instead of down (or vice versa).
Free with trial That US economy is changing the trend and goes up instead of down (or vice versa). 3D rendering on orange background. Decrease crash illustrations That US economy is changing the trend and goes up instead of down (or vice versa).
Free with trial That US economy is changing the trend and goes up instead of down (or vice versa). 3D rendering on red background. Decrease crash illustrations That US economy is changing the trend and goes up instead of down (or vice versa).
Free with trial That US economy is changing the trend and goes up instead of down (or vice versa). Supports PNG files with transparent backgrounds. Decrease crash vectors That US economy is changing the trend and goes up instead of down (or vice versa)
Free with trial That US economy is changing the trend and goes up instead of down (or vice versa). 3D rendering on gold background. Decrease crash illustrations That US economy is changing the trend and goes up instead of down (or vice versa).
Free with trial Economic downturn in 2025 chart down candle stick bearish stock crypto market prediction vector. Decrease crash vectors Economic downturn in 2025 chart down candle stick bearish stock crypto market prediction
Free with trial Falling economy. Vector illustration. The falling economy metaphor illustrates challenges and difficulties associated with economic decline A fall in economy poses problems for businesses. Decrease crash vectors Falling economy. The falling economy metaphor illustrates challenges and difficulties associated with economic decline. Falling economy. Vector illustration. The falling economy metaphor illustrates challenges and difficulties associated with economic decline A fall in economy poses problems for businesses
Free with trial Illustration of a graphic diagram going down and being reflected by a shield. . loss or decline. flat design style. Suitable for use in reports, illustrations, presentations, etc. vector design template. Decrease crash vectors Illustration of a graphic diagram going down and being reflected by a shield. . loss or decline. flat design style. Suitable for
Free with trial Economic crisis and recession concept. Notes 2026 with a downward arrow and money with coins. Bankruptcy and financial crisis. Analysis and analytics. Capital outflow. GDP. Forecasting. Decrease crash illustrations Economic crisis and recession concept. Notes 2026 with a downward arrow and money with coins.
Free with trial Economic crisis and recession concept. Notes 2026 with a downward arrow and money with coins. Bankruptcy and financial crisis. Analysis and analytics. Capital outflow. GDP. Forecasting. Decrease crash illustrations Economic crisis and recession concept. Notes 2026 with a downward arrow and money with coins.
Free with trial Economic crisis and recession concept. Notes 2026 with a downward arrow and money with coins. Bankruptcy and financial crisis. Analysis and analytics. Capital outflow. GDP. Forecasting. Decrease crash illustrations Economic crisis and recession concept. Notes 2026 with a downward arrow and money with coins.
Free with trial Economic crisis and recession concept. Notes 2026 with a downward arrow and money with coins. Bankruptcy and financial crisis. Analysis and analytics. Capital outflow. GDP. Forecasting. Decrease crash illustrations Economic crisis and recession concept. Notes 2026 with a downward arrow and money with coins.
Free with trial Economic crisis and recession concept. Notes 2026 with a downward arrow and money with coins. Bankruptcy and financial crisis. Analysis and analytics. Capital outflow. GDP. Forecasting. Decrease crash illustrations Economic crisis and recession concept. Notes 2026 with a downward arrow and money with coins.
Free with trial A vivid red graph with descending lines, illuminated arrows, and vibrant data points illustrating a sharp fall in digital investment performance, capturing economic uncertainty. Decrease crash illustrations Digital financial market decline depicted by red downward-trending stock chart with glowing arrows and data visualization. A vivid red graph with descending lines, illuminated arrows, and vibrant data points illustrating a sharp fall in digital investment performance, capturing economic uncertainty
Free with trial Colorful Global economic crisis icon isolated on white background. World finance crisis. Minimalism concept. 3D render illustration. Decrease crash illustrations Colorful Global economic crisis icon isolated on white background. World finance crisis. Minimalism concept. 3D render
Free with trial Financial crisis. Disappointed person showing empty pockets. Market fall, cart showing arrow going down. Economy collapse concept. Employee without money, poverty vector illustration. Decrease crash vectors Financial crisis. Disappointed person showing empty pockets. Market fall, cart showing arrow going down. Economy collapse concept
Free with trial Financial crisis. Disappointed person showing empty pockets. Market fall, cart showing arrow going down. Economy collapse concept. Employee without money, poverty vector illustration. Decrease crash vectors Financial crisis. Disappointed person showing empty pockets. Market fall, cart showing arrow going down. Economy collapse concept
Free with trial Economic critical crisis concept. The down arrow on red world map background. Recession financial, cryptocurrency, gold, and the stock market. Losing money and cash. Bearish. Decrease crash vectors Economic critical crisis concept. The down arrow on red world map background. Recession financial, cryptocurrency, gold, and the
Free with trial Close up view of red falling bar chart with laptop and potted plant in background. It represents financial crisis downturn risk and business failure in market. Investment analytics. Decrease crash illustrations Close up view of red falling bar chart with laptop and potted plant in background. It represents financial crisis downturn risk
Free with trial Illustration shows inflation ball breaking through cracked American flag. Concept represents economic crisis, financial problems in USA. Business concept about money markets and finance. Decrease crash illustrations Illustration shows inflation ball breaking through cracked American flag. Concept represents economic crisis, financial problems
Free with trial Red wooden arrow pointing down on white background. Business, market decline or economic. Close-up. Decrease crash illustrations Red wooden arrow pointing down on white background. Business, market decline or economic
Free with trial Red wooden arrow pointing down on white background. Business, market decline or economic. Close-up. Decrease crash illustrations Red wooden arrow pointing down on white background. Business, market decline or economic
Free with trial Red wooden arrow pointing down on white background. Business, market decline or economic. Close-up. Decrease crash illustrations Red wooden arrow pointing down on white background. Business, market decline or economic
Free with trial Red wooden arrow pointing down on white background. Business, market decline or economic. Close-up. Decrease crash illustrations Red wooden arrow pointing down on white background. Business, market decline or economic
Free with trial Red wooden arrow pointing down on white background. Business, market decline or economic. Close-up. Decrease crash illustrations Red wooden arrow pointing down on white background. Business, market decline or economic
Free with trial Red wooden arrow pointing down on black background. Business, market decline or economic. Close-up. Decrease crash illustrations Red wooden arrow pointing down on black background. Business, market decline or economic
Free with trial Red wooden arrow pointing down on black background. Business, market decline or economic challenges concept. Flat lay. Top view. Close-up. Decrease crash illustrations Red wooden arrow pointing down on black background. Business, market decline or economic
Free with trial Red wooden arrow pointing down on black background. Business, market decline or economic challenges concept. Flat lay. Top view. Close-up. Decrease crash illustrations Red wooden arrow pointing down on black background. Business, market decline or economic
Free with trial Red wooden arrow pointing down on black background. Business, market decline or economic challenges concept. Flat lay. Top view. Close-up. Decrease crash illustrations Red wooden arrow pointing down on black background. Business, market decline or economic
Free with trial Red wooden arrow pointing down on black background. Business, market decline or economic challenges concept. Flat lay. Top view. Close-up. Decrease crash illustrations Red wooden arrow pointing down on black background. Business, market decline or economic
Free with trial Red wooden arrow pointing down on black background. Business, market decline or economic challenges concept. Flat lay. Top view. Close-up. Decrease crash illustrations Red wooden arrow pointing down on black background. Business, market decline or economic
Free with trial Red wooden arrow pointing down on black background. Business, market decline or economic challenges concept. Flat lay. Top view. Close-up. Decrease crash illustrations Red wooden arrow pointing down on black background. Business, market decline or economic
Free with trial White wooden arrow pointing down on red background. Business, market decline or economic. Close-up. Decrease crash illustrations White wooden arrow pointing down on red background. Business, market decline or economic
Free with trial White wooden arrow pointing down on red background. Business, market decline or economic. Close-up. Decrease crash illustrations White wooden arrow pointing down on red background. Business, market decline or economic
Free with trial White wooden arrow pointing down on red background. Business, market decline or economic. Close-up. Decrease crash illustrations White wooden arrow pointing down on red background. Business, market decline or economic
Free with trial Red wooden arrow pointing down on white background. Business, market decline or economic. Close-up. Decrease crash illustrations Red wooden arrow pointing down on white background. Business, market decline or economic
Free with trial Red wooden arrow pointing down on white background. Business, market decline or economic. Close-up. Decrease crash illustrations Red wooden arrow pointing down on white background. Business, market decline or economic
Free with trial Red wooden arrow pointing down on white background. Business, market decline or economic. Close-up. Decrease crash illustrations Red wooden arrow pointing down on white background. Business, market decline or economic
Free with trial Red wooden arrow pointing down on white background. Business, market decline or economic. Close-up. Decrease crash illustrations Red wooden arrow pointing down on white background. Business, market decline or economic
Free with trial Red wooden arrow pointing down on white background. Business, market decline or economic. Close-up. Decrease crash illustrations Red wooden arrow pointing down on white background. Business, market decline or economic
Free with trial Red wooden arrow pointing down on black background. Business, market decline or economic. Close-up. Decrease crash illustrations Red wooden arrow pointing down on black background. Business, market decline or economic
Free with trial Red wooden arrow pointing down on white background. Business, market decline or economic. Close-up. Decrease crash illustrations Red wooden arrow pointing down on white background. Business, market decline or economic
Free with trial Red wooden arrow pointing down on white background. Business, market decline or economic. Close-up. Decrease crash illustrations Red wooden arrow pointing down on white background. Business, market decline or economic
Free with trial Red wooden arrow pointing down on white background. Business, market decline or economic. Close-up. Decrease crash illustrations Red wooden arrow pointing down on white background. Business, market decline or economic
Free with trial Red wooden arrow pointing down on white background. Business, market decline or economic. Close-up. Decrease crash illustrations Red wooden arrow pointing down on white background. Business, market decline or economic
Free with trial Red wooden arrow pointing down on white background. Business, market decline or economic. Close-up. Decrease crash illustrations Red wooden arrow pointing down on white background. Business, market decline or economic
Free with trial Red wooden arrow pointing down on white background. Business, market decline or economic. Close-up. Decrease crash illustrations Red wooden arrow pointing down on white background. Business, market decline or economic