Free with trial A vibrant red 3D bar chart on a white background shows a steady, dramatic decline, symbolizing financial loss, recession, or negative business results. Decrease crash illustrations Stark Red 3D Bar Graph Descending Sharply, Isolated on White. A vibrant red 3D bar chart on a white background shows a steady, dramatic decline, symbolizing financial loss, recession, or negative business results.
Free with trial Illustration of a businessman holding his head in frustration as he stands amidst fluctuating financial charts and flying money and coins. Represents financial stress, market volatility, and economic challenges. Decrease crash illustrations Stressed businessman surrounded by fluctuating financial charts, money, and coins. Illustration of a businessman holding his head in frustration as he stands amidst fluctuating financial charts and flying money and coins. Represents financial stress, market volatility, and economic challenges.
Free with trial A glossy 3D red arrow with a jagged, lightning-bolt shape plunges downward, casting a soft shadow on a dark, spotlit background. A powerful symbol of crisis and decline. Decrease crash illustrations Glossy Red Jagged Arrow Plunging Downward on a Dark, Spotlit Background. A glossy 3D red arrow with a jagged, lightning-bolt shape plunges downward, casting a soft shadow on a dark, spotlit background. A powerful symbol of crisis and decline.
Free with trial Stacks of gold and silver coins are arranged on a light gray surface. A metallic silver arrow, forming an upward trend graph, emerges from the center of the composition, pointing upwards and to the right. The coins have ribbed edges and reflect light, creating a sense of value and financial movement. Decrease crash illustrations Gold and silver coins with upward trend arrow gold coins. Stacks of gold and silver coins are arranged on a light gray surface. A metallic silver arrow, forming an upward trend graph, emerges from the center of the composition, pointing upwards and to the right. The coins have ribbed edges and reflect light, creating a sense of value and financial movement
Free with trial A 3D render of a bar chart displaying a significant downward trend. Blue bars of varying heights represent data points, intersected by a sharp orange line that clearly illustrates a decline over time. The dark, reflective surface below the chart suggests a digital display or a futuristic interface. This image is ideal for representing financial losses, market crashes, performance decline, or negative trends in various industries. Decrease crash illustrations Downtrending Bar Chart with Orange Line on Dark Background. A 3D render of a bar chart displaying a significant downward trend. Blue bars of varying heights represent data points, intersected by a sharp orange line that clearly illustrates a decline over time. The dark, reflective surface below the chart suggests a digital display or a futuristic interface. This image is ideal for representing financial losses, market crashes, performance decline, or negative trends in various industries.
Free with trial Illustration showing stacks of coins decreasing in height with a downward trending yellow arrow on a teal background. Image. Decrease crash illustrations Declining Stacks of Coins Below Downward Arrow Illustration. Illustration showing stacks of coins decreasing in height with a downward trending yellow arrow on a teal background. Image
Free with trial Concrete percentage symbol with arrow pointing down, atop a pile of rocks, against a cloudy sky. Muted, desaturated colors. Image. Decrease crash illustrations Concrete Percentage Symbol with Downward Arrow on Rock Pile. Concrete percentage symbol with arrow pointing down, atop a pile of rocks, against a cloudy sky. Muted, desaturated colors. Image
Free with trial A downward trending graph chart isolated on a white background, perfect for financial analysis. Decrease crash illustrations Downward graph chart. A downward trending graph chart isolated on a white background, perfect for financial analysis
Free with trial Red arrow pointing down with a stock market graph and SELL labels, representing financial market decline and economic downturn. Concept of investment loss and crisis. Decrease crash illustrations Red arrow pointing down on stock market graph with sell labels. Red arrow pointing down with a stock market graph and SELL labels, representing financial market decline and economic downturn. Concept of investment loss and crisis
Free with trial Purple downward arrow against background of broken old computers. Decreasing market trend for outdated technology. Graph showing recession and fall. Decrease crash illustrations Purple downward arrow against background of broken old computers
Free with trial Businessman showing graph falling down, geometric pattern. Decrease crash illustrations Falling down of economic activity, geometric pattern. Businessman showing graph falling down, geometric pattern
Free with trial Red bar graph decreasing with blue arrow representing a loss in business, sales, jobs, or other financial loss. Decrease crash vectors Red bar graph decreasing with blue arrow representing a loss in business
Free with trial Sharp downward trend line on graph red color freefall market Suitable for digital platforms. Decrease crash illustrations Sharp downward trend line on graph, red color, freefall, market. Sharp downward trend line on graph red color freefall market Suitable for digital platforms
Free with trial Set of economic crisis icons. Thin linear style icons Pack. Vector Illustration Outline icons collection. Decrease crash vectors Set of economic crisis icons. Thin linear style icons Pack. Vector Illustration
Free with trial A whiteboard displays a hand-drawn graph depicting a sharp downward trend in a market or economic indicator. Red markers highlight significant drops, illustrating a period of substantial decline. The graph suggests a potential crisis or recession. Decrease crash illustrations Declining Market Trend. A whiteboard displays a hand-drawn graph depicting a sharp downward trend in a market or economic indicator. Red markers highlight significant drops, illustrating a period of substantial decline. The graph suggests a potential crisis or recession.
Free with trial A hand manipulates a red arrow pointing downwards, superimposed on a bar graph, illustrating a market downturn. This image, generated by AI, symbolizes economic recession, financial crisis, or business failure, showcasing the impact of negative trends. Decrease crash illustrations Declining Market Trend. A hand manipulates a red arrow pointing downwards, superimposed on a bar graph, illustrating a market downturn. This image, generated by AI, symbolizes economic recession, financial crisis, or business failure, showcasing the impact of negative trends.
Free with trial Financial business concept going bankrupt flat vector design. design vector illustration. Decrease crash vectors Finance flat concept going bankrupt vector design illustration. financial business concept going bankrupt flat vector design.design vector illustration
Free with trial This 3D rendering shows a downward trending graph, illustrating a market decline. The red arrows and translucent grid highlight the severity of the fall, generated by AI for visual representation of economic downturn. Decrease crash illustrations Declining Market Trend. This 3D rendering shows a downward trending graph, illustrating a market decline. The red arrows and translucent grid highlight the severity of the fall, generated by AI for visual representation of economic downturn.
Free with trial Green bar chart showing a downward trend with a down arrow graphic. Decrease crash vectors Green bar chart showing a downward trend with a down arrow graphic
Free with trial This is an illustration of an arrow pointing down to the right (down mark). Decrease crash vectors Illustration of a downward arrow (down mark) on the right shoulder. This is an illustration of an arrow pointing down to the right (down mark).
Free with trial Generative ai, The image shows a red graph with a large red arrow pointing down, indicating a decline in value. Decrease crash illustrations A red arrow pointing downwards over a red grid chart with red bars on the. generative ai, The image shows a red graph with a large red arrow pointing down, indicating a decline in value
Free with trial Stock exchange prices falling during trading on the nasdaq, indicating a financial crisis. Decrease crash illustrations Nasdaq stock market crashing, showing a financial crisis with falling prices. Stock exchange prices falling during trading on the nasdaq, indicating a financial crisis
Free with trial Falling red arrows intersect with a black digital display board showing financial information, creating a dramatic and concerning mood ideal for illustrating market decline or economic downturn. Decrease crash illustrations Red Arrows Indicating Falling Prices on Digital Display Board. Falling red arrows intersect with a black digital display board showing financial information, creating a dramatic and concerning mood ideal for illustrating market decline or economic downturn
Free with trial Financial recession diagram and downtown background image, Business decrease 3d illustration wallpaper picture backdrop. Market crash concept for business presentation corporate. Decrease crash illustrations Financial recession diagram and downtown background image, ai generated. Financial recession diagram and downtown background image, Business decrease 3d illustration wallpaper picture backdrop. Market crash concept for business presentation corporate
Free with trial Money coin research falling infographic doodle icon sketch vector. money coin research falling infographic sign. isolated symbol illustration. Decrease crash vectors Money coin research falling infographic icon doodle illustration. money coin research falling infographic doodle icon sketch vector. money coin research falling infographic sign. isolated symbol illustration
Free with trial A visual representation of negative financial performance, illustrating a declining trend in business or market data with a prominent red arrow indicating a downward movement. Decrease crash illustrations Bar chart showing a downward trend with a red arrow. A visual representation of negative financial performance, illustrating a declining trend in business or market data with a prominent red arrow indicating a downward movement
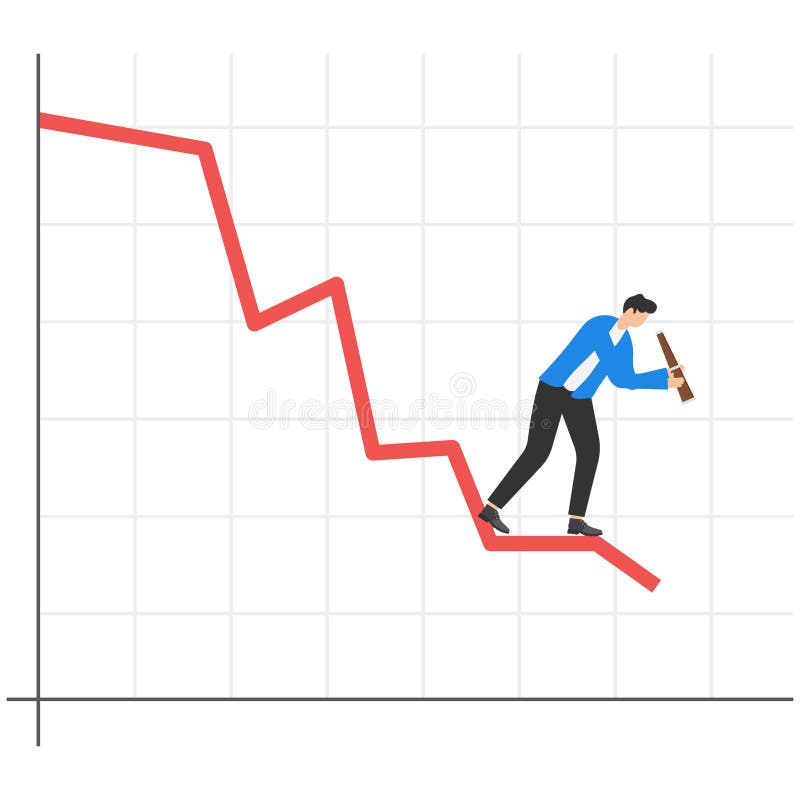
Free with trial Businessman standing on a falling down red graph looks for the bottom. Decrease crash vectors Businessman standing on a falling down red graph looks for the bottom.
Free with trial The business concept of both crisis and recovery. Decrease crash illustrations Business concept of both crisis and recovery
Free with trial A cartoon bear in a suit represents a bear market, with a downward trending graph and coins, symbolizing financial loss and economic recession. Decrease crash illustrations Bear Market Illustration - Financial Downturn and Economic Recession. A cartoon bear in a suit represents a bear market, with a downward trending graph and coins, symbolizing financial loss and economic recession
Free with trial Downward Trend Bar Chart Showing Losses with a Declining Red Arrow. Decrease crash vectors Downward Trend Bar Chart Showing Losses with a Declining Red Arrow
Free with trial Netherlands real estate market going down concept with red arrows glowing and house shapes. Decrease crash illustrations Netherlands real estate market going down concept with red arrows glowing and house shapes
Free with trial Design a simple, minimalistic red downward arrow shaped like a folded ribbon or zigzag line. The arrow should start from the top left and sharply descend in a few angular segments, ending in a clean, bold point facing down. Use flat colors (primarily red) with minimal or no shading. The overall style should be clean and modern, with no gradients, textures, or background details�just a plain white background and a bold, geometric arrow indicating decline. Decrease crash vectors Red Down Arrow Symbolizing Economic Recession or Financial Crisis. Design a simple, minimalistic red downward arrow shaped like a folded ribbon or zigzag line. The arrow should start from the top left and sharply descend in a few angular segments, ending in a clean, bold point facing down. Use flat colors (primarily red) with minimal or no shading. The overall style should be clean and modern, with no gradients, textures, or background details�just a plain white background and a bold, geometric arrow indicating decline.
Free with trial Financial concept image featuring a blue bar chart with a red downward arrow, illustrating decline, recession, or loss over time. Ideal for presentations, reports, infographics, economic forecasts, and business documentation. Clean, clear, and professional visual, created ai. Decrease crash illustrations Business bar chart showing financial decline with downward arrow. Financial concept image featuring a blue bar chart with a red downward arrow, illustrating decline, recession, or loss over time. Ideal for presentations, reports, infographics, economic forecasts, and business documentation. Clean, clear, and professional visual, created ai.
Free with trial A white percentage symbol on a sand dune, paired with a floating red downward arrow against a pale sky. Image. Decrease crash illustrations White Percentage Sign with Red Downward Arrow in Sandy Landscape. A white percentage symbol on a sand dune, paired with a floating red downward arrow against a pale sky. Image
Free with trial A laptop on a table with a digital financial graph overlay displaying fluctuating lines The screen is off, and the indoor setting suggests an office or study room For Social Media Post Size. Decrease crash illustrations Laptop on desk with overlayed fluctuating digital financial graph. A laptop on a table with a digital financial graph overlay displaying fluctuating lines The screen is off, and the indoor setting suggests an office or study room For Social Media Post Size
Free with trial Digita blue bar charts descend steadily across a digital grid, illustrating a decline in financial performance and market trends. Downward arrows emphasize loss, negative growth, and economic challenges, while smooth transitions and a tech-inspired layout enhance the visual impact of the data downturn. Decrease crash illustrations Digital blue bar chart with decreasing business concept. Digita blue bar charts descend steadily across a digital grid, illustrating a decline in financial performance and market trends. Downward arrows emphasize loss, negative growth, and economic challenges, while smooth transitions and a tech-inspired layout enhance the visual impact of the data downturn.
Free with trial Economic recovery concept with the line charts. Decrease crash illustrations Economic recovery concept with the line charts
Free with trial A red line graph against a stormy sky, representing financial crisis. Created with the help of Generative AI tools. Decrease crash illustrations A red line graph against a stormy sky, representing financial crisis.
Free with trial Illustration showing a yellow warning sign with the word "Tariffs" with the Capitol building and a stock market graph in the background. Economic concept about international trade and politics. Decrease crash illustrations Tariffs warning sign with Capitol building and stock market graph. Illustration showing a yellow warning sign with the word "Tariffs" with the Capitol building and a stock market graph in the background. Economic concept about international trade and politics
Free with trial Financial crisis, economic downturn, stock market crash, recession, decreasing profits, falling revenue, business loss, investment loss, financial instability, economic decline, money loss. Decrease crash vectors Falling Stock Market Graph Showing Financial Crisis and Recession. Financial crisis, economic downturn, stock market crash, recession, decreasing profits, falling revenue, business loss, investment loss, financial instability, economic decline, money loss.
Free with trial Red glowing arrow made of light and sparks indicates a downward trend. Financial graph showing fall in market value or business decline concept. Decrease crash illustrations Red glowing arrow made of light and sparks indicates a downward trend
Free with trial Human showing empty pocket with a decline arrows. Economic recession crisis. No moneyn. Decrease crash illustrations Human showing empty pocket with a decline arrows. Economic recession crisis. No money
Free with trial Human showing empty pocket with a decline arrows. Economic recession crisis. No moneyn. Decrease crash illustrations Human showing empty pocket with a decline arrows. Economic recession crisis. No money
Free with trial Digital stock market ticker displaying falling financial data against urban twilight backdrop, highlighting market decline. Decrease crash illustrations Red digital stock market ticker showing decreasing values, located outdoors in a modern city at dusk. Digital stock market ticker displaying falling financial data against urban twilight backdrop, highlighting market decline
Free with trial A red, dotted world globe is overlaid with a declining stock market chart, symbolizing a global economic downturn. The image conveys financial crisis and market volatility. Decrease crash illustrations Global Market Downturn: Red World Globe with Declining Stock Chart. A red, dotted world globe is overlaid with a declining stock market chart, symbolizing a global economic downturn. The image conveys financial crisis and market volatility
Free with trial Economy business crisis and graph investment down on red background. arrow trading chart candlestick fall. vector illustration fantastic technology. Decrease crash vectors Economy business crisis and graph investment down on red background. arrow trading chart candlestick fall.
Free with trial Parking lot full of many cars with a large red arrow pointing downward. Declining business, sales, or economic performance concept for vehicle industry report. Decrease crash illustrations Parking lot full of many cars with a large red arrow pointing downward
Free with trial A 3D render of a fluctuating arrow pointing down. Symbolizes financial decline, stock market loss, or a negative data trend. Ideal for business infographics. Isolated. Decrease crash illustrations 3D Arrow Down Icon for Financial Decline, Stock Market Loss, and Graph. A 3D render of a fluctuating arrow pointing down. Symbolizes financial decline, stock market loss, or a negative data trend. Ideal for business infographics. Isolated
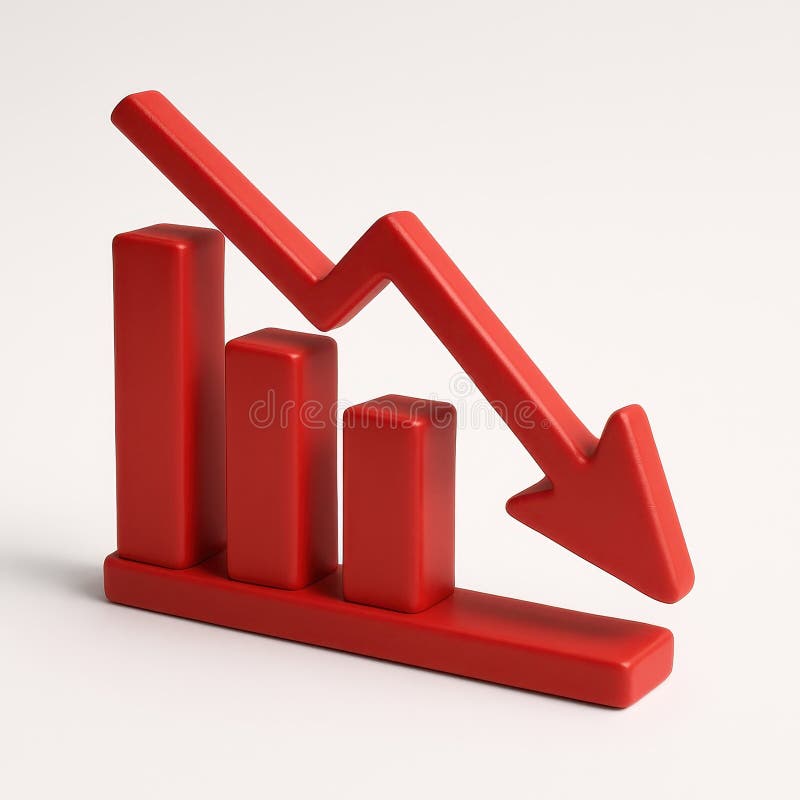
Free with trial A striking 3D render visualizes economic decline with a vibrant red bar graph against a clean white background. This impactful image vividly represents a financial crisis and recession, showcasing a clear downward trend through its falling bars and an implied arrow. It symbolizes loss, failure, and potential bankruptcy within the business and finance sectors. Ideal for illustrating articles on the. Decrease crash illustrations Red economic decline bar graph depicting financial downfall and negative trends on white background. A striking 3D render visualizes economic decline with a vibrant red bar graph against a clean white background. This impactful image vividly represents a financial crisis and recession, showcasing a clear downward trend through its falling bars and an implied arrow. It symbolizes loss, failure, and potential bankruptcy within the business and finance sectors. Ideal for illustrating articles on the
Free with trial Two red, downward trending arrow graphs illustrate a significant market decline, representing financial loss or economic downturn. The jagged lines show fluctuating decline. Decrease crash vectors Red Downward Trending Arrows Indicating Market Decline, Financial Loss. Two red, downward trending arrow graphs illustrate a significant market decline, representing financial loss or economic downturn. The jagged lines show fluctuating decline
Free with trial A red downward trending arrow is superimposed over a stack of gold bullion bars. The bars are arranged in a pyramid formation on a white background. The red arrow extends diagonally from the top of the stack towards the bottom right, indicating a decrease or decline. Gold bars symbolize wealth or financial investment, while the arrow suggests a drop in value or market trend. Decrease crash illustrations Red downward trending arrow superimposed over a stack of gold bullion bars on a white background. A red downward trending arrow is superimposed over a stack of. A red downward trending arrow is superimposed over a stack of gold bullion bars. The bars are arranged in a pyramid formation on a white background. The red arrow extends diagonally from the top of the stack towards the bottom right, indicating a decrease or decline. Gold bars symbolize wealth or financial investment, while the arrow suggests a drop in value or market trend.
Free with trial Financial crisis, business bankruptcy, money loss, and economy collapse concepts. Vector of crisis financial, bankruptcy and recession illustration. Decrease crash vectors Financial crisis, business bankruptcy, money loss, and economy collapse concepts
Free with trial A desolate industrial landscape, mirroring economic downturn. The image evokes a sense of environmental and financial ruin. Decrease crash illustrations Economic Collapse Amidst Environmental Devastation: A Dystopian Vision. A desolate industrial landscape, mirroring economic downturn. The image evokes a sense of environmental and financial ruin
Free with trial This image captures a sprawling urban cityscape at dusk, featuring numerous illuminated skyscrapers. A prominent red arrow graphic overlays the scene, indicating a sharp downward trend or decline. The setting sun casts a warm glow on the sky, contrasting with the cool tones of the city lights and buildings. This visual metaphor is ideal for representing financial market crashes, economic recession, business failure, or any concept of negative growth in a metropolitan context. Decrease crash illustrations Cityscape Downturn: Financial Decline Overlay on Urban Skyline at Dusk. This image captures a sprawling urban cityscape at dusk, featuring numerous illuminated skyscrapers. A prominent red arrow graphic overlays the scene, indicating a sharp downward trend or decline. The setting sun casts a warm glow on the sky, contrasting with the cool tones of the city lights and buildings. This visual metaphor is ideal for representing financial market crashes, economic recession, business failure, or any concept of negative growth in a metropolitan context.
Free with trial Flat vector design illustration of bankruptcy finance business concept. design vector illustration. Decrease crash vectors Flat vector design illustration of bankruptcy finance business concept
Free with trial This black and white icon illustrates the impact of economic downturn on consumer spending. Decrease crash illustrations Shopping cart receiving shock with arrow pointing down indicating economic crisis. This black and white icon illustrates the impact of economic downturn on consumer spending
Free with trial Red arrow pointing down on digital screen indicating falling stock exchange prices during trading session, with sparks flying. Decrease crash illustrations Stock market crashing with red arrow displaying on digital screen and sparks flying. Red arrow pointing down on digital screen indicating falling stock exchange prices during trading session, with sparks flying
Free with trial Business man with a briefcase walking on an arrow suddenly falling down. Decrease crash vectors Business man with a briefcase walking on an arrow suddenly falling down
Free with trial Bitcoin crypto currency red coins in bubbles, e-commerce investment concept. Decrease crash illustrations Bitcoin crypto currency coins in red bubbles, e-commerce investment concept
Free with trial Falling red chart arrow with piggy bank on blue background. Economic recession, losing savings concept. 3D Rendering. Decrease crash illustrations Falling red chart arrow with piggy bank on blue background. Economic recession, losing savings concept.
Free with trial Stack of gold coins accompanied by a bold red downward arrow demonstrates a negative economic trend against a dark background, ideal for illustrating financial crisis, market decline, or investment risks. Decrease crash illustrations Gold Coins with Red Arrow Showing Economic Downturn on Dark Background. Stack of gold coins accompanied by a bold red downward arrow demonstrates a negative economic trend against a dark background, ideal for illustrating financial crisis, market decline, or investment risks
Free with trial Wallet with a decline arrows. Economic recession crisis. No money. Decrease crash illustrations Wallet with a decline arrows. Economic recession crisis. No money
Free with trial Wallet with a decline arrows. Economic recession crisis. No moneyn. Decrease crash illustrations Wallet with a decline arrows. Economic recession crisis. No money
Free with trial Financial business concept going bankrupt flat vector design. design vector illustration. Decrease crash vectors Financial business concept going bankrupt flat vector design
Free with trial Financial business concept going bankrupt flat vector design. design vector illustration. Decrease crash vectors Financial business concept going bankrupt flat vector design illustration. financial business concept going bankrupt flat vector design.design vector illustration
Free with trial A hand holding a pen traces a downward-sloping red line over a stock market data screen, symbolizing financial loss or a market crash. The image conveys a sense of concern and economic instability. The composition uses a shallow depth of field, focusing on the hand and the red line. Decrease crash illustrations Financial Downturn: Hand Tracing Red Stock Market Decline on Data Screen. A hand holding a pen traces a downward-sloping red line over a stock market data screen, symbolizing financial loss or a market crash. The image conveys a sense of concern and economic instability. The composition uses a shallow depth of field, focusing on the hand and the red line
Free with trial A businessman in a suit points down at a red graph indicating a financial decline. The image symbolizes economic downturn, market crash, or business losses. The lighting is soft, and the composition focuses on the hand and graph. Decrease crash illustrations Businessman\'s Hand Pointing Downward on Red Financial Decline Graph, Economic Crisis. A businessman in a suit points down at a red graph indicating a financial decline. The image symbolizes economic downturn, market crash, or business losses. The lighting is soft, and the composition focuses on the hand and graph
Free with trial This image shows a downward trending stock market graph generated by AI, illustrating a period of significant decline. The detailed chart provides a visual representation of financial instability and potential losses. This AI-generated visualization is useful for understanding market trends and vol. Decrease crash illustrations AI-Generated Stock Market Decline. This image shows a downward trending stock market graph generated by AI, illustrating a period of significant decline. The detailed chart provides a visual representation of financial instability and potential losses. This AI-generated visualization is useful for understanding market trends and vol
Free with trial This image shows a stock market graph with a downward trend, generated by AI. The red line vividly depicts a significant market decline, potentially indicating economic instability or investor uncertainty. Analyzing this data requires further context and analysis. Decrease crash illustrations AI-Generated Stock Market Decline. This image shows a stock market graph with a downward trend, generated by AI. The red line vividly depicts a significant market decline, potentially indicating economic instability or investor uncertainty. Analyzing this data requires further context and analysis.
Free with trial A whiteboard displays a hand-drawn graph showing a significant downward trend in stock prices. This visual representation of a market downturn was generated by AI and emphasizes the volatility and potential risks associated with stock market investments. The image is a clear, concise illustration o. Decrease crash illustrations AI-Generated Stock Market Decline. A whiteboard displays a hand-drawn graph showing a significant downward trend in stock prices. This visual representation of a market downturn was generated by AI and emphasizes the volatility and potential risks associated with stock market investments. The image is a clear, concise illustration o
Free with trial Recession concept with golden coins stacks and falling red arrow, 3D rendering isolated on white background. Decrease crash illustrations Recession concept with golden coins stacks and falling red arrow, 3D rendering
Free with trial Human showing wallet with a decline arrows. Economic recession crisis. No money. Decrease crash illustrations Human showing wallet with a decline arrows. Economic recession crisis. No money
Free with trial Human showing wallet with a decline arrows. Economic recession crisis. No money. Decrease crash illustrations Human showing wallet with a decline arrows. Economic recession crisis. No money
Free with trial A cartoon illustration of a businessman in a suit sitting on the floor, looking stressed with a downward-pointing red arrow indicating financial or business loss. The image reflects concepts of failure, crisis, and economic downturn. Decrease crash illustrations Stressed businessman sitting on floor with declining graph indicating business loss. A cartoon illustration of a businessman in a suit sitting on the floor, looking stressed with a downward-pointing red arrow indicating financial or business loss. The image reflects concepts of failure, crisis, and economic downturn.
Free with trial Bitcoin crypto currency golden coins in bubbles, e-commerce investment concept. Decrease crash illustrations Bitcoin crypto currency golden coins in bubbles, e-commerce investment concept
Free with trial Down arrow financial crisis business pandemic hmpv virus corona virus lockdown loss economic market stock finance chart global downfall economy inflation bad situation money illustration. Decrease crash vectors Down arrow financial crisis business for pandemic hmpv virus corona virus lockdown illustration vector illustrations icon. Down arrow financial crisis business pandemic hmpv virus corona virus lockdown loss economic market stock finance chart global downfall economy inflation bad situation money illustration
Free with trial Business world Crisis concept. a businessman falling with down arrow. Failure, bankruptcy, debt, risk in business concept. vector, illustration. Decrease crash illustrations Business world Crisis concept. a businessman falling with down arrow. Failure, bankruptcy, debt, risk in business concept.
Free with trial Sharp downward sloping line graph red arrow pointing down red decline failure Vector illustration. Decrease crash illustrations Sharp downward sloping line graph, red arrow pointing down, red, decline, failure. Sharp downward sloping line graph red arrow pointing down red decline failure Vector illustration.